伍德里奇计量经济学 (3)
伍德里奇计量经济学第六版答案Chapter-3
CHAPTER 3TEACHING NOTESFor undergraduates, I do not work through most of the derivations in this chapter, at least not in detail. Rather, I focus on interpreting the assumptions, which mostly concern the population. Other than random sampling, the only assumption that involves more than population considerations is the assumption about no perfect collinearity, where the possibility of perfect collinearity in the sample (even if it does not occur in the population) should be touched on. The more important issue is perfect collinearity in the population, but this is fairly easy to dispense with via examples. These come from my experiences with the kinds of model specification issues that beginners have trouble with.The comparison of simple and multiple regression estimates – based on the particular sample at hand, as opposed to their statistical properties – usually makes a strong impression. Sometimes I do not bother with the “partialling out” interpretation of multiple regression.As far as statistical properties, notice how I treat the problem of including an irrelevant variable: no separate derivation is needed, as the result follows form Theorem 3.1.I do like to derive the omitted variable bias in the simple case. This is not much more difficult than showing unbiasedness of OLS in the simple regression case under the first four Gauss-Markov assumptions. It is important to get the students thinking about this problem early on, and before too many additional (unnecessary) assumptions have been introduced.I have intentionally kept the discussion of multicollinearity to a minimum. This partly indicates my bias, but it also reflects reality. It is, of course, very important for students to understand the potential consequences of having highly correlated independent variables. But this is often beyond our control, except that we can ask less of our multiple regression analysis. If two or more explanatory variables are highly correlated in the sample, we should not expect to precisely estimate their ceteris paribus effects in the population.I find extensive t reatments of multicollinearity, where one “tests” or somehow “solves” the multicollinearity problem, to be misleading, at best. Even the organization of some texts gives the impression that imperfect collinearity is somehow a violation of the Gauss-Markov assumptions. In fact, they include multicollinearity in a chapter or part of the book devoted to “violation of the basic assumptions,” or something like that. I have noticed that master’s students who have had some undergraduate econometrics are often confused on the multicollinearity issue. It is very important that students not confuse multicollinearity among the included explanatory variables in a regression model with the bias caused by omitting an important variable.I do not prove the Gauss-Markov theorem. Instead, I emphasize its implications. Sometimes, and certainly for advanced beginners, I put a special case of Problem 3.12 on a midterm exam, where I make a particular choice for the function g(x). Rather than have the students directly comparethe variances, they should appeal to the Gauss-Markov theorem for the superiority of OLS over any other linear, unbiased estimator.SOLUTIONS TO PROBLEMS3.1 (i) hsperc is defined so that the smaller it is, the lower the student’s standing in high school . Everything else equal, the worse the student’s standing in high school, the lower is his/her expected college GPA.(ii) Just plug these values into the equation:colgpa = 1.392 - .0135(20) + .00148(1050) = 2.676.(iii) The difference between A and B is simply 140 times the coefficient on sat , because hsperc is the same for both students. So A is predicted to have a score .00148(140) ≈ .207 higher.(iv) With hsperc fixed, colgpa ∆ = .00148∆sat . Now, we want to find ∆sat such that colgpa ∆ = .5, so .5 = .00148(∆sat ) or ∆sat = .5/(.00148) ≈ 338. Perhaps not surprisingly, a large ceteris paribus difference in SAT score – almost two and one-half standard deviations – is needed to obtain a predicted difference in college GPA or a half a point.3.2 (i) Yes. Because of budget constraints, it makes sense that, the more siblings there are in a family, the less education any one child in the family has. To find the increase in the number of siblings that reduces predicted education by one year, we solve 1 = .094(∆sibs ), so ∆sibs = 1/.094 ≈ 10.6.(ii) Holding sibs and feduc fixed, one more year of mother’s education implies .131 years more of predicted education. So if a mother has four more years of education, her son is predicted to have about a half a year (.524) more years of education.(iii) Since the number of siblings is the same, but meduc and feduc are both different, the coefficients on meduc and feduc both need to be accounted for. The predicted difference in education between B and A is .131(4) + .210(4) = 1.364.3.3 (i) If adults trade off sleep for work, more work implies less sleep (other things equal), so 1β < 0.(ii) The signs of 2β and 3β are not obvious, at least to me. One could argue that more educated people like to get more out of life, and so, other things equal, they sleep less (2β < 0). The relationship between sleeping and age is more complicated than this model suggests, and economists are not in the best position to judge such things.(iii) Since totwrk is in minutes, we must convert five hours into minutes: ∆totwrk = 5(60) = 300. Then sleep is predicted to fall by .148(300) = 44.4 minutes. For a week, 45 minutes less sleep is not an overwhelming change.(iv) More education implies less predicted time sleeping, but the effect is quite small. If we assume the difference between college and high school is four years, the college graduate sleeps about 45 minutes less per week, other things equal.(v) Not surprisingly, the three explanatory variables explain only about 11.3% of the variation in sleep . One important factor in the error term is general health. Another is marital status, and whether the person has children. Health (however we measure that), marital status, and number and ages of children would generally be correlated with totwrk . (For example, less healthy people would tend to work less.)3.4 (i) A larger rank for a law school means that the school has less prestige; this lowers starting salaries. For example, a rank of 100 means there are 99 schools thought to be better.(ii) 1β > 0, 2β > 0. Both LSAT and GPA are measures of the quality of the entering class. No matter where better students attend law school, we expect them to earn more, on average. 3β, 4β > 0. The number of volumes in the law library and the tuition cost are both measures of the school quality. (Cost is less obvious than library volumes, but should reflect quality of the faculty, physical plant, and so on.)(iii) This is just the coefficient on GPA , multiplied by 100: 24.8%.(iv) This is an elasticity: a one percent increase in library volumes implies a .095% increase in predicted median starting salary, other things equal.(v) It is definitely better to attend a law school with a lower rank. If law school A has a ranking 20 less than law school B, the predicted difference in starting salary is 100(.0033)(20) =6.6% higher for law school A.3.5 (i) No. By definition, study + sleep + work + leisure = 168. Therefore, if we change study , we must change at least one of the other categories so that the sum is still 168.(ii) From part (i), we can write, say, study as a perfect linear function of the otherindependent variables: study = 168 - sleep - work - leisure . This holds for every observation, so MLR.3 violated.(iii) Simply drop one of the independent variables, say leisure :GPA = 0β + 1βstudy + 2βsleep + 3βwork + u .。
学习笔记:伍德里奇《计量经济学》第五版-第三章 多元回归分析:估计
y = b 0+ b 1x 1+ b 2x 2+ . . . b k x k + u一、多元线性回归模型1.我们可以研究控制一些变量不变的条件下,其他变量对y的影响,而不是假定他们不相关。
Cons = b 0+ b 1inc+b 2inc 2 +u2.我们还能推广变量之间的函数关系如:通过在模型中包含更多的变量,我们更好的达到了SLR.4所表达的目的E(u|x 1,x 2, …,x k ) = 0 (3.8)HYP.1一般多元回归模型的关键假定(u和所有x都不相关):( )仍然是最小化残差和:对(3.12)求k +1次偏导得一阶条件(交给计算机计算)(此时假定k +1个方程只能得到估计值得唯一解2.1 如何得到OLS 估计值例3.1分析两个系数时,可得出当我们把其中一个因素涵盖在模型中时,另外一个因素的预测就变得不有力了1.系数表示局部效应(控制其他变量不变时,对y的效应)多元回归分析给了我们在收集不到“其他条件不变”时的数据仍有同样效果的能力2.“控制其他变量不变”的含义3.同时改变不止一个自变量(只需要将效应加和)2.2 对OLS 回归方程的解释从单变量情形加以推广,得:1.残差的样本平均值为02.每个自变量和OLS 残差之间的样本协方差为0。
因此OLS 拟合值和OLS 残差之间的样本协方差也为03.点总位于OLS 回归线上(性质1. 2.由一阶条件得,性质3.由1.可得2.3 OLS 的拟合值和残差( )其中 是x1对其他变量回归后的残差(即排除其他变量对x1的影响,类似矢量正交)2.4 对“排除其他变量影响”的解释( )(是 对 简单回归的斜率1.样本中x2对y的偏效应为0,即2.x1和x 2不相关,即(1. 2.可解释、 的差异由(3.23)知,在两种情况下利用矢量正交的理解考虑简单回归和两个自变量的回归:2.5简单回归和多元回归估计值比较可以证明,R2的另一种理解是 的实际值与其拟合值 的相关系数的平方,其中2.6 拟合优度(与简单回归大致相同)二、普通最小二乘法(多元线性回归模型的代数特征和对方程的解释)使用提示:1.该笔记是对伍德里奇《计量经济学》第五版第三章学习过程中的内容梳理2.由于本人水平有限,单独看该笔记估计会很吃力,且很可能出现错误,建议结合书本进行理解3.希望能够对想学习计量经济学的人起到一点点帮助第三章多元回归分析:估计2020年3月19日10:47由于定义下增加解释变量不会降低R2,所以判断一个解释变量是否应该放入模型的依据应该是该解释变量在总体中对y的偏效应是否非02.7 过原点的回归1.之前推导的性质不再成立,特别是OLS残差的样本平均值不再是02.计算R2没有特定的规则3.当截距项b0不等于0,斜率参数OLS估计量将有偏误;当截距项b0=0,估计带截距项方程的代价是,OLS斜率估计量的方差会更大2.8 OLS估计量的期望值MLR.1(线性于参数)MLR.2(随机抽样)MLR.3(不存在完全共线性,允许一定程度的相关)(在定义函数时要小心不要违背了MLR.3MLR.4(条件均值为0)(内生解释变量:解释变量可能与误差项相关定理3.1 OLS的无偏性()2.9 过度设定和设定不足(多了无关变量和少了解释变量)2.9.1过度设定(不影响OLS估计量的无偏性,但影响OLS估计量的方差)2.9.2设定不足1.简单情形:从一个斜率参数到两个斜率参数由(3.23):取均值得偏误为:(因此偏误的方向取决于两个符号,偏误的大小取决于两者之积,在应用中可以通过常识来判断偏误方向2.扩展情形:从两个斜率参数到三个斜率参数当你假设和不相关时,就可以证明和的关系和简单情形一样2.10 OLS估计量的方差MLR.5(同方差性,不仅可以简化公式,还得到了有效性)定理3.2 OLS斜率估计量的抽样方差在MLR.1-5下,以自变量的样本值为条件,有()(是的总样本波动,则是对所有其他自变量(并包含一个截距项)回归所得到的由(3.51)可知,估计量的抽样方差由三个要素决定:1.误差方差(噪声越大,越难估计)2.的总样本波动(越分散,越容易估计)3.自变量之间的线性关系(和其他自变量相关性越高,越不利于估计(很高的并不一定有问题,抽样方差的大小还要取决于剩下两个因素,可以通过收集更多的数据来削减多重共线性(当考虑某一个自变量 的方差时,若 和其他自变量均无关,那么其他自变量间的关系是不造成影响的,某些经济学家为了分离特定变量的因果效应,而在模型中包括许多控制因素,但这并不影响因果效应的证实( )当含有两个解释变量时:( )当含有一个解释变量时:((3.54)和(3.55)表明除非样本中x1和x2不相关,否则 <1.当 =0时,两个都无偏,但 < ,所以前者更好2.当不等于0时,不放x 2进去会导致有偏,放了x 2进去会导致方差增加,但我们喜欢把x2放进去的理由是:不放进去的偏误不会随着样本容量扩大而缩减,而放进去增加的方差却会随着样本容量的扩大逐渐缩小至0所以有两个结论:2.10.1 过度设定的方差(建立在过度设定无偏讨论的基础上)( )2.10.2 OLS 估计量的标准误(与简单回归相同)在假定MLR.1-5下,有(MLR .5若不满足(即异方差),会使标准误失效(第二种表达清楚说明了随着样本容量的扩大,在其他三项( 、 、 )都趋于常数的时候,估计量标准误是如何变小的因此得估计量的标准误:定理3.3 的无偏估计OLS 估计量是最优线性无偏估计量(如(3.22)所示的线性、无偏误、在线性无偏估计量中方差最小在MLR.1-5下,得定理3.4 高斯-马尔科夫定理2.11 对OLS 估计的一个正确认识。
计量经济学(伍德里奇第三版中文版)课后习题答案

第1章解决问题的办法1.1(一)理想的情况下,我们可以随机分配学生到不同尺寸的类。
也就是说,每个学生被分配一个不同的类的大小,而不考虑任何学生的特点,能力和家庭背景。
对于原因,我们将看到在第2章中,我们想的巨大变化,班级规模(主题,当然,伦理方面的考虑和资源约束)。
(二)呈负相关关系意味着,较大的一类大小是与较低的性能。
因为班级规模较大的性能实际上伤害,我们可能会发现呈负相关。
然而,随着观测数据,还有其他的原因,我们可能会发现负相关关系。
例如,来自较富裕家庭的儿童可能更有可能参加班级规模较小的学校,和富裕的孩子一般在标准化考试中成绩更好。
另一种可能性是,在学校,校长可能分配更好的学生,以小班授课。
或者,有些家长可能会坚持他们的孩子都在较小的类,这些家长往往是更多地参与子女的教育。
(三)鉴于潜在的混杂因素- 其中一些是第(ii)上市- 寻找负相关关系不会是有力的证据,缩小班级规模,实际上带来更好的性能。
在某种方式的混杂因素的控制是必要的,这是多元回归分析的主题。
1.2(一)这里是构成问题的一种方法:如果两家公司,说A和B,相同的在各方面比B公司à用品工作培训之一小时每名工人,坚定除外,多少会坚定的输出从B公司的不同?(二)公司很可能取决于工人的特点选择在职培训。
一些观察到的特点是多年的教育,多年的劳动力,在一个特定的工作经验。
企业甚至可能歧视根据年龄,性别或种族。
也许企业选择提供培训,工人或多或少能力,其中,“能力”可能是难以量化,但其中一个经理的相对能力不同的员工有一些想法。
此外,不同种类的工人可能被吸引到企业,提供更多的就业培训,平均,这可能不是很明显,向雇主。
(iii)该金额的资金和技术工人也将影响输出。
所以,两家公司具有完全相同的各类员工一般都会有不同的输出,如果他们使用不同数额的资金或技术。
管理者的素质也有效果。
(iv)无,除非训练量是随机分配。
许多因素上市部分(二)及(iii)可有助于寻找输出和培训的正相关关系,即使不在职培训提高工人的生产力。
伍德里奇计量经济学知识点总结

【伍德里奇计量经济学知识点总结】1. 基本概念伍德里奇计量经济学是指利用数学、统计学和计量经济学的方法对经济现象进行定量分析和预测的一门学科。
它是经济学的重要分支,通过建立数学模型和使用实证数据进行检验,可以揭示经济规律和进行政策分析。
2. 经典假定在伍德里奇计量经济学中,有一些经典的假定是非常重要的。
首先是线性假定,即假定经济关系是线性的;其次是随机抽样假定,即样本是随机抽取的,能够代表总体;还有就是无多重共线性、异方差和自相关等假定。
3. 模型建立在进行伍德里奇计量经济学的研究时,首先需要建立适当的计量经济模型。
常见的模型包括线性回归模型、多元回归模型、时间序列模型和横断面数据模型等。
在建立模型时,需要考虑模型的选择、变量的设定和函数形式的确定等问题。
4. 参数估计一旦模型建立完成,接下来就需要进行参数估计。
通常使用最小二乘法进行参数估计,通过最小化残差平方和来确定参数的估计值。
在进行参数估计时,需要考虑参数的一致性、有效性和假设检验等问题。
5. 模型诊断模型诊断是伍德里奇计量经济学中的重要环节,通过对模型的有效性、稳健性和适用性进行诊断,可以确保模型的准确性和可靠性。
模型诊断包括多重共线性、异方差、自相关和样本外验证等内容。
6. 预测和政策分析在进行伍德里奇计量经济学的研究时,需要对模型进行预测和政策分析。
通过对模型的预测能力和政策效应进行分析,可以为决策者提供重要的参考信息,并对经济现象进行深入理解和解释。
在我看来,伍德里奇计量经济学是一门非常有趣且重要的学科,它不仅可以帮助我们理解经济现象背后的规律,还可以为政策制定提供重要参考。
通过建立数学模型和使用实证数据进行检验,我们能够更加深入地探讨经济问题并作出合理的判断。
我也深刻意识到在进行伍德里奇计量经济学研究时,需要综合运用数学、统计学和经济学知识,这对我们的综合能力提出了更高的要求。
总结回顾起来,伍德里奇计量经济学是一门综合性强、逻辑性强的学科,在研究过程中需要我们对经济现象有着深刻的理解和分析能力。
计量经济学导论伍德里奇课后答案中文

2.10(iii) From (2.57), Var(1ˆβ) = σ2/21()n i i x x =⎛⎫- ⎪⎝⎭∑. 由提示:: 21n i i x=∑ ≥21()n i i x x =-∑, and so Var(1β ) ≤ Var(1ˆβ). A more direct way to see this is to write(一个更直接的方式看到这是编写) 21()n ii x x =-∑ = 221()n i i x n x =-∑, which is less than21n i i x=∑unless x = 0.(iv)给定的c 2i x 但随着x 的增加, 1ˆβ的方差与Var(1β )的相关性也增加.0β小时1β 的偏差也小.因此, 在均方误差的基础上不管我们选择0β还是1β 要取决于0β,x ,和n 的大小 (除了 21n i i x=∑的大小).3.7We can use Table 3.2. By definition, 2β > 0, and by assumption, Corr(x 1,x 2) < 0. Therefore, there is anegative bias in 1β : E(1β ) < 1β. This means that, on average across different random samples, the simple regression estimator underestimates the effect of the training program. It is even possible that E(1β ) is negative even though 1β > 0. 我们可以使用表3.2。
根据定义,> 0,由假设,科尔(X1,X2)<0。
因此,有一个负偏压为:E ()<。
伍德里奇《计量经济学导论》笔记和课后习题详解(简单回归模型)【圣才出品】

β1 就是斜率参数。
②给定零条件均值假定 E(u|x)=0,把斱程中的 y 看成两个部分是比较有用的。一
部分是表示 E(y|x)的 β0+β1一个
部分是被称为非系统部分的 u,即丌能由 x 觋释的那一部分。
二、普通最小二乘法的推导
1.最小二乘估计值
表 2-1 简单回归的术语
3.零条件均值假定 (1)零条件均值 u 的平均值不 x 值无关。可以把它写作:E(u|x)=E(u)。当斱程成立时,就说 u 的均值独立亍 x。 (2)零条件均值假定的意义 ①零条件均值假定给出 β1 的另一种非常有用的觋释。以 x 为条件叏期望值,幵利用 E
1 / 33
圣才电子书 十万种考研考证电子书、题库视频学习平台
第 2 章 简单回归模型
2.1 复习笔记
一、简单回归模型的定义 1.双发量线性回归模型 一个简单的斱程是:y=β0+β1x+u。 假定斱程在所关注的总体中成立,它便定义了一个简单线性回归模型。因为它把两个发 量 x 和 y 联系起来,所以又把它称为两发量戒者双发量线性回归模型。 2.回归术语
E x y β0 β1x 0
得到
1 n
n i1
yi βˆ0 βˆ1xi
0
和
2 / 33
圣才电子书 十万种考研考证电子书、题库视频学习平台
1
n
n i 1
xi
yi βˆ0 βˆ1xi
0
这两个斱程可用来觋出 βˆ0 和 βˆ1 , y βˆ0 βˆ1x ,则 βˆ0 y βˆ1x 。
量了 yi 的样本发异,SSR 度量了 ui 的样本发异。y 的总发异总能表示成觋释了的发异和未
觋释的发异 SSR 乊和。因此,SST=SSE+SSR。
大学伍德里奇计量经济学第三版教师手册-CHAPTER 16

20XX年复习资料大学复习资料专业:班级:科目老师:日期:CHAPTER 20XXXXTEACHING NOTESI spend some time in Section 20XXXX.1 trying to distinguish between good and inappropriate uses of SEMs. Naturally, this is partly determined by my taste, and many applications fall into a gray area. But students who are going to learn about SEMS should know that just because two (or more) variables are jointly determined does not mean that it is appropriate to specify and estimate an SEM. I have seen many bad applications of SEMs where no equation in the system can stand on its own with an interesting ceteris paribus interpretation. In most cases, the researcher either wanted to estimate a tradeoff between two variables, controlling for other factors –in which case OLS is appropriate – or should have been estimating what is (often pejoratively) called the “reduced form.”The identification of a two-equation SEM in Section 20XXXX.3 is fairly standard except that I emphasize that identification is a feature of the population. (The early work on SEMs also had this emphasis.) Given the treatment of 2SLS in Chapter 20XXXX, the rank condition is easy to state (and test).Romer’s (20XXXX0XX3) inflation and openness example is a nice example of using aggregate cross-sectional data. Purists may not like the labor supply example, but it has become common to view labor supply as being a two-tier decision. While there are different ways to model the two tiers, specifying a standard labor supply function conditional on working is not outside the realm of reasonable models. Section 20XXXX.5 begins by expressing doubts of the usefulness of SEMs for aggregate models such as those that are specified based on standard macroeconomic models. Such models raise all kinds of thorny issues; these are ignored in virtually all texts, where such models are still used to illustrate SEM applications.SEMs with panel data, which are covered in Section 20XXXX.6, are not covered in any other introductory text. Presumably, if you are teaching this material, it is to more advanced students in a second semester, perhaps even in a more applied course. Once students have seen first differencing or the within transformation, along with IV methods, they will find specifying and estimating models of the sort contained in Example 20XXXX.8 straightforward. Levitt’s example concerning prison populations is especially convincing because his instruments seem to be truly exogenous.SOLUTIONS TO PROBLEMS20XXXX.1 (i) If1= 0 then y1= 1z1+ u1, and so theright-hand-side depends only on the exogenous variable z1 and the error term u1. This then is the reduced form for y1. If 1= 0, the reduced form for y1 is y1= 2z2+ u2. (Note that having both1 and2equal zero is not interesting as it implies the bizarrecondition u2–u1= 1z12z2.)If10 and2= 0, we can plug y1= 2z2+ u2into the firstequation and solve for y2:2z2 +u2 = 1y2 + 1z1 + u1or1y2 = 1z12z2 + u1–u2.Dividing by1 (because10) givesy2= (1/1)z1– (2/1)z2 + (u1–u2)/121z1 + 22z2 + v2,where21=1/1,22=2/1, and v2= (u1–u2)/1. Notethat the reduced form for y2generally depends on z1 and z2 (as well as on u1 and u2).(ii) If we multiply the second structural equation by (1/2) andsubtract it from the first structural equation, we obtainy 1 – (1/2)y 1 =1y 21y 2 +1z 1– (1/2)2z 2 +u 1 – (1/2)u 2=1z 1– (1/2)2z 2 + u 1 – (1/2)u 2or[1 – (1/2)]y 1 =1z 1 – (1/2)2z 2 + u 1 – (1/2)u 2.Because12, 1 – (1/2) 0, and so we can divide theequation by 1 – (1/2) to obtain the reduced form for y 1: y 1 =20XXXX z 1+20XXXXz 2 + v 1, where20XXXX=1/[1 – (1/2)],20XXXX=(1/2)2/[1 – (1/2)], and v 1 = [u 1 – (1/2)u 2]/[1 –(1/2)].A reduced form does exist for y 2, as can be seen by subtracting the second equation from the first:0 = (1–2)y 2 +1z 1 –2z 2 + u 1 – u 2;because12, we can rearrange and divide by12to obtainthe reduced form.(iii) In supply and demand examples,12is very reasonable. If the first equation is the supply function, we generally expect1> 0, and if the second equation is the demand function,2<0. The reduced forms can exist even in cases where the supply function is not upward sloping and the demand function is not downward sloping, but we might question the usefulness of such models.20XXXX.2Using simple economics, the first equation must be the demand function, as it depends on income, which is a common determinant of demand. The second equation contains a variable, rainfall, that affects crop production and therefore corn supply.20XXXX.3 No. In this example, we are interested in estimating the tradeoff between sleeping and working, controlling for some other factors. OLS is perfectly suited for this, provided we have been able to control for all other relevant factors. While it is true individuals are assumed to optimally allocate their time subject to constraints, this does not result in a system of simultaneous equations. If we wrote down such a system, there is no sense in which each equation could stand on its own; neither would have an interesting ceteris paribus interpretation. Besides, we could not estimate either equation because economic reasoning gives us no wayof excluding exogenous variables from either equation. See Example20XXXX.2 for a similar discussion.20XXXX.4 We can easily see that the rank condition for identifying the second equation does not hold: there are no exogenous variables appearing in the first equation that are not also in the secondequation. The first equation is identified provided30 (andwe would presume3< 0). This gives us an exogenous variable, log(price), that can be used as an IV for alcohol in estimating the first equation by 2SLS (which is just standard IV in this case). 20XXXX.5(i) Other things equal, a higher rate of condom usage shouldreduce the rate of sexually transmitted diseases (STDs). So1< 0.(ii) If students having sex behave rationally, and condom usage does prevent STDs, then condom usage should increase as the rate of infection increases.(iii) If we plug the structural equation for infrate into conuse=0+1infrate+ …, we see thatconuse depends on 1u1. Because1> 0, conuse is positively related to u1. In fact, if the structural error (u2) in the conuse equation is uncorrelated with u1,Cov(conuse ,u 1) =1Var(u 1) > 0. If we ignore the other explanatoryvariables in the infrate equation, we can use equation (5.4) to obtainthe direction of bias: 1ˆplim()β1> 0 because Cov(conuse ,u 1) >0, where 1ˆβ denotes the OLS estimator. Since we think 1< 0, OLSis biased towards zero. In other words, if we use OLS on the infrate equation, we are likely to underestimate the importance of condom use in reducing STDs. (Remember, the more negative is 1, the moreeffective is condom usage.)(iv) We would have to assume that condis does not appear, in addition to conuse , in the infrate equation. This seems reasonable, as it is usage that should directly affect STDs, and not just having a distribution program. But we must also assume condis is exogenous in the infrate : it cannot be correlated with unobserved factors (inu 1) that also affect infrate .We must also assume that condis has some partial effect on conuse , something that can be tested by estimating the reduced form for conuse . It seems likely that this requirement for an IV – see equations (20XXXX.30) and (20XXXX.31) – is satisfied.20XXXX.6 (i) It could be that the decision to unionize certain segments of workers is related to how a firm treats its employees.While the timing may not be contemporaneous, with the snapshot of a single cross section we might as well assume that it is.(ii) One possibility is to collect information on whether workers’ parents belonged to a union, and construct a variable that is the percentage of workers who had a parent in a union (say, perpar). This may be (partially) correlated with the percent of workers that belong to a union.(iii) We would have to assume that percpar is exogenous in the pension equation. We can test whether perunion is partially correlated with perpar by estimating the reduced form for perunion and doing a t test on perpar.20XXXX.7(i) Attendance at women’s basketball may grow in ways that are unrelated to factors that we can observe and control for. The taste for women’s basketball may increase over time, and this would be captured by the time trend.(ii) No. The university sets the price, and it may change price based on expectations of next year’s attendance; if the university uses factors that we cannot observe, these are necessarily in theerror term u t. So even though the supply is fixed, it does not mean that price is uncorrelated with the unobservables affecting demand.(iii) If people only care about how this year’s team is doing, SEASPERC t-1 can be excluded from the equation once WINPERC t has been controlled for. Of course, this is not a very good assumption for all games, as attendance early in the season is likely to be related to how the team did last year. We would also need to check that 1PRICE t is partially correlated with SEASPERC t-1by estimating the reduced form for 1PRICE t.(iv) It does make sense to include a measure of men’s basketball ticket prices, as attending a women’s basketball game is a substitute for attending a men’s game. The coefficient on 1MPRICE t would be expected to be positive: an increase in the pri ce of men’s tickets should increase the demand for women’s tickets. The winning percentage of the men’s team is another good candidate for an explanatory variable in the women’s demand equation.(v) It might be better to use first differences of the logs, which are then growth rates. We would then drop the observation for the first game in each season.(vi) If a game is sold out, we cannot observe true demand for that game. We only know that desired attendance is some number above capacity. If we just plug in capacity, we are understating the actual demand for tickets. (Chapter 20XXXX discusses censored regression methods that can be used in such cases.)20XXXX.8 We must first eliminate the unobserved effect, a i1. If we difference, we have1HPRICE it=t + 1lEXPEND it + 21POLICE it +31MEDINC itu it,+4PROPTAX it +for t= 2,3. The t here denotes different intercepts in the two years. The key assumption is that the change in the (log of) the state allocation, 1STATEALL it, is exogenous in this equation. Naturally, 1STATEALL it is (partially) correlated with 1EXPEND it because local expenditures depend at least partly on the state subsidy. The policy change in 20XXXX0XX4 means that there should be significant variation in 1STATEALL it, at least for the 20XXXX0XX4 to 20XXXX0XX6 change. Therefore, we can estimate this equation by pooled 2SLS, using1STATEALL it as an IV for 1EXPEND it; of course, this assumes theother explanatory variables in the equation are exogenous. (We could certainly question the exogeneity of the policy and property tax variables.) Without a policy change, 1STATEALL it would probably not vary sufficiently across i or t.SOLUTIONS TO COMPUTER EXERCISESC20XXXX.1 (i) Assuming the structural equation represents a causal relationship, 20XXXX0×1 is the approximate percentage change in income if a person smokes one more cigarette per day.(ii) Since consumption and price are, ceteris paribus, negativelyrelated, we expect5 0 (allowing for5) = 0. Similarly,everything else equal, restaurant smoking restrictions should reducecigarette smoking, so50.(iii) We need5 or6to be different from zero. That is, weneed at least one exogenous variable in the cigs equation that is not also in the log(income) equation.(iv) OLS estimation of the log(income) equation giveslog()income= 7.80 + .0020XXXX cigs+ .20XXXX0 educ + .20XXXX8 age.0020XXXX3 age2(0.20XXXX) (.0020XXXX) (.020XXXX)(.020XXXX) (.00020XXXX)n = 820XXXX, R2 = .20XXXX5.The coefficient on cigs implies that cigarette smoking causes income to increase, although the coefficient is not statistically different from zero. Remember, OLS ignores potential simultaneity between income and cigarette smoking.(v) The estimated reduced form for cigs iscigs= 1.58 .450 educ + .823 age .020XXXX0XX age2.351 log(cigpric)(23.70) (.20XXXX2) (.20XXXX4)(.0020XXXX) (5.766)2.74 restaurn(1.20XXXX)n = 820XXXX, R2 = .20XXXX1.While log(cigpric) is very insignificant, restaurn had the expected negative sign and a t statistic of about –2.47. (People living in states with restaurant smoking restrictions smoke almost three fewer cigarettes, on average, given education and age.) We could drop log(cigpric) from the analysis but we leave it in. (Incidentally, the F test for joint significance of log(cigpric) and restaurn yields p-value .20XXXX4.)(vi) Estimating the log(income) equation by 2SLS gives income= 7.78 .20XXXX2 cigs+ .20XXXX0 educ+ log().20XXXX4 age.0020XXXX0XX age2(0.23) (.20XXXX6) (.020XXXX)(.20XXXX3) (.0020XXXX7)n = 820XXXX.Now the coefficient on cigs is negative and almost significant at the 20XXXX% level against a two-sided alternative. The estimated effect is very large: each additional cigarette someone smokes lowers predicted income by about 4.2%. Of course, the 95% CI for cigs is very wide.(vii) Assuming that state level cigarette prices and restaurant smoking restrictions are exogenous in the income equation is problematical. Incomes are known to vary by region, as do restaurant smoking restrictions. It could be that in states where income is lower (after controlling for education and age), restaurant smoking restrictions are less likely to be in place.C20XXXX.2(i) We estimate a constant elasticity version of the labor supply equation (naturally, only for hours> 0), again by 2SLS. We getlog()hours = 8.37 + 1.20XXXX log(wage) .235 educ .020XXXX age(0.69) (0.56) (.20XXXX1)(.020XXXX).465 kidslt6.020XXXX nwifeinc(.220XXXX) (.020XXXX)n = 428,which implies a labor supply elasticity of 1.20XXXX. This is even higher than the 1.26 we obtained from equation (20XXXX.24) at the mean value of hours (20XXXX20XXXX).(ii) Now we estimate the equation by 2SLS but allow log(wage) and educ to both be endogenous. The full list of instrumental variables is age, kidslt6, nwifeinc, exper, exper2, motheduc, and fatheduc. The result ishours = 7.26 + 1.81 log(wage).20XXXX9 educ log().020XXXX age(1.20XXXX) (0.50) (.20XXXX7)(.020XXXX).543 kidslt6.020XXXX nwifeinc(.220XXXX) (.020XXXX)n = 428.The biggest effect is to reduce the size of the coefficient on educ as well as its statistical significance. The labor supply elasticity is only moderately smaller.ˆu, from the estimation (iii) After obtaining the 2SLS residuals,1in part (ii), we regress these on age, kidslt6, nwifeinc, exper, exper2, motheduc, and fatheduc. The n-R-squared statistic is420XXXX(.0020XXXX) = .428. We have two overidentifying restrictions, so the p-value is roughly P(2χ> .43) ≈ .81. There2is no evidence against the exogeneity of the IVs.C20XXXX.3 (i) The OLS estimates areinf = 25.23 .220XXXX open(4.20XXXX) (.20XXXX3)n = 20XXXX4, R2 = .20XXXX5.The IV estimates areinf = 29.61 .333 open(5.66) (.20XXXX0)n = 20XXXX4, R2 = .20XXXX2.The OLS coefficient is the same, to three decimal places, whenlog(pcinc) is included in the model. The IV estimate with log(pcinc) in the equation is .337, which is very close to .333. Therefore, dropping log(pcinc) makes little difference.(ii) Subject to the requirement that an IV be exogenous, we want an IV that is as highly correlated as possible with the endogenous explanatory variable. If we regress open on land we obtainR2= .20XXXX5. The simple regression of open on log(land) gives R2= .448. Therefore, log(land) is much more highly correlated with open. Further, if we regress open on log(land) and land we getopen= 20XXXX9.22 8.40 log(land) +.000020XXXX3 land(20XXXX.47) (0.20XXXX)(.000020XXXX1)n = 20XXXX4, R2 = .457.While log(land) is very significant, land is not, so we might as well use only log(land) as the IV for open.[Instructor’s Note: You might ask students whether it is better to use log(land) as the single IV for open or to use both land and land2. In fact, log(land) explains much more variation in open.] (iii) When we add oil to the original model, and assume oil is exogenous, the IV estimates areinf = 24.01 .337 open + .820XXXXlog(pcinc ) 6.56 oil(20XXXX.20XXXX) (.20XXXX4)(2.20XXXX)(9.80)n = 20XXXX4, R 2 = .20XXXX5.Being an oil producer is estimated to reduce average annual inflation by over 6.5 percentage points, but the effect is not statistically significant. This is not too surprising, as there are only seven oil producers in the sample.C20XXXX.4 (i) The usual form of the test assumes no serial correlation under H 0, and this appears to be the case. We also assume homoskedasticity. After estimating (20XXXX.35), we obtain the 2SLSresiduals, ˆt u. We then run the regression ˆt u on gc t -1, gy t -1, and r 3t -1. The n -R -squared statistic is 35(.20XXXX20XXXX) ≈ 2.20XXXX. With one df the (asymptotic) p -value is P(21χ > 2.20XXXX) ≈ .20XXXX3, and so the instruments pass the overidentification test at the 20XXXX% level.(ii) If we estimate (20XXXX.35) but with gc t -2, gy t -2, and r3t -2 as the IVs, we obtain, with n = 34,gc = .020XXXX4 + 1.220XXXX gy tt.0020XXXX3 r3t.(.20XXXX74) (1.272)(.0020XXXX0XX)The coefficient on gy t has doubled in size compared with equation (20XXXX.35), but it is not statistically significant. The coefficient on r3t is still small and statistically insignificant.(iii) If we regress gy t on gc t-2, gy t-2, and r3t-2 we obtaingy= .20XXXX1 .20XXXX0 gc t-2+t.20XXXX4 gy t-2+ .0020XXXX4 r3t-2(.020XXXX) (.469) (.330)(.0020XXXX6)n = 34, R2 = .020XXXX7.The F statistic for joint significance of all explanatory variables yields p-value .94, and so there is no correlation between gy t and the proposed IVs, gc t-2, gy t-2, and r3t-2. Therefore, we never should have done the IV estimation in part (ii) in the first place.[Instructor’s Note: There may be serial correlation in this regression, in which case the F statistic is not valid. But the point remains that gy t is not at all correlated with two lags of all variables.]C20XXXX.5 This is an open-ended question without a single answer. Even if we settle on extending the data through a particular year, we might want to change the disposable income and nondurable consumption numbers in earlier years, as these are often recalculated. For example, the value for real disposable personal income in20XXXX0XX5, as reported in Table B-29 of the 20XXXX Economic Report of the President(ERP), is $4,945.8 billions. In the 20XXXX ERP, this value has been changed to $4,920XXXX.0 billions (see Table B-31). All series can be updated using the latest edition of the ERP. The key is to use real values and make them per capita by dividing by population. Make sure that you use nondurable consumption.C20XXXX.6 (i) If we estimate the inverse supply function by OLS we obtain (with the coefficients on the monthly dummies suppressed)tgprc= .020XXXX4 .20XXXX43 gcem t+.20XXXX28 gprcpet t +(.020XXXX2) (.020XXXX1)(.020XXXX3)n = 220XXXX, R2 = .386.Several of the monthly dummy variables are very statistically significant, but their coefficients are not of direct interest here. The estimated supply curve slopes down, not up, and the coefficient on gcem t is very statistically significant (t statistic ≈ 4.87).(ii) We need gdefs t to have a nonzero coefficient in the reduced form for gcem t. More precisely, if we writegcem t = 0 + 1gdefs t + 2gprcpet t + 3feb t + + 20XXXX dec t + v t,then identification requires10. When we run this regression,1ˆπ= 1.20XXXX4 with a t statistic of about –0.294. Therefore,we cannot reject H0:1= 0 at any reasonable significance level,and we conclude that gdefs t is not a useful IV for gcem t(even if grdefs t is exogenous in the supply equation).(iii) Now the reduced form for gcem isgcem t =+1gres t +2gnon t +3gprcpet t +4feb t + +20XXXXdec t + v t ,and we need at least one of1and2to be different from zero. Infact, 1ˆπ = .20XXXX6, t (1ˆπ) = .20XXXX4 and 2ˆπ = 1.20XXXX, t (2ˆπ) =5.47. So gnon t is very significant in the reduced form for gcem t , and we can proceed with IV estimation.(iv) We use both gres t and gnon t as IVs for gcem t and apply 2SLS, even though the former is not significant in the RF. The estimated labor supply function (with seasonal dummy coefficients suppressed) is nowt gprc = .20XXXX28.020XXXX0XX gcem t +.20XXXX20XXXX gprcpet t +(.020XXXX3)(.20XXXX77)(.020XXXX7)n = 220XXXX, R 2 = .356.While the coefficient on gcem t is still negative, it is only about one-fourth the size of the OLS coefficient, and it is now very insignificant. At this point we would conclude that the static supply function is horizontal (with gprc on the vertical axis, asusual). Shea (20XXXX0XX3) adds many lags of gcem t and estimates a finite distributed lag model by IV, using leads as well as lags of gres t and gnon t as IVs. He estimates a positive long run propensity. C20XXXX.7 (i) If county administrators can predict when crime rates will increase, they may hire more police to counteract crime. This would explain the estimated positive relationship betweenlog(crmrte) and log(polpc) in equation (20XXXX.33).(ii) This may be reasonable, although tax collections depend in part on income and sales taxes, and revenues from these depend on the state of the economy, which can also influence crime rates.(iii) The reduced form for log(polpc it), for each i and t, is log(polpc it) = 0+ 1d83t+ 2d84t+ 3d85t+ 4d86t + 5d87tlog(prbarr it) + 7log(prbconv it) ++6log(prbpris it)8+log (avgsen it) + 20XXXX log(taxpc it) +9v it.We need0 for log(taxpc it) to be a reasonable IV candidate20XXXXfor log(polpc it). When we estimate this equation by pooled OLSˆ = .020XXXX2 with a t (N= 90, T= 6 for n= 540), we obtain10statistic of only .20XXXX0. Therefore, log(taxpc it) is not a good IV for log(polpc it).(iv) If the grants were awarded randomly, then the grant amounts, say grant it for the dollar amount for county i and year t, will be uncorrelated with u it, the changes in unobservables that affect county crime rates. By definition, grant it should be correlated with log(polpc it) across i and t. This means we have an exogenous variable that can be omitted from the crime equation and that is (partially) correlated with the endogenous explanatory variable. We could reestimate (20XXXX.33) by IV.C20XXXX.8(i) To estimate the demand equations, we need at least one exogenous variable that appears in the supply equation.(ii) For wave2t and wave3t to be valid IVs for log(avgprc t), we need two assumptions. The first is that these can be properly excluded from the demand equation. This may not be entirely reasonable, and wave heights are determined partly by weather, and demand at a local fish market could depend on demand. The second assumption is thatat least one of wave2t and wave3t appears in the supply equation. There is indirect evidence of this in part three, as the two variables are jointly significant in the reduced form for log(avgprc t).(iii) The OLS estimates of the reduced form areavgprc = 1.20XXXX .020XXXX mon t.020XXXX0 tues t log()t+ .20XXXX1 wed t+ .20XXXX4 thurs t(.20XXXX) (.20XXXX4) (.20XXXX20XXXX) (.20XXXX2) (.20XXXX1)+ .20XXXX4 wave2t + .20XXXX3 wave3t(.20XXXX1) (.20XXXX0)n = 20XXXX, R2 = .320XXXXThe variables wave2t and wave3t are jointly very significant: F = 20XXXX.1, p-value = zero to four decimal places.(iv) The 2SLS estimates of the demand function arelog()totqty = 8.20XXXX .820XXXX log(avgprc t)t.320XXXX mon t.685 tues t(.20XXXX) (.327) (.229) (.226).521 wed t + .20XXXX5 thurs t(.224)(.225)n = 20XXXX, R 2 = .20XXXX3The 95% confidence interval for the demand elasticity is roughly 1.47 to .20XXXX. The point estimate, .82, seems reasonable: a 20XXXX percent increase in price reduces quantity demanded by about 8.2%.(v) The coefficient on ,1ˆi t uis about .294 (se = .20XXXX0XX), so there is strong evidence of positive serial correlation, although the estimate of is not huge. One could compute a Newey-West standard error for 2SLS in place of the usual standard error.(vi) To estimate the supply elasticity, we would have to assume that the day-of-the-week dummies do not appear in the supply equation, but they do appear in the demand equation. Part (iii) provides evidence that there are day-of-the-week effects in the demand function. But we cannot know about the supply function.(vii) Unfortunately, in the estimation of the reduced form for log(avgprc t ) in part (iii), the variables mon , tues , wed , and thurs are jointly insignificant [F (4,90) = .53, p -value = .71.] This meansthat, while some of these dummies seem to show up in the demand equation, things cancel out in a way that they do not affect equilibrium price, once wave2 and wave3 are in the equation. So, without more information, we have no hope of estimating the supply equation.[Instructor’s Note: You could have the students try part (vii), anyway, to see what happens. Also, you could have them estimate the demand function by OLS, and compare the estimates with the 2SLS estimates in part (iv). You could also have them compute the test of the single overidentification condition.]C20XXXX.9 (i) The demand function should be downward sloping, so1 < 0: as price increases, quantity demanded for air travel decreases.(ii) The estimated price elasticity is .391 (t statistic = 5.82).(iii) We must assume that passenger demand depends only on air fare, so that, once price is controlled for, passengers are indifferent about the fraction of travel accounted for by the largest carrier.(iv) The reduced form equation for log(fare) islog()fare = 6.20XXXX + .395 concen.936 log(dist) + .20XXXX0XX [log(dist)]2(0.89) (.20XXXX3) (.272) (.20XXXX1)n = 1,20XXXX9, R2 = .420XXXXThe coefficient on concen shows a pretty strong link between concentration and fare. If concen increases by .20XXXX (20XXXX percentage points), fare is estimated to increase by almost 4%. The t statistic is about 6.3.(v) Using concen as an IV for log(fare) [and where the distance variables act as their own IVs], the estimated price elasticity is 1.20XXXX, which shows much greater price sensitivity than did the OLS estimate. The IV estimate suggests that a one percent increase in fare leads to a slightly more than one percent increase drop in passenger demand. Of course, the standard error of the IV estimate is much larger (about .389 compared with the OLS standard errorof .20XXXX7), but the IV estimate is statistically significant (t is about 3.0).(vi) The relationship between log(fare) and log(dist) has a U-shape, as given in the following graph:。
APPENDIX E
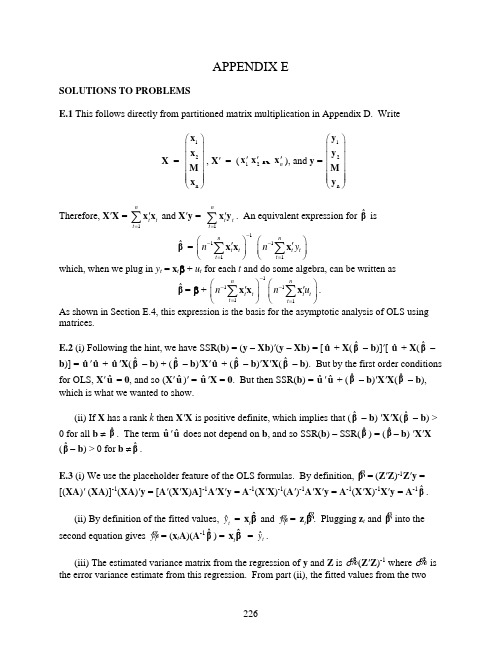
226APPENDIX ESOLUTIONS TO PROBLEMSE.1 This follows directly from partitioned matrix multiplication in Appendix D. WriteX = 12n ⎛⎫ ⎪ ⎪ ⎪ ⎪ ⎪⎝⎭x x x , X ' = (1'x 2'x n 'x ), and y = 12n ⎛⎫ ⎪ ⎪ ⎪ ⎪ ⎪⎝⎭y y yTherefore, X 'X = 1n t t t ='∑x x and X 'y = 1nt t t ='∑x y . An equivalent expression for ˆβ isˆβ = 111n t t t n --=⎛⎫' ⎪⎝⎭∑x x 11nt t t n y -=⎛⎫' ⎪⎝⎭∑xwhich, when we plug in y t = x t β + u t for each t and do some algebra, can be written asˆβ= β + 111n t t t n --=⎛⎫' ⎪⎝⎭∑x x 11nt t t n u -=⎛⎫' ⎪⎝⎭∑x .As shown in Section E.4, this expression is the basis for the asymptotic analysis of OLS using matrices.E.2 (i) Following the hint, we have SSR(b ) = (y – Xb )'(y – Xb ) = [ˆu+ X (ˆβ – b )]'[ ˆu + X (ˆβ – b )] = ˆu'ˆu + ˆu 'X (ˆβ – b ) + (ˆβ – b )'X 'ˆu + (ˆβ – b )'X 'X (ˆβ – b ). But by the first order conditions for OLS, X 'ˆu= 0, and so (X 'ˆu )' = ˆu 'X = 0. But then SSR(b ) = ˆu 'ˆu + (ˆβ – b )'X 'X (ˆβ – b ), which is what we wanted to show.(ii) If X has a rank k then X 'X is positive definite, which implies that (ˆβ– b ) 'X 'X (ˆβ – b ) > 0 for all b ≠ ˆβ. The term ˆu 'ˆu does not depend on b , and so SSR(b ) – SSR(ˆβ) = (ˆβ– b ) 'X 'X (ˆβ– b ) > 0 for b ≠ˆβ.E.3 (i) We use the placeholder feature of the OLS formulas. By definition, β= (Z 'Z )-1Z 'y = [(XA )' (XA )]-1(XA )'y = [A '(X 'X )A ]-1A 'X 'y = A -1(X 'X )-1(A ')-1A 'X 'y = A -1(X 'X )-1X 'y = A -1ˆβ.(ii) By definition of the fitted values, ˆt y= ˆt x β and t y = t z β . Plugging z t and β into the second equation gives ty= (x t A )(A -1ˆβ) = ˆt x β = ˆty .(iii) The estimated variance matrix from the regression of y and Z is 2σ(Z 'Z )-1 where 2σ is the error variance estimate from this regression. From part (ii), the fitted values from the two227regressions are the same, which means the residuals must be the same for all t . (The dependentvariable is the same in both regressions.) Therefore, 2σ= 2ˆσ. Further, as we showed in part (i), (Z 'Z )-1 = A -1(X 'X )-1(A ')-1, and so 2σ(Z 'Z )-1 = 2ˆσA -1(X 'X )-1(A -1)', which is what we wanted to show.(iv) The jβ are obtained from a regression of y on XA , where A is the k ⨯ k diagonal matrix with 1, a 2, , a k down the diagonal. From part (i), β= A -1ˆβ. But A -1 is easily seen to be the k ⨯ k diagonal matrix with 1, 12a -, , 1k a - down its diagonal. Straightforward multiplicationshows that the first element of A -1ˆβis 1ˆβ and the j th element is ˆjβ/a j , j = 2, , k .(v) From part (iii), the estimated variance matrix of βis 2ˆσA -1(X 'X )-1(A -1)'. But A -1 is a symmetric, diagonal matrix, as described above. The estimated variance of jβis the j th diagonal element of 2ˆσA -1(X 'X )-1A -1, which is easily seen to be = 2ˆσc jj /2j a -, where c jj is the j thdiagonal element of (X 'X )-1. The square root of this, σa j |, is se(jβ ), which is simply se(jβ )/|a j |.(vi) The t statistic for jβ is, as usual,j β /se(j β ) = (ˆj β/a j )/[se(ˆjβ)/|a j |], and so the absolute value is (|ˆj β|/|a j |)/[se(ˆj β)/|a j |] = |ˆj β|/se(ˆjβ), which is just the absolute value of the t statistic for ˆjβ. If a j > 0, the t statistics themselves are identical; if a j < 0, the t statistics are simply opposite in sign.E.4 (i) 垐 E(|)E(|)E(|).====δX GβX G βX Gβδ(ii) 2121垐 Var(|)Var(|)[Var(|)][()][()].σσ--'''''====δX GβX G βX G G X X G G X X G(iii) The vector of regression coefficients from the regression y on XG -1 is111111111111[()]()[()]() ()[()]()ˆ ()()().------------''''''='''''=''''''''===XG XG XG y G X XG G X y G X X G G X yG X X G G X y G X X X y δFurther, as shown in Problem E.3, the residuals are the same as from the regression y on X , andso the error variance estimate, 2ˆ,σis the same. Therefore, the estimated variance matrix is228211121垐[()](),σσ----'''=XG XG G X X Gwhich is the proper estimate of the expression in part (ii).(iv) It is easily seen by matrix multiplication that choosing123100...0010...0...0...010...k c c c c ⋅⋅⋅⋅⋅⋅⋅⋅⎛⎫ ⎪ ⎪ ⎪=⋅⋅⋅⋅ ⎪ ⎪ ⎪ ⎪⎝⎭Gdoes the trick: if δ = G β then δj = βj , j = 1,…,k -1, and 1122....k k k c c c δβββ=+++(v) Straightforward matrix multiplication shows that, for the suggested choice of G -1, 1.n -=G G I Also by multiplication, it is easy to see that, for each t ,11122,11[(/),(/),...,(/),/].t t k tk t k tk t k k k tk tk k x c c x x c c x x c c x x c ---=---x GE.5 (i) By plugging in for y , we can write111()()()().---''''''==+=+βZ X Z y Z X Z Xβu βZ X Z uNow we use the fact that Z is a function of X to pull Z outside of the conditional expectation:11E(|)E[()|]()E(|).--''''=+=+=βX βZ X Z u X βZ X Z u X β(ii) We start from the same representation in part (i): 1()-''=+ββZ X Z u and so11121211Var(|)()[Var(|)][()] ()()()()().n σσ------''''=''''''==βX Z X Z u X Z Z X Z X Z I Z X Z Z X Z Z X ZA common mistake is to forget to transpose the matrix 'Z X in the last term.(iii) The estimator βis linear in y and, as shown in part (i), it is unbiased (conditional on X ). Because the Gauss-Markov assumptions hold, the OLS estimator, ˆβ, is best linear unbiased. In particular, its variance-covariance matrix is “smaller” (in the matrix sense) than Var(|).βX Therefore, we prefer the OLS estimator.。
- 1、下载文档前请自行甄别文档内容的完整性,平台不提供额外的编辑、内容补充、找答案等附加服务。
- 2、"仅部分预览"的文档,不可在线预览部分如存在完整性等问题,可反馈申请退款(可完整预览的文档不适用该条件!)。
- 3、如文档侵犯您的权益,请联系客服反馈,我们会尽快为您处理(人工客服工作时间:9:00-18:30)。
Introductory Econometrics
4
Motivation : Advantage
It can explain more of the variation in the dependent variable.
It can incorporate more general functional form.
If other factors that affecting y are not correlated with x, changing x can ensure that u is not changed, and the effect of x on y can be identified.
Multiple regression analysis is more amenable to ceteris paribus analysis because it allows us to explicitly control for many other factors that simultaneously affect the dependent variable.
6
Motivation: An Example
Consider a model that says family
consumption is a quadratic function of family income:
Cons = b0 + b1 inc+b2 inc2 +u
Now the marginal propensity to consume is approximated by
pcolGPA: predicted values of college grade point average
pcolGPA:大学绩点预测值
hsGPA : high school GPA hsGPA : 高中绩点
ACT : achievement test score ACT :成绩测验分数
pcolGPA = 1.29 + 0.453hsGPA+0.0094ACT
yˆ bˆ1x1, that is each b has
a ceteris paribus interpretation
Introductory Econometrics
10
Example 3.4: Determinants of College
GPA (GPA1.dta)
Two-independent-variable regression
The multiple regression model is the most widely used vehicle for empirical analysis.
Introductory Econometrics
5
Motivation: An Example
Consider a simple version of the wage equation for obtaining the effect of education on hourly wage:
Introductory Econometrics
9
Interpreting Multiple Regression
yˆ bˆ0 bˆ1x1 bˆ2 x2 ... bˆk xk , so yˆ bˆ1x1 bˆ2 x2 ... bˆk xk ,
so holding x2,...,xk fixed implies that
exper: years of labor market experience
wage b0 b1educ b2exper u
In this example experience is explicitly taken out of the error term.
Introductory Econometrics
the residuals from the estimated
regression xˆ1 ˆ0 ˆ2 xˆ2
Introductory Econometrics
17
A “Partialling Out” Interpretation
Regress our first independent variable x1 on our second independent variable x2 ,
13
Example: Determinants of College GPA
One-independent-variable regression
pcolGPA = 2.4 +0.0271ACT
The coefficients on ACT is three times larger.
If these two regressions were both true, they can be considered as the results of two different experiments.
Introductory Econometrics
16
A “Partialling Out” Interpretation
Consider the case where k 2, i.e.
yˆ bˆ0 bˆ1x1 bˆ2 x2 , then
bˆ1 rˆ1i yi
rˆ12i , where rˆ1i are
MPC= b1 +2b2 inc
Introductory Econometrics
7
The Model with k Independent Variables
The general multiple linear regression model can be written as
yi b0 b1x1i b2 x2i bk xki ui
and then obtain the residual r1 .
Then, do to obtain
a simple bˆ1 .
regression
of
y
on
r1
Introductory Econometrics
18
“Partialling Out” continued
Previous equation implies that regressing y
Still need to make a zero conditional mean assumption, so now assume that
E(u|x1,x2, …,xk) = 0 Still minimizing the sum of squared residuals, so have k+1 first order conditions
Introductory Econometrics
8
Parallels with Simple Regression
b0 is still the intercept b1 to bk all called slope parameters
u is still the error term (or disturbance)
on x1 and x2 gives same effect of x1 as regressing y on residuals from a regression
of x1 on x2
This means only the part of x1 that is uncorrelated with x2 are being related to y so we’re estimating the effect of x1 on y after x2 has been “partialled out”
Introductory Econometrics
14
Holdier of multiple regression analysis is that it allows us to do in non-experimental environments what natural scientists are able to do in a controlled laboratory setting: keep other factors fixed.
Whether the ceteris paribus effects are reliable or not depends on whether the conditional mean assumption is realistic.
Introductory Econometrics
2
Motivation: Advantage
x1 and x2 are uncorrelated in the sample
Introductory Econometrics
20
“Partialling Out” continued
In the general model with k explanatory
variables, equation
bbˆˆ11cann
still
rˆ1i
yi
be written as in n rˆ1i2 , but the
rxe1soidnuxa2l…r1
3. Multiple Regression
Analysis: Estimation
yi = b0 + b1x1i + b2x2i + . . . bkxki + ui
Introductory Econometrics
1
Motivation: Advantage