Du Pont Analysis
杜邦财务分析法及案例分析(DuPontfinancialanalysisandcasestudy)
杜邦财务分析法及案例分析(DuPont financial analysis and casestudy)Business University network, DuPont analysis, profitability, financial positionProfitability is an important financial index of the enterprise, to the owners, creditors, investors and government, analysis and evaluation of the profitability of the enterprise is crucial to the decision-making, financial profitability analysis and financial management of enterprises of the important part of.The ratio of profitability evaluation of the traditional enterprise mainly has: the rate of return on assets, profit margin (or net profit rate), return on equity; earnings of joint-stock enterprises and share profit rate, dividend rate, dividend return rate etc.. These individual indicators are used to measure different factors that influence and determine the profitability of an enterprise, including sales performance, asset management levels, cost control levels, etc..These indicators analyze the financial status and operating results of a company from a specific point of view, and they are not sufficient to evaluate the overall financial position and operating results of an enterprise in a comprehensive manner. In order to compensate for this deficiency, there must be a method, which can analyze interrelated, relevant indicators and statements together, using appropriate standards for comprehensive analysis and evaluation, which fully embodies the enterprise overall financial situation, andpointed out the relationship between indicators and indicators and indicators and reports. A DuPont analysis is one of the.DuPont financial analysis system (TheDuPontSystem) is a more practical financial ratio analysis system. This method of analysis was first created by the manager of the DuPont Co in the United States, so it is called DuPont financial analysis system. The method of financial analysis from the enterprise performance evaluation is the most comprehensive and representative index - net interest rates of use to decompose the basic factors of production, and enterprise cost and expense risk, so as to satisfy the need for performance evaluation through financial analysis, business objectives change operator can timely find out the reasons and correction, and provide the basis for investors, creditors and government evaluation of enterprises.A DuPont, DuPont analysis method and analysis of the characteristics of the DuPont model diagram is the most significant number for ratio evaluation of the operational efficiency and financial status of enterprises according to their internal links organically, form a complete index system, and finally through the return on equity to reflect. By this method, the level of financial ratio analysis can be clearer and more coherent, which will provide convenience for the analysts to understand the operation and profitability of enterprises comprehensively and carefully.DuPont analysis helps enterprise management more clearly see the determinants of equity capital gains rate, relationship and sales net profit rate and total asset turnover rate, debt ratio,provides a clear roadmap for the company asset management efficiency and the maximization of shareholder returns to management.DuPont analysis uses the internal relationship between the major financial ratios, establishes a comprehensive model of financial ratio analysis, and comprehensively analyzes and evaluates the financial status and operating performance of enterprises. DuPont analysis chart is used to arrange the relevant indexes according to internal relations, so as to directly reflect the overall situation of the enterprise's financial status and management results.The DuPont financial analysis system is shown in the figure:Figure 1 DuPont analysis chartTwo. Analysis of DuPont drawings1. the relationship between the financial indicators in the figure:It can be seen that DuPont analysis actually analyzes the finance from two angles. One is the internal management factor analysis, the other is the capital structure and risk analysis of the two.Net interest rate = net interest rate of assets * equity multiplierEquity multiplier (1 = 1, asset liability ratio)Net asset interest = net selling rate * total asset turnoverNet profit = sales revenue / net salesThe total asset turnover = sales / total assetsAsset liability ratio = Total Liabilities / total assets2. DuPont analysis chart provides information about the following major financial indicators:(1) net interest rate is the most comprehensive financial ratio. It is the core of Du Pont analysis system. It reflects the profitability of the owner's capital and reflects the efficiency of the enterprise's financing, investment, asset operation and so on. It depends on the level of the total assets profit margin and the equity capital ratio. There are three factors that determine the net interest rate of equity, equity multiplier, net selling interest rate and total assets turnover. The three ratios of equity multiplier, net interest rate and total asset turnover reflect the debt ratio, profitability ratio and asset management ratio of an enterprise respectively.(2) the equity multiplier is mainly affected by the asset liability ratio. The greater the debt ratio, the higher the equity multiplier, indicating that the enterprise has a higher degree of debt, and bring more leverage benefits to the enterprise,At the same time, it also brings more risks to the enterprise.The net asset interest rate is a comprehensive index, which is affected by both the net selling interest rate and the asset turnover.(3) the net interest rate of assets is also an important financial ratio, and the comprehensive rate is also stronger. It is the product of the net interest rate and the total asset turnover, so it should be further analyzed from two aspects: sales results and asset operation.The net sales rate reflects the relationship between the total profit and the sales revenue. In this sense, raising the net sales rate is the key to improving the profitability of the enterprise. To improve the net sales rate: first, to expand sales revenue; two is to reduce costs. To reduce costs and expenses is an important part of enterprise financial management. Through the list of costs and expenses, it is beneficial for enterprises to analyze the structure of cost and expense, and to strengthen cost control, so as to provide the basis for seeking ways to reduce cost.The operation ability of enterprise assets is not only related to the profitability of an enterprise, but also to the solvency of an enterprise. Generally speaking, the liquid assets directly reflect the solvency and liquidity of the enterprise, and the non current assets reflect the scale and potential of the enterprise. Between the two should be a reasonable structure ratio, if the enterprise's cash holdings more than business needs, it may affect the profitability of enterprises; if enterprises occupy excessive inventory and accounts receivable, it should affect the profitability, solvency andinfluence. To this end, we should further analyze the amount of assets and turnover speed. The current assets should focus on whether the stock backlog phenomenon, monetary funds, accounts receivable are idle in the analysis of customer payment ability and have no bad debts; on the non current focuses on the analysis of the fixed assets of enterprises is full use of assets.Three, DuPont analysis is used as an example to analyze DuPont's financial analysis method, which can explain the reasons for the change of indicators and the trend of changes, and show the direction for taking measures. Below, take a listed company Beiqi Foton automobile (600166) as an example to illustrate the use of DuPont analysis.The basic financial data of Foton Motor are as follows:Table twoDuPont analysis chart(I) analysis of net interest rates;The net interest rate index of equity is a measure of the ability of an enterprise to make use of its assets to obtain profits. The net interest rate of equity takes full account of the influence of the mode of financing on the profitability of the enterprise, so the profitability reflected by it is the result of the combination of various factors, such as business capability, financial decision-making and financing methods.The company's net interest rates have improved to some extent during the period from 2001 to 2002, respectively, from the 0.112. enterprises increased from 0.097 in 2001 to 2002 the investors to a large extent on the basis of this index to judge whether the investment or whether the transfer of shares, study of operator performance and dividend policy decision. These indicators are also important to the company's managers.Corporate managers conduct financial analysis to improve their financial decisions. They can split net interest rates into equity multipliers and net interest rates to find the causes of the problem.Table three: equity interest rate analysis sheetFoton equity net interest = equity multiplier * equity net interest rateThrough the decomposition, we can see clearly that the change of the net interest rate of the company's equity lies in the interaction of two aspects, the changes of the capital structure (equity multiplier) and the effect of the asset utilization (the net interest rate of assets). The company's net asset interest rate is too low, showing a poor asset utilization.(two) decomposition analysis process:Net interest rate = net interest rate of assets * equity multiplierThe decomposition shows that the change in net interest rate is due to changes in capital structure (declining equity multiplier), while changes in asset utilization and cost control (net asset interest rates have also changed). So, we continue to decompose the net interest rate of assets:Net asset interest = net selling rate * total asset turnoverThe decomposition can be seen in 2002 the total assets turnover rate has increased, the use of assets that better control is obtained, shows better effect than the previous year, show that the company's use of its total assets generated sales revenue increase in efficiency. As the total assets turnover improved, the decrease in net selling interest rates prevented the increase in the net asset interest rate, and we then decomposed the net sales interest rate:Net profit = sales revenue / net salesIn 2002 the company greatly increased sales revenue, but net profit increase is very small, the reason is the increase in cost, from a table that all costs increased from 4 billion 39 million 674 thousand and 300 yuan in 2001 to 7 billion 367 million 472 thousand and 400 yuan in 2002, with sales revenue increase of roughly the same magnitude. The following is a breakdown of all costs:All costs = manufacturing costs + sales expenses + management fees + financial expensesIn 2002 736747.24 = 684559.9121740.96225718.205026.17 can beseen through the decomposition of DuPont analysis effectively explains the cause and trend of change in target, to take measures to deal with the direction.In this case, the main reason for the small profit margin is that the total cost is too large. It is also because the full cost increase led to a net profit increase is limited, and greatly increase sales, caused a decrease in sales net interest rate, shown to reduce the profitability of the company's sales. The improvement of the net asset interest rate, the improvement of the total assets turnover rate and the decrease of the net selling interest rate, have played an important role in hindering the improvement of the net assets interest rate.As seen in Table 4, the decline in the rights and interests of Foton motors shows that their capital structure has changed between 2001 and 2002, and the equity multiplier in 2002 was somewhat smaller than in 2001. The smaller the equity multiplier, the lower the debt level of the enterprise, the stronger the ability to repay the debt, the lower the financial risk. The index also reflects the impact of leverage on profit levels. Financial leverage has two positive and negative functions. In a well paid year, it can increase the potential return of shareholders, but shareholders should bear the risk of increased liabilities; in the bad year, the potential return of shareholders may be reduced. The company's equity multiplier has been between 2~5, that is, the debt ratio of 50% to 80%, belonging to the radical strategic enterprises. Managers should accurately understand the company's environment, accurately predict profits, and reasonably control the risks associated with liabilities.Therefore, for Fukuda automobile, the most important thing is to make efforts to reduce costs and control costs. At the same time, maintain a high total asset turnover. In this way, the sales margin can be improved and the net interest rate of assets will be greatly improved.Four, conclusion, DuPont analysis to net interest rates as the main line, the enterprise in a certain period of time the sales achievement and asset operational condition comprehensive together, the layers of decomposition, step by step, constitute a complete analysis system. It can help managers find financial and management problems, can provide valuable information for improving enterprise management, which is widely recognized and widely used in practical work.DuPont analysis, however, is one of the methods of financial analysis. As a comprehensive analysis method, it does not exclude other methods of financial analysis. On the contrary, combined with other analysis methods, not only can make up for their shortcomings and shortcomings, but also make up for shortcomings of other methods, which makes the analysis results more complete and more scientific. For example, DuPont analysis as the foundation, combined with the special analysis, some problems related to the subsequent analysis for further more detailed analysis to understand; can also be combined with the method of comparative analysis and trend analysis method, the different period of DuPont analysis by comparing the results of trend analysis, thus the dynamic formation, identify financial changes, provide the basis for the prediction of or, decision-making; some enterprises and financial risk analysismethods, the necessary risk analysis, also provides the basis for managers, so this combination is also the need of the development of DuPont analysis. The analyst should pay attention to this when applying.。
杜邦分析体系研究
杜邦分析体系研究作者:杨阳来源:《中国集体经济》2016年第33期摘要:杜邦分析体系是美国杜邦公司研发的,用来系统地分析财务指标内在联系的综合性的财务分析方法。
杜邦分析体系以股东权益报酬率为核心,通过企业在某一时期的资本结构、成本水平、销售规模、资产管理等财务指标相结合,逐层深入分解,进而形成一个完整的分析体系。
文章首先介绍了杜邦分析体系的原理、系统图和主要财务指标,其次指出了传统杜邦分析体系在财务分析中的局限性,没有考虑到企业的可持续发展能力,以及忽视了现金流量这一重要指标对于企业财务状况的影响。
因而进一步提出帕利普财务分析和引入现金流量的杜邦体系对原有的杜邦分析体系进行改进。
关键词:杜邦分析体系;股东权益报酬率;可持续增长率;现金流一、研究背景及意义(一)研究背景随着全球经济一体化格局的不断演变,市场的扩张和发展,企业面临着更加激烈的竞争。
因此,上市公司需要从管理模式的创新,提高企业核心竞争力,保持良好的性能,提高公司信用,降低融资成本,提高投资者的信心,从而在竞争中获得优势。
然而,在现实中,一些上市公司盈利不佳时,会选择粉饰报表,操纵会计利润获得短期利润来蒙蔽投资者。
这些行为不仅不能发现企业的问题从而改正,甚至使企业的问题在遮掩下恶化,从而将企业推下破产的深渊。
上市公司只顾及短期利益的行为,妨碍了利益相关主体对公司经营业绩的评价,因而客观评价上市公司的经营业绩就显得非常重要。
上市公司经营绩效的评价是财务分析的主要方法,通过杜邦分析可以评价公司盈利能力和股东权益回报水平的高低,从财务角度评价企业绩效。
杜邦分析法的核心是通过分解股东权益报酬率,形成多个财务比率相乘的形式,再通过分析这些财务比率,来研究企业的经营状况、盈利能力。
(二)研究意义研究杜邦系统将有助于外部利益相关者确定公司的财务状况,经营成果,提供投资决策行为的理性分析。
其次,杜邦分析对于外部利益相关主体地监督公司运营提供了科学的技术支撑,从而可以创造良好的外部监督环境。
杜邦分析
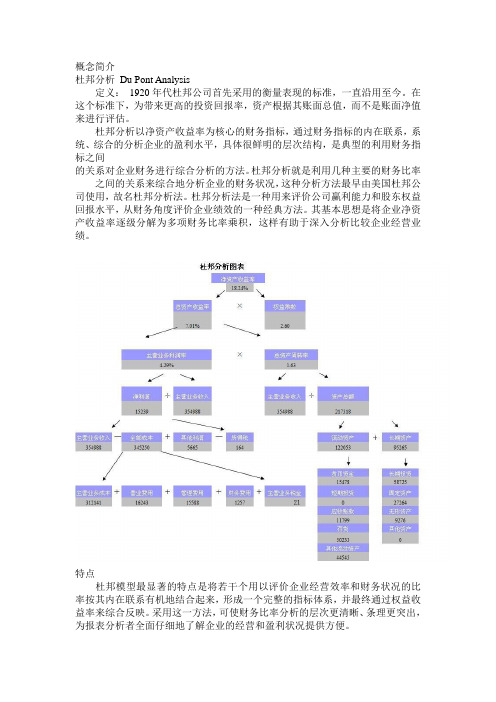
概念简介杜邦分析Du Pont Analysis定义:1920年代杜邦公司首先采用的衡量表现的标准,一直沿用至今。
在这个标准下,为带来更高的投资回报率,资产根据其账面总值,而不是账面净值来进行评估。
杜邦分析以净资产收益率为核心的财务指标,通过财务指标的内在联系,系统、综合的分析企业的盈利水平,具体很鲜明的层次结构,是典型的利用财务指标之间的关系对企业财务进行综合分析的方法。
杜邦分析就是利用几种主要的财务比率之间的关系来综合地分析企业的财务状况,这种分析方法最早由美国杜邦公司使用,故名杜邦分析法。
杜邦分析法是一种用来评价公司赢利能力和股东权益回报水平,从财务角度评价企业绩效的一种经典方法。
其基本思想是将企业净资产收益率逐级分解为多项财务比率乘积,这样有助于深入分析比较企业经营业绩。
特点杜邦模型最显著的特点是将若干个用以评价企业经营效率和财务状况的比率按其内在联系有机地结合起来,形成一个完整的指标体系,并最终通过权益收益率来综合反映。
采用这一方法,可使财务比率分析的层次更清晰、条理更突出,为报表分析者全面仔细地了解企业的经营和盈利状况提供方便。
杜邦分析法有助于企业管理层更加清晰地看到权益资本收益率的决定因素,以及销售净利润率与总资产周转率、债务比率之间的相互关联关系,给管理层提供了一张明晰的考察公司资产管理效率和是否最大化股东投资回报的路线图。
基本思路1、权益净利率是一个综合性最强的财务分析指标,是杜邦分析系统的核心。
2、资产净利率是影响权益净利率的最重要的指标,具有很强的综合性,而资产净利率又取决于销售净利率和总资产周转率的高低。
总资产周转率是反映总资产的周转速度。
对资产周转率的分析,需要对影响资产周转的各因素进行分析,以判明影响公司资产周转的主要问题在哪里。
销售净利率反映销售收入的收益水平。
扩大销售收入,降低成本费用是提高企业销售利润率的根本途径,而扩大销售,同时也是提高资产周转率的必要条件和途径。
财务分析方法——杜邦分析法 ppt课件

杜邦分析法
1、杜邦分析图表介绍 2、杜邦分析中几个财务指标解释 3、案例分析
杜邦分析法
权益利润率:是综合性最强的财务比率,是整个 杜邦系统的核心指标。它反映了公司所有者投入 资本及相关权益的获利水平,是所有者得以保障 的基本前提。 该项指标的大小不仅受公司盈利能力的影响,而 且还受公司资产的周转营运能力及资本结构状况 的影响。
财务分析方法——杜邦分析法
价值树中的杜邦分析 及同财务报表的关系
财务报表
损益表
K PI树
投资回报率
税 前 净 利 /收 入
税前利润率 (利润)
×
收入
收入
130000
成本
120000
-
毛利
10000
毛利
-
毛利率 费用 费用率
7.7% 4800 3.7%
费用
坏帐准备金
140
-
削价准备金
100
税前净利
资产:
期初
现金
3000
应收
11500
存货
16500
资产合计:
31000
负债:
内部贷款
13500
应付
17500
所有者权益:
未分配利润
0
股本
0
负债和所有
者 权 益 合 计 : 31000
期末 3010 14500 19500
37010
13550 18500
4960 0
37010
损益表 Incom e Statem ent
销售收入 / 资产总额
销售收入 - 总成本 + 其他利润 - 所得税
长期资产 + 流动资产
销售成本+管理费用+财务费用+销售费用
杜邦财务分析体系之分析
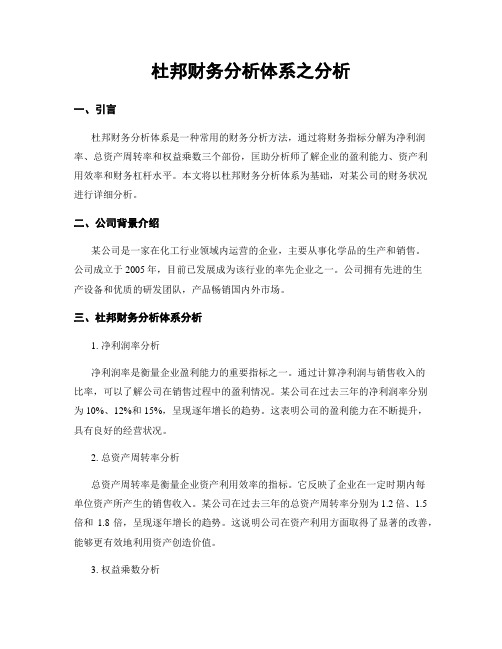
杜邦财务分析体系之分析一、引言杜邦财务分析体系是一种常用的财务分析方法,通过将财务指标分解为净利润率、总资产周转率和权益乘数三个部份,匡助分析师了解企业的盈利能力、资产利用效率和财务杠杆水平。
本文将以杜邦财务分析体系为基础,对某公司的财务状况进行详细分析。
二、公司背景介绍某公司是一家在化工行业领域内运营的企业,主要从事化学品的生产和销售。
公司成立于2005年,目前已发展成为该行业的率先企业之一。
公司拥有先进的生产设备和优质的研发团队,产品畅销国内外市场。
三、杜邦财务分析体系分析1. 净利润率分析净利润率是衡量企业盈利能力的重要指标之一。
通过计算净利润与销售收入的比率,可以了解公司在销售过程中的盈利情况。
某公司在过去三年的净利润率分别为10%、12%和15%,呈现逐年增长的趋势。
这表明公司的盈利能力在不断提升,具有良好的经营状况。
2. 总资产周转率分析总资产周转率是衡量企业资产利用效率的指标。
它反映了企业在一定时期内每单位资产所产生的销售收入。
某公司在过去三年的总资产周转率分别为1.2倍、1.5倍和1.8倍,呈现逐年增长的趋势。
这说明公司在资产利用方面取得了显著的改善,能够更有效地利用资产创造价值。
3. 权益乘数分析权益乘数是衡量企业财务杠杆水平的指标。
它反映了企业通过借入资金来扩大业务规模的程度。
某公司在过去三年的权益乘数分别为1.5倍、1.8倍和2.0倍,呈现逐年增长的趋势。
这说明公司在融资方面的能力不断增强,能够更灵便地运用资金来支持业务发展。
四、财务分析结论综合以上分析结果,可以得出以下结论:1. 某公司的盈利能力逐年增强,表明公司的经营状况良好。
2. 公司的资产利用效率逐年提高,说明公司能够更有效地利用资产创造价值。
3. 公司的财务杠杆水平逐年增加,表明公司在融资方面的能力不断增强。
基于以上结论,可以认为某公司在财务方面表现出色,具有良好的发展潜力。
然而,需要注意的是,财务分析只是对公司财务状况的一种评估方法,还需要结合其他因素进行综合分析,才干全面了解公司的实际情况。
杜邦分析体系在美团点评中的财务分析应用研究

随着市场经济的快速发展,伴随着互联网科技的高速进行,人们的生活节奏也相应地越来愈快,外卖也逐渐进入大众视野以至于到了现在的普遍化,被大家所认可的外卖软件有饿了么,美团,百度,其中美团凭借其自身的优势成为外卖软件中的佼佼者,并且美团公司在2018年正式上市,成为一家上市公司,并且持续地为经济发展做出贡献,为了能使年轻的公司更加持续的发展并且更好的创造价值,就需要合理有效的方法来进行管理。
杜邦财务分析实际上是一种综合分析方法,它综合了各种财务比率。
该方法利用权益的股本净利率因子来评价企业最全面、最具代表性的经营业绩的起点与终点,在此基础上,把它划分成诸多财务指标。
本人先阐述了该方法的定义以及框架,然后以美团点评公司为研究对象,介绍了该方法在财务管理中的应用,最后提出科学有效的改进措施。
关键词:杜邦分析法;销售净利率;总资产周转率;权益乘数;美团点评AbstractWith the rapid development of market economy, with the high speed of Internet technology, the faster the pace of the life of people is correspondingly more, take-away also gradually entered the wider public that the generalization of today, and is recognized by everybody take-out software to have hungry Meituan, baidu, including Meituan relies on its own advantages become the delivery of software, and Meituan company officially listed in 2018, to become a listed company, and continue to contribute to economic development, in order to make the company more sustainable development of the young and better to create value, will need to be reasonable and effective approach to management.DuPont financial analysis is actually a comprehensive analytical method, which integrates various financial ratios. In this method, the equity net interest rate factor is used to evaluate the starting point and the end point of the most comprehensive and representative business performance of an enterprise. On this basis, it is divided into many financial indexes. This paper first expounds the definition and framework of this method, then takes Meituan Dianping Company as the research object, introduces the application of this method in financial management, and finally puts forward scientific and effective strategies and measures.Key words:du pont analysis;Net selling interest rate; turnover of total capital; equity multiplier;Meituan Dianping一.杜邦分析法概述 (3)(一)杜邦分析法概念 (3)(二)杜邦分析图 (3)(三)杜邦分析法指标的剖判 (4)1.净资产利润率(权益报酬率) (4)2.总资产报酬率 (4)3.权益乘数 (4)4. 销售净利率 (4)5. .总资产周转率 (5)二.杜邦分析法在美团点评的应用 (5)(一)美团点评的基本概况 (5)(二)美团点评的财务状况 (5)(三)杜邦分析法指标详细理解 (6)1.净资产利润率 (6)2.总资产报酬率 (7)3.权益乘数 (8)4.销售净利率 (8)5.总资产周转率 (9)三.上市公司应改进的措施 (10)(一)加强成本费用管理,促进盈利能力 (10)(二)降低负债比率,减少财务风险 (11)(三)提高公司资产利用率,实现持续经营 (11)1.营造精良的企业外部氛围 (11)2.营造必备的企业内部环境 (11)3.加强企业结构调整,优化企业资本结构 (12)四.结论 (12)参考文献 (13)附录 (14)杜邦分析体系在美团点评中的财务分析应用研究杜邦分析体系是运用相应的营运能力指标之间的实际联系的公司的经济情况统筹说明的举措。
杜邦分析方法简述
杜邦分析方法简述摘要:杜邦分析方法是当前企业管理者为了深入考察企业经营情况而广泛使用的分析方法之一,为了让读者更深入了解这种方法的基本架构,现以东晶电子为例对杜邦分析方法进行简述。
关键词:杜邦分析东晶电子杜邦分析(du pont analysis)是1920年代杜邦公司首先采用的衡量表现的标准并一直沿用至今,它是利用财务指标之间的内在联系,通过不断延伸形成严密的层次结构来对企业的盈利水平进行剖析的方法。
杜邦模型最显著的特点是将若干个用以评价企业经营效率和财务状况的比率按其内在联系有机地结合起来,形成一个完整的指标体系,并最终通过权益收益率来综合反映。
浙江东晶电子股份有限公司是中国的元件百强企业之一,为了让读者更为了解这种方法的运用,现已浙江东晶电子有限公司2008-2010年的财务数据为例来进行杜邦分析方法的简述,并对该公司的未来经营提供一定的建议。
杜邦分析是以净资产收益率为起点将财务指标进行层层分解,从而了解到影响企业盈利能力和营运水平的主要因素。
首先,2008年东晶电子的主要财务指标分别是:净资产收益率为9.04%,其中,资产净利率是5.34%,权益乘数是1.69(净资产收益率=资产净利率*权益乘数)。
在资产净利率一方向下分解,销售净利率为11.10%,总资产周转率为0.48(资产净利率=销售净利率*总资产周转率);而在权益乘数一方,总资产总共为40,192万元,股东权益总共23,727万元(权益乘数=总资产*股东权益)。
我们进一步将销售净利率分解(销售净利率=净利润*营业收入),净利润共为2,146万元,营业收入为19,328万元。
而将总资产周转率进一部分解(总资产周转率=营业收入*总资产),营业收入为19,328万元,总资产总共为40,192万元。
在总资产当中,固定资产占据较大比例,共13,424万元,而货币资金共8,911万元。
现就利用2009年和2010年的财务指标进行杜邦分析。
(注:此处的”净资产收益率”数值之所以与上面的数值有出入,是因为计算时,其利用的是当年的净资产来计算,而前面进行财务分析时所取的是期初与期末的平均值。
基于杜邦分析法的财务分析 —以双汇公司为例
关键词:杜邦分析法 净资产收益率 总资产周转率 权益乘数
Abstract Nowadays, with the continuous changes and development of market economy, financial analysis has been paid more and more attention by enterprise managers and is playing an increasingly important role in enterprises. Nowadays, enterprises use DuPont analysis method to conduct financial analysis, which obviously improves efficiency. This method decomposes the rate of return on net assets to form the product of various indexes, so that enterprise managers can more clearly understand the financial ratio of enterprises. This article takes shuanghui company as the research object. shuanghui company is a large group mainly engaged in meat processing, and is also a leader in this industry in China. Shuanghui, as a manufacturing enterprise, the use of Du Pont analysis method will make the effect clearer. Since 2017, the price of pork has been declining continuously. The annual report of Shuanghui Development Company shows that both operating income and net profit have declined. This paper first introduces the principle of DuPont analysis method, then analyzes the financial data of Shuanghui from 2015 to 2018, and compares the data of return on net assets, net sales interest rate, total asset turnover rate and equity multiplier with those of three whole foods, and then puts forward some suggestions on the problems existing in the operation of the enterprise.
杜邦分析体系的研究
(一)杜邦分析体系产生的历史 1903 年,由多个各自独立的单一经营公司合并并在美国创立了杜邦公司,面对需要协调 的垂直式企业的多种经营市场组织以及如何将资本投向利润最大的经济活动等问题,公司的 经理们潜心研究并于 1919 年首创了以净资产收益率为核心的杜邦财务分析体系并应用成功。 迄今为止,已使用了近一个世纪。 (二)国外研究状况 近年来,随着经济与环境的发展变化和人们对企业目标认识的进一步升华,许多人对杜 邦分析法进行了变形,补充,使其不断完善与发展,最著名的是美国哈佛大学的教授帕利普 在其所著的《企业分析与评价》中,对杜邦分析体系进行了改善,使该体系得到了进一步的 发展。 (三)国内研究状况 我国并没有完善的杜邦分析体系,只是在 1995 年财政部发布了一系列的财务评价指标来 评价企业财务状况,主要有销售利润率、总资产报酬率、资本收益率、资本保值增值率、资 产负债率、流动比率、应收账款周转率、社会贡献率和社会积累率等,但都是孤立的,并没 有形成一种体系。因此主要是引进借鉴国外的杜邦分析体系。近年来,甘肃政法学院的邓家
1
东北经大学 2007 届本科毕业论文
姝教授在其所著的《杜邦财务分析体系的不足及改进》中,根据我国的不同国情,对杜邦财 务分析体系进行了改进,以便更好的为我国的上市公司服务。
杜邦财务分析是一种通过分解财务比率解释指标变动的原因和趋势为采取改进措施指明方向的财务分析方二文献回顾一杜邦分析体系产生的历史1903年由多个各自独立的单一经营公司合并并在美国创立了杜邦公司面对需要协调的垂直式企业的多种经营市场组织以及如何将资本投向利润最大的经济活动等问题公司的经理们潜心研究并于1919年首创了以净资产收益率为核心的杜邦财务分析体系并应用成功
东北财经大学本科毕业论文
对杜邦财务分析体系在上市公司应用的思考
杜邦分析法在财务管理中的应用分析--以昆药集团为例
二、杜邦分析法概述及财务指标的具体分析
(一)杜邦分析法的含义
杜邦分析法是由美国杜邦公司在1919年创造出来并首先在杜邦公司应用而取名为杜邦分析法的,它主要是利用了各财务比率之间所存在的内在联系,通过整合多项不同的财务指标,构建一个完整的综合评价系统,它能够系统全面地分析企业的盈利能力和评价股东权益回报水平,从财务角度评价企业销售获利、资产管理以及利用财务杠杆获利等方面的绩效。杜邦分析法的原理在于将企业的权益净利率以资产净利率,还有为权益乘数核心,往下逐级分解成各财务比率的乘积,分析其财务比率变动趋势,再结合近年来具体的财务报表数据的变动情况,去深度探讨企业主要财务指标是否处于一个良好的状态,重点揭示了企业销售获利能力、资产获利能力以及权益乘数对权益净利率的影响,以及各个相关财务指标之间的相互作用关系。
An Analysis of DuPont 's Analytical Method in Financial Management - Take KPC as an example
Abstract
With the continuous development of economy, the increasingly fierce competition, the enterprise management level is particularly important, as a core part of enterprise financial management and financial analysis, can objectively understand the financial situation, make reasonable decisions, a direct impact on the development of the enterprise in the future, therefore, can evaluate the company operation ability, debt paying ability, profit ability and development ability of dupont analytic method arises at the historic moment. The purpose of this paper is to through the du pont analysis system of the factor analysis method to confirm the influence degree of the main financial indicators, joint enterprise actual financial situation, again through the ratio of evaluation methods, to understand the change trend of financial indicators, points out the shortage of the company on the operation and management, and proposes the corresponding solution.
- 1、下载文档前请自行甄别文档内容的完整性,平台不提供额外的编辑、内容补充、找答案等附加服务。
- 2、"仅部分预览"的文档,不可在线预览部分如存在完整性等问题,可反馈申请退款(可完整预览的文档不适用该条件!)。
- 3、如文档侵犯您的权益,请联系客服反馈,我们会尽快为您处理(人工客服工作时间:9:00-18:30)。
Summary:Use DuPont analysis to analyze the enterprise financial situation. From DuPont system graph, we can see that return on equity reflects enterprise financing, investment and operation and business efficiency. Total asset yield mainly reflects the enterprise use assets on the efficiency of the production and business operation activities. The equity multiplier reflects the enterprise financing situation.
Content:
Using the trend analysis and financial ratios comprehensive analysis can understand enterprise all aspects of financial status. But that cannot reflect the enterprise all aspects of the relationship between financial situations. For example, through the financial ratios comprehensive analysis, enterprise financial condition can be quite comprehensively analyzed, but can't reveal enterprise various financial ratio’s relations. In fact, the enterprise's financial situation is a complete system, internal various factors are interdependence and interaction, any single factor changes can cause enterprise overall financial situation changes. Therefore financial analysis must be based on understanding of business financial status of various factors and internal
relations between each other. So what better way could go to analyze the financial position of the company? DuPont analysis is just such a kind of analysis method.
DuPont system mainly reflects the following several major financial ratio relations:
1、 return on equity = total endowment net profit margins * rights multiplier
2、 Total endowment net profit margins = sales net profit * total asset turnover
3、net profit margin on sales = net margin/sales revenue
4、 Total asset turnover = sales revenue/assets total average
The return on equity model disaggregates performance into the three components that determine return on equity: net profit margin, total asset turnover, and the equity multiplier. The profit margin allows the financial analyst to evaluate the income statement and the components of the income statement. Total asset turnover allows the financial analyst to evaluate the left-hand side of the balance sheet which is composed of the asset accounts. The equity multiplier allows the financial analyst to evaluate the right-hand side of the balance sheet which is composed of liabilities and owners equity. Net profit
margin can be decomposed into both the income and expense components. Total asset turnover can be decomposed into interest and non-interest income components .The net profit margin ratio can be used to develop a pro forma income statement. The total asset turnover ratio can be used to estimate the pro forma left-hand side of the balance sheet. The equity multiplier ratio can be used to estimate the pro forma right-hand side of the balance sheet. Thus, the DuPont system of financial analysis can be used to construct a financial plan for the bank. The DuPont system of financial analysis provides a means for the firm to monitor performance through the planning period and to post-audit the planning process.
using an example introduce the use of DuPont analysis system:(a department store)
The enterprise's sales income, cost, assets structure, capital flow speed directly affects the discretion of the asset returns. Then the company should exploit market, strengthen the marketing method, and increase income. Meanwhile the company should strengthen cost control, reduce cost and increase profits. In addition, the enterprise’s capital structure is unreasonable, excessive debt ratios, financial risks is exorbitant. Enterprise according to the environment timely
adjusts enterprise capital structure strategy.。