advisor原创教程
ADVISOR 二次开发方法介绍

开发步骤3
新模型的仿真验证
开发步骤3.1
双轴驱动混合动力汽车仿真
开发步骤3.3
双轴驱动混合动力汽车仿真结果
同时对比表1,2。混合动力BJ212汽车 比原传统的BJ212汽车具有更大的动力性, 而且还具有隐蔽行驶的特性,能使汽车以 50km/h行驶超过30km,并能为汽车提供 8.7kwh的能量(户外电站功能),即满足了军用车的 特殊要求。 同时通过对BJ212经济性能的仿真,发现其油耗由 原来的15L/100km下降到10.67 L/100km,降低了28.9%, 说明混合动力技术能很好的改善汽车的燃油经济性。
二次开发方法(结合实例)
例子: 基于ADVISOR软件的双轴驱动混合动力汽车性能仿真模块 的开发:汽车工程2003第五期
由于所研究的越野汽车为双轴四 轮驱动,需对其进行受力分析与 数学建模
开发步骤1
根据车辆动力学理论 建立双轴驱动的整车模型
开发步骤1.1
a
Fw Ff
F1
F2 α W2 Mg
W1
使用方法
首先打开MATLAB,正确设定其工作目录为: AdvisorPath。在MATLAB命令行输入:advisor,即可到其 启动界面,按Start按钮;进入到其主界面:整车参数输入界 面。 ADVISOR主要有三个界面:整车参数输入界面、仿真 参数输入界面和仿真运行结果界面。
RANAdvisor Rubix 快速启动指南 - 2015年9月说明书
RANAdvisor Rubix Quick Start GuideO VERVIEWThe RANAdvisor Rubix is a drive test post processing optimization application providing near to real-time information regarding your RAN services and applications. The data collected by drive test is uploaded to a file server where the files are processed and the results visualized in a web dashboard.This allows you to:•Quickly report on network and service performance•Quickly identify network coverage dead zones•Streamline the workflow and hence reduce cost. Identified problems can be forwarded to skilled engineers located centrally reducing theneed for expertise in the field.•Use the current analysis of your system to determine the optimum network configurations needed to meet future demandsRubix is a native cloud solution providing the following benefits: •Hosted internally in a private cloud or externally in a public cloud•One central storage of drive test log files•Accessible anywhere from internet-enabled devices including laptops, tablets, mobile phones•Easily scalable to meet your computing demands with improved performance and reliabilityF EATURES•Event Experience Benchmarking - provides a near real-time monitoring of the service quality perceived by the end users on yournetwork as well as the competitor’s networko Key Performance Indicators include; Accessibility,Retainability, Throughput and Latency of the RAN network •Indoor/Stadium Turn-Up - provides a health check for all antennae within a DAS venue using geocoded iBwave transmitter informationand log fileso The solution provides KPI per antenna to identify issues such as antenna not transmitting, or antenna not transmitting at theright levelsR ELATED D OCUMENTSUse this Quick Start Guide to get you started using RANAdvisor Rubix and then refer to the following sources for further information:RANAdvisor Rubix Online HelpRANAdvisor Rubix Installation GuideT ECHNICAL ASSISTANCEIf you need assistance or have questions related to the use of this product, go to the Customer Service Portal /en/services-and-support/support/customer-portal•Submit, update, or check Technical Support requests•Request RMA’s and check orders•Search our knowledge base Getting Started with RANAdvisor RubixIf you are using RANAdvisor Rubix for the first time, configure thesettings as shown below to start viewing data analysis results.A. Logging InThe RANAdvisor Rubix application is accessible via the internet.1 Open a browser and enter the server URL to launch the RANAdvisor RubixUser Interface (UI).2 In the Log In page, enter your Username and Password.3 Click Login.Your session starts and the Rubix Main Page is displayed.B. Selecting a ProjectThe data collected by drive test as either CSV or AOD/AHD log files isuploaded using a direct FTP to the Rubix solution. When a new file isdetected, it is processed to create a project record which is given a uniqueproject name. The projects are stored on a datastore defined by the systemadministrator.The first step is to select a project.1 Click the Select button to display the available projects.2 Select a project by:Clicking on a project name in the Latest Data list and click SelectorHighlighting projects in the Browse projects window (this allows you to selectmultiple projects), click the Add marked button, then click Select.Tip: You can filter the list of projects by project name or time range3 After a project is selected, you can select the KPI measurements you wantdisplayed.C. Selecting KPI measurement widgets for displayThe data collected is displayed in the dashboard widgets. The layout can becustomized allowing you to focus on the most important measurements.1 Click the Edit Layout button to open the Visible Widgets window.2 Select measurement widgets by clicking on them in the list.Tip: Selecting to display only the widgets that you are interested in canimprove the speed at which the widgets are reloaded after applyingany changes.4 After KPIs are selected, you can define and apply filters.D. Applying FiltersThe data processed for the selected projects can be filtered to display onlydata from specific Time ranges, Operators, Technologies, Channels orVenues. For example you may want to see the Drop Rate for LTE only overthe last 24hours.1 Click the Edit Filters button to display the available filters.2 Define your filters by clicking on the links displayed in the Filters window:Time Range –The time range available covers the time over which theselected projects contain dataOperators - The list of operators is dynamically refreshed according to theTime Range selectedTechnologies - The list of technologies is dynamically refreshed accordingto the Time Range selectedChannels - The list of Channel Numbers is dynamically refreshedaccording to the Time Range selectedVenue, building and floor – This filter is for indoor measurements withinthe building or stadium where the measurements were collected3 Click Close to return to the main window.4 Click the Apply button to apply your filters and display the results in thedashboard.Note: If the no dataiconor no datamessages are displayed,you should either remove or edit your filters and re-apply. If there is stillno data, then the project file has no collected data. You can downloadthe project log file for further investigation as described in Section G.5 After applying the filters, you can define KPI thresholds and colors.E. Defining KPI ThresholdsRubix is delivered with pre-defined threshold and color schemes assigned to each KPI. These schemes define how the KPI data is displayed in the dashboard widgets.The thresholds and colors are editable and can be customized to your preference. These settings can be saved.1 Click the Settings icon to display the KPI’s Color Schemes window.2 Select the Create color schemes tab, if not already selected.3 Click the Create button and enter the name for the new scheme in the default field.4 Enter the Lower than Value and Label for your threshold.5 Add more thresholds by clicking the +Add new color button and entering the More than Value and Label.6 Select a color for each defined threshold. For example::7 Click the OK button to confirm your settings for the new scheme and display it in the list of available schemes. You can continue to create and edit schemes and assign them to selected KPIs.8 To assign a scheme to a KPI, select the Assign color schemes tab, if not already selected.9 The KPIs are grouped into Dashboard KPIs, VoLTE KPIs, eMBMS KPIs and WiFi KPIs. Select a link to view the KPIs.10 Open the dropdown list for the KPI and select the scheme you want to assign to it.11 Click the Save button to save all your changes to the KPI schemes.12 Click the Close button to apply your thresholds and display the results on the dashboard.F. Viewing the Dashboard DataThe processed data is aggregated and displayed as color-coded square bins on top of the map.•The Zoom to Data button focuses the view on the actual data present •Additional data is displayed if you click on a bin•The Automatic bin size changes button enables you to automatically change the size of Bins on a map when zooming in or out based on the map scale•Clicking the view icon allows you to switch the view to either a Line chart or Pie chart if data is available•The full screen icon allows you to view the map in full screen•For the data collected indoors with a corresponding iBwave file loaded, an image of selected floor level indoor plan is drawn over a map.G. Downloading Project Log FilesIf the KPI results show any poor performance indicators, you can download the associated log files for further analysis using a 3rd party tool1 Click the Download project files icon to download the original log files for the selected project(s). H.Managing DocumentsThe Manage Documents icon allows you to save the state of the RubixApplication in a document. It saves all the settings for selected projects, chosenfilters, the state of widgets (map/chart).1 Click the Manage Documents icon and select Save as and enter a name tosave your settings.2 To retrieve a saved document, click the Manage Documents icon and selectOpen to select a document from a list of your saved documents.I. Antenna ValidationThe Antenna Validation Report provides a health check for all antennae withina DAS venue using geocoded iBwave transmitter information and AHD log file.This report is generated for LTE and UMTS technologies.The Report table comprises of the Header, the Antenna details column andseparate report columns for the Handset and Scanner.Update button updates report after changes made in Technology, Number ofSamples or PercentileShow Problems Only button filters data from ranges colored in orange andred. If at least one value is "red" in a row, the whole corresponding row isshown.J. eMBMSIf available in the project data, you can view KPIs regarding to evolvedMultimedia Broadcast Multicast Services eMBMS. The data is displayed on theeMBMS dashboard and can be viewed as:•SINR eMBMS Line Chart•Delta eMBMS Line Chart•TableK. VoLTEIf available in the project data, you can view KPIs regarding to Voice over LTE.The data is displayed on the VoLTE dashboard and can be viewed as:•Map•Line Chart•Pie Chart•TableL. WiFiIf available in the project data, you can view KPIs regarding to WiFi. The datais displayed on the WiFi dashboard and can be viewed as:•Map•Line Chart•Pie Chart•TableRANAdvisor RubixQuick Start Guide。
ADVISOR2002简介

后向仿真与前向仿真
• 后向仿真一般被用于仿真初期的系统预估, 即对所需开发的电动汽车整车结构及相应 的控制策略进行初步的筛选与评估。 • 前向仿真则是在实车系统组装前,通过对 己基本确定的部件进行详细的设计和动态 模拟,在寻求和优化相匹配的整车控制策 略的原则指导下,适当改进相应部件的设 计参数,以达到使整车性能满足设计要求 的目的。
一、基本用途
• ADVISOR可以用来仿真汽车的动力性能和经 济性能。
• 动力性能包括:加速性、最高车速、爬坡 性能 • 经济性能主要指标准工况的燃油经济性。 • 适用于汽车的种类:传统汽车、纯电动汽 车、混合动力汽车、燃料电池汽车 • 适用车型:前轮驱动型
二、高级用途
• ASVISOR是提供一个仿真平台,为整车和部 件参数设计和研究提供便捷的方法。如: 设计参数的优化匹配,包括整车或部件参 数。 • 考查传统汽车自动变速器的换挡规律
• 开发用户定义的驱动型汽车的仿真,如后 驱式等。
三、使用方法
• 打开Matlab,设置其工作目录。在命令行输 入:advisor,即可到启动界面,按Start按钮 进入主界面:整车参数输入界面。 • ADVISOR有三个界面:整车参数输入界面、 仿真参数输入界面、仿真运行结果界面。
使用方法(整车参数输入)
使用方法(仿真结果)
使用方法(仿真结果分析)
• 以图形化来显示,把多变量在同一图形中 进行对比,对其各总成的能量消耗情况进 行显示,对各部件的效率历程显示出来等。 • 可用性验证:ADVISOR的仿真结果与实验结 果对比。
使用方法(整车参数输入)
• 整车参数输入有两种方法:
• 对于表格参数如发动机的万有特性,必须 由其m文件进行修改并加载到ADVISOR中。
修改ADVISOR控制策略的的个人经验
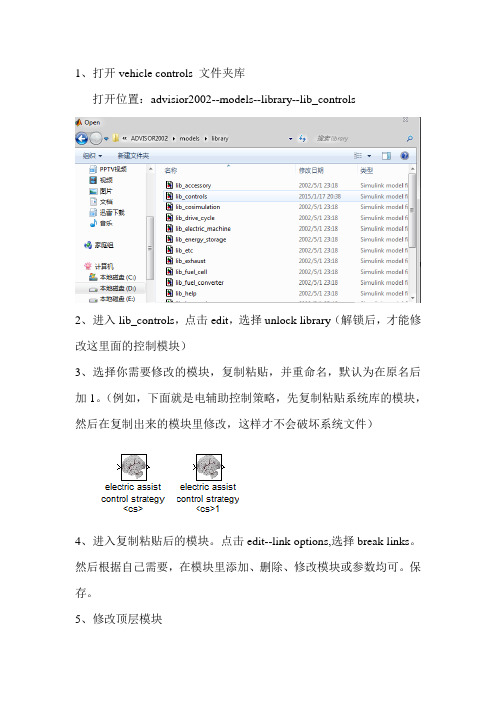
1、打开vehicle controls 文件夹库
打开位置:advisior2002--models--library--lib_controls
2、进入lib_controls,点击edit,选择unlock library(解锁后,才能修改这里面的控制模块)
3、选择你需要修改的模块,复制粘贴,并重命名,默认为在原名后加1。
(例如,下面就是电辅助控制策略,先复制粘贴系统库的模块,然后在复制出来的模块里修改,这样才不会破坏系统文件)
4、进入复制粘贴后的模块。
点击edit--link options,选择break links。
然后根据自己需要,在模块里添加、删除、修改模块或参数均可。
保存。
5、修改顶层模块
打开你需要控制的某一具体车型的整体mdl文件,另命名,保存。
6、在整车mdl模型中,找到你需要修改的子模块位于哪里,点击进去尽情的修改(温馨提醒:这里主要是注意自己先前修改的控制策略而引入的控制变量参数,通过GoTo或者from来实现参数传递)。
7、修改m文件。
因为advisor里仿真的实质是通过m函数来调用各个模块,进行参数和变量的传递。
因此,必须修改m函数,上面的修改才有意义,不然根本不会产生任何的作用。
修改m文件,其实就是把你控制策略引入的新参数和新文件模块在驱动链里声明。
具体请参考教材230-231.这里我也不清楚呀,学长~
个人经验,如有错误,欢迎批评指正~。
机械毕业设计英文外文翻译4ADVISOR 使用说明
附录ADVISOR Documentation3.1 ADVISOR file structure3.1.1 File interactions & data flowThe above schematic represents data flow in the ADVISOR file system. The four main agent types are:◆Input Scripts define variables in the workspace and/or call other inputscripts. An example is MC_PM32.M.◆Block Diagrams are Simulink files containing the equations used tocompute outputs such as fuel use from inputs such as an engine map.They are the models. One example is BD_PAR.MDL.◆Output Scripts post process the model outputs by querying theworkspace. These may include plotting routines or error checkingroutines. chkoutputs.m is an example.◆Control Scripts may both develop inputs and process outputs. Examplesinclude the ADVISOR GUI and optimization routines.3.1.2 File locationsThe main ADVISOR directory (e.g. c:\ADVISOR or c:\Program Files\ADVISOR) contains several sub directories. Among these are the data, GUI, and models directories that contain the corresponding files.3.1.3 File naming conventionsAll model and data files use a prefix followed by an underscore (‘_’) that is the same as the prefix used for (nearly all of) the variables it defines, which in turn is in pointy brackets (<>) at the end of the Simulink block in which those variables are used. Here are ADVISOR’s c omponent file types:ACC_*.M Accessory load filesCYC_*.M Driving cycle files, which define variables starting with cyc_, used in the block labeled <cyc>ESS_*.M Energy storage system data files, which likewise define variables starting with ess_, used in the block labeled <ess>EX_*.M Exhaust after treatment files (such as catalysts)FC_*.M Fuel converter data filesTX_*.M Transmission data files (these include gearbox-gb and final drive-fd variables)GC_*.M Generator/controller data filesMC_*.M Motor/controller data filesPTC_*.M Powertrain control data files, which define engine control, clutch control, and hybrid control strategy variables starting with vc_ and cs_, used in blocks labeled <vc> and <cs>TC_*.M Torque coupler data filesVEH_*.M Vehicle data filesWH_*.M Wheel/axle data filesIn addition to the above component data files, there is one other type thatuse prefixes:BD_*.MDL Simulink block diagrams (models)All filenames that include prefixes are entirely in capital letters to avoid confusion with variable names, which are entirely in lower-case letters.3.1.4 Adding files to ADVISORThe easiest way to add a particular kind of file to ADVISOR is to modify an existing file of that kind and save it with a new file name, entirely in capital letters, in the appropriate ADVISOR directory. This will ensure that all variables necessary to fully define the particular component will be included in your new file. For adding vehicle component or drive cycle files, clicking the pushbutton in the graphical user interface brings up a window to guide the process.3.1.5 Inspecting input filesComponent files and nearly all other files in ADVISOR are text files (the exceptions are mat files, which contain Matlab-specific data), and can be viewed and edited in any text editor. A fixed pitch font helps. We recommend using the Matlab editor/debugger packaged with Matlab 5.3. Additionally, text files can be viewed in the Matlab command window by entering type filename at the MATLAB command line.3.1.6 Deleting files from ADVISOR‟s databaseFiles can be removed from ADVISOR by either deleting them using your operating system or by entering the following at the Matlab command line: !rm filenameDeleting files via the operating system is preferable, especially on PC and Macintosh platforms, where …deleted‟ files will be preserved in Trash or the Recycle Bin.3.2 Drivetrain model descriptionsADVISOR has six different vehicle types and two specific vehicle choices, as listed below. Each of these has a different drivetrain. There is also an option to use a custom drivetrain.Conventional Drivetrain: The conventional vehicle represents a typical passenger car. It uses only a fuel converter for motive power. The default gearbox is a 5 speed. The conventional accessories are a constant mechanical power load.Series Drivetrain: The series vehicle components include a fuel converter, a generator, batteries, and a motor. The fuel converter does not drive the vehicle shaft directly. Instead, it converts mechanical energy directly into electrical energy via the generator. All torque used to move the vehicle comes from the motor. The default gearbox is a one speed. The default control strategy is a series power follower. The hybrid accessories are a constant electrical power load.Parallel Drivetrain: The parallel vehicle components include an engine, batteries, and a motor. Is is named parallel because both the motor and the engine can apply torque to move the vehicle. The motor can act in reverse as a generator for braking and to charge the batteries. The default control strategy isan electric assist. The default gearbox is a 5 speed. The hybrid accessories are a constant electrical power load.Parallel Starter/Alternator: The parallel starter/alternator vehicle components include an engine, batteries, and a motor. It is named parallel starter/alternator because the motor behaves like the starter and the alternator of a conventional vehicle. It allows for engine shutdown and restart and for minimal electric assist. It is a parallel design because both the motor and the engine can apply torque to move the vehicle. The major difference between the parallel starter/alternator design and the basic parallel design is the location of the clutch. The clutch is positioned between the gearbox and torque coupler in the parallel starter/alternator design while it is located between the torque coupler and the engine in the basic parallel design. This means that if the vehicle is moving and the clutch is engage both the engine and motor shafts must be rotating. The motor can act in reverse as a generator for braking and to charge the batteries. The default control strategy is an electric assist <Parallel.htm>. The default gearbox is a 5 speed. The hybrid accessories are a constant electrical power load.Custom:The above figure represents a conventional vehicle's drivetrain using components from ADVISOR. Note that most blocks have two inputs and two outputs. Each block passes and transforms a torque and speed request, and each block also passes an achievable or actual torque and speed.The top arrows, feeding left-to-right, are the torque and speed requests. Thedrive cycle requests or requires a given speed. Each block between the driving cycle and the torque provider, in this case the ICE, then computes its required input given its required output. It does this by applying losses, speed reductions or multiplications, and its performance limits.At the end of the line, the …ICE fuel converter‟ uses its required torque output and speed to determine how much torque it can actually deliver and its maximum speed. Then passing information back to the left, each component determines its actual output given its actual input, using losses computed during the …input requirement‟ pass described above. Finally, the vehicle block computes the vehicle's actual speed given the tractive force and speed limit it receives, and uses this speed to compute acceleration for the next time step. And so the cycle continues throughout the duration of the driving cycle.The following describe the torque, speed, and power transformations performed by the drivetrain component models that connected to each other as explained above to build a vehicle model. In addition, the somewhat trickier blocks that perform solely …control‟ f unctions are documented below.3.2.3 TransmissionTorque couplerTorque coupler block diagramRole of subsystem in vehiclePhysically, a torque coupler is a three-sprocket belt or chain drive whereby two torque sources combine their torques to provide to a drivetrain component such as the gearbox or final drive. The torque coupler block diagram processes atorque and speed request from the downstream drivetrain component and apportions requests of the two ‘feeder’ torque sources.Description of modeling approachThe effects of torque loss and a gear ratio between the second of the torque input devices and the output are modeled here. The torque loss is a constant whenever the torque coupler is spinning.The torque coupler first requests the sum of necessary output torque and torque coupler loss from the first torque source. Using the actual/available torque of the first source, it requests the balance of the second torque source. The speeds of the two torque providers are in constant proportion to the torque coupler output speed: the first input speed equals the output speed, and the second input speed is greater by a factor tc_mc_to_fc_ratio.GearboxGearbox block diagram Role of subsystem in vehicleThe gearbox of a multi-speed transmission houses gears of different gear ratios that are used to transmit torque from the engine or tractive motor to the final drive and on to the wheels. It thereby allows a number of discrete speed reduction and torque multiplication factors. Inclusion of a gearbox is critical to the drivetrain of conventional and parallel hybrid vehicles, and generally less important for series hybrids.Description of modeling approachThe gearbox model in ADVISOR usually communicates physics (torque, speed,and power) information to and from the final drive submodel and engine, torque converter, and/or motor model. Control information as might be sensed or commanded by a CPU in the vehicle, such as gear number, is passed to and from the transmission control submodel.Effects on torque and speed in the gearbox include:∙torque multiplication and speed reduction via the gear ratio,∙torque loss due to the acceleration of rotational inertia, and∙torque loss due to the friction of the turning gears.These effects are modeled empirically. Data files such as <ADVISOR directory>/data/transmission/TX_5SPD.M are required to supply necessary physical parameters.The equations represented by the Simulink block diagram in the picture corresponding to the link above are as follows.Equations used in subsystemTORQUE AND SPEED REQUIRED(torque req’d into gearbox) = (torque req’d out of gearbox) / (current gear ratio) +(torque req’d to accelerate rotational inertia) + (torque loss due to friction),where(torque req’d out of gearbox) is a Simulink input (#1, in the top left of the above figure)(current gear ratio) is computed from (current gear number), which is provided by the "gearbox controller interface" block, using the look-up vector gb_ratio(torque req’d to accelerate rotational inertia) = gb_inertia* d(speed req’d into gearbox)/dt(torque loss at transmission input due to friction) = function of [torque at output-side of gearbox, angular speed at output side of gearbox, gear (e.g., 1st, 2nd, etc.)]--this is implemented with a lookup-table(speed req’d into gearbox) = (speed req’d out of gearbox) * (current gear ratio)TORQUE AND SPEED AVAILABLE(torque avail. at output side of gearbox) = { (torque avail. at input side of gearbox) * [(output side power) / (input side power)]required - (torque req’d to accelerate rotational inertia) } * (current gear ratio)where(torque avail. at input side of gearbox) is a Simulink input (#2, in the bottom left of the above figure)[(output side power) / (input side power)]required is computed from the input and output torques and speeds of the REQUIRED calculations(speed avail. at output side of gearbox) = (speed avail. at input side of gearbox) / (current gear ratio)ADVISOR 使用说明3.1ADVISOR的文件结构3.1.1 文件交互与数据流ADVISOR 文件系统的数据流如上图所示。
aop introductionadvisor

AOP(Aspect-Oriented Programming)中的IntroductionAdvisor是一个特殊的Advisor,用于在不修改Java类的情况下,引入新的接口或属性,以增强类的功能。
它通过使用AspectJ的Introduction功能来实现这一目标。
与PointcutAdvisor不同,IntroductionAdvisor的切点是类级别的,而不是方法级别的。
这意味着IntroductionAdvisor可以在不改变原有方法实现的情况下,为整个类添加新的属性和行为。
使用IntroductionAdvisor,可以将一些通用功能抽取出来,以方面的方式应用到多个类上,从而避免了代码重复和冗余。
这种技术可以应用于日志记录、事务管理、安全控制等场景,提高了代码的可维护性和可扩展性。
0-AltiumDesigner教程(实用版)(V1.0)(Leo)(20191206)
快捷键:英文模式下工具栏有下划线的字母即为快捷键End:刷新按住Shift多选V(View)+F/D==F查看整个绘图区,D查看整个sheet图纸;V(View)+E(Select)=查看选中的物体;O(快捷键O是一个总和菜单,包含常用的选项)+P==原理图PCB属性(全局属性,更改后会保存到整个Altium中);O+B==原理图页属性、PCB板子属性;D(Design)+P(Perfrence)==原理图属性(全局属性,更改后会保存到整个Altium中);D(Design)+O(Option)==原理图sheet属性(包含网格、表格、单位等属性);D+L(快捷键L)==颜色配置(Ctrl+D或者O+D)Ctrl+Q,mm/mil单位切换;Ctrl+M,测量距离;Table,放置元件走线时编辑属性;按住Ctrl+拖动元件,连接的线可以跟着延长而不会断开,另一种方法是Drag;Alt+左键选择网络等(AD18);Clear(Shift+C),清除选择(去掉蒙板,当有蒙板后可以使用全选Ctrl+A选择全部高亮的元件等);Ctrl+F,查找或查找相似物体(PCB为Shift+F查找,PCB中Ctrl+F为翻转板子视图从底层看)Ctrl+H,替换Ctrl+Shift+X:原理图PCB交互规则设置检查:Tools——Design Rule Check;PCB:J(jump)+C(component)快速搜索定位元件;PCB:右键点击空白——Align—align对齐排列;PCB:A(align)对齐;PCB:S(select)选择。
例如选择网络,按S键选择NET;PCB:N(net),Show显示Hide隐藏Connect飞线;PCB:Shift+F,查找选择网络元件等(必要时将Any改为Same);PCB:Shift+S,单层显示;PCB:Shift+R走线模式切换。
推挤模式(推挤VIA,绕过障碍物等);PCB:Shift+空格Space切换走线角度45度、45度圆角、90度、90度圆角、任意角度;PCB:P+T交互式走线;PCB:*换层,小键盘“+”,“-”号。
(完整版)AD教程
这里和步骤1.2类似,记得保存。
到这里2元件与封装
各文件的作用与联系:在集成库下画元件和封装,具体是原理图库里画元件,封装库里画封装,画好封装后要把各个封装添加到对应的元件里。画好各个元件并添加了对应的封装后,把所需元件放置到原理图里,之后在原理图里连线,最后把原理图更新到PCB里(此时PCB里显示的是各元件对应的封装,各封装已经有一条条细线连着,接着要排版并用布线连好),最后打印出来做板的是PCB里面弄好的东西。
建PCB工程和集成库的总流程如下:
1)建立PCB工程(PCB project)>>在工程下建立原理图(Schematic)>>在工程下建立PCB
2)建立集成库>>在集成库下建立原理图库(Schematic Library)>在集成库下建立封装库(PCB Library)
至于每个文件的作用和联系待建完后再说。
2)画贴片电阻的封装
画贴片电阻的封装和直插电阻的封装步骤完全一样,不同之处就是焊盘参数的设置,设置为如图2-31。可以看到,与直插相比,所在层从Multi-layer(所有层)改为Top-layer(顶层),这里画的是贴片电阻0805的封装,长为48mil,宽为45mil,焊盘距离为63mil,效果如图2-32。注意:一般贴片元件的封装都是不用自己画的,他们有特定的型号,如0805,1812,0603,SOT23等,这些都可以直接在自带的封装库里找到。举这个画贴片电阻的例子只是让你学会画贴片封装而已。
最后画的图2-15效果(如果发现引脚不能放到矩形边的中间,可设置跳转栅格,设置为5,尽量不要设得太小,如图2-16)
- 1、下载文档前请自行甄别文档内容的完整性,平台不提供额外的编辑、内容补充、找答案等附加服务。
- 2、"仅部分预览"的文档,不可在线预览部分如存在完整性等问题,可反馈申请退款(可完整预览的文档不适用该条件!)。
- 3、如文档侵犯您的权益,请联系客服反馈,我们会尽快为您处理(人工客服工作时间:9:00-18:30)。
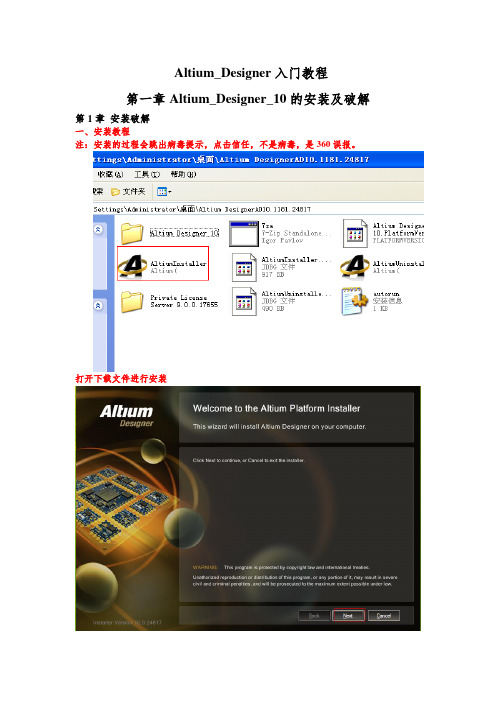
ADVISOR2002基础到高级引导教程(原创)By Scofision From NJUST第一部分:软件安装及使用ADVISOR是基于matlab/simulink开发的先进电动汽车软件,主要功能是用于分析,而不是设计,从我对其help的阅读了解,ADVISOR需要且最好安装在matlab6.1上,当然matlab6.5+需要安装补丁(补丁由mathworks提供的),当然还有网传的matlab在更高版本上运行,可信度不高(后面分析,还有弊端),并有人以此为牟利,我和另一个朋友ID:继续潜水,不提倡网上朋友花钱购买那个,而继续潜水也根据他的研究,提供了一种方法可以在高版本上运行,但对于有二次开发需求的朋友,高版本上二次开发貌似还有缺陷,需要继续研究。
上面这个是advisor2002的安装程序包,它其实是一个压缩包类型的文件,Extract T o指,文件展开(安装到)Drivers那个驱动器上。
比如,我文件安装到D:\advisor2002,我选择D:\ADVISOR2002然后点击extract解压.。
你会发现系统创建并把文件解压到advisor2002中了。
好,这里我们先来认识下张开后文件夹个文件夹的含义:Data文件夹(不是Dota,呵呵)里面是车辆部件数据文件,包括很多,在这不逐个解释,后面需要的时候在解释。
Documentation文件夹是帮助文件夹,里面都是帮助文件,当然你可以在软件开启的时候,打开,有些浏览器问题可能会打不开,你可以在浏览器地址栏输入:D:\advisor2002\documentation\advisor_ch1.htm上句地址的含义是在你所安装的advisor文件夹中找到advisor_ch1.htm文件而已。
Extras文件夹是扩展文件夹,包含着,电池模型扩展;发动机模型扩展;发动机map图转成数据图(image2map,这里的2代表to(two=to),转换的意思,开发的人为了方便,写成这样,后面有好多都是这样的表示);还有简单的数据比较文件夹;发动机比例转换;还有第三方优化软件VSOLE的文件夹。
GUI文件夹,很重要,二次开发的注意:里面包换的都是Guide GUI开发的fig文件和m文件,这2部分组成了用户界面,控制着程序的运行,相应用户的操作。
新手可以关注下。
Gui_graphics 顾名思义,就是GUI开发需要用到的图片什么的,当然也有声音。
(有趣的修改:比如你自己录个声音保存成wav格式‘welcome to advisor!’,然后替换advisor.wav,软件开启的时候,就是自己的声音,这个比较个性化,有趣的东西,很简单。
)Interactive文件夹:是用户交互式仿真,大家如果英文好,其实advisor学起来也快。
Models文件夹:里面都是advisor内置的车辆模型,是simulink开发的,需要注意的是library,即库文件夹,里面是个部件的simulink模型。
对于2次开发,也需要认真关注。
Optimization是优化文件夹。
vdoc_matlab是优化程序,具体怎么用,可以看看它的help。
Tmp是临时文件夹,计算时候临时存放数据的Save_vehicles,保存的车辆整个数据的文件夹,等界面的时候再说。
其他的文件用到时再说。
首次开启软件,如下,打开matlab/然后在当然目录下选择安装advisor的软件文件夹,然后在command中输入advisor,会有首次安装组件设置,点yes。
Ok如下。
第二部分GUI初步引导(需要软件界面开发的,自己研究下,有需要再讨论,我对GUI认识也很浅,一起进步)网上经常有人问:是否有汉化版本?我在文献中看到有中文版的!种种问题,在此我初步解释,Advisor的GUI开发是通过guide GUI开发的,所以界面控件很容易改。
这里,我可以公布简单的汉化过程:首先,打开matlab 在命令行输入;guide,熟悉下开发界面,一般的matlab基础知识的书都会有讲。
需要的人找本相应的书看看,建议(GUI设计学习手记,好像是北航学生自己出的,当然其他书也行,不深入的人看个大概就行)然后点击菜单-file,找到advisor.fig开启界面,仔细看看,双击控件,或者控件属性需要懂各部分左边属性意义,举个例子,第一个backgroundcolor,指控件背景颜色,你修改下红色,重新保存advisor.fig文件,然后命令行输入advisor时,开启的界面那个颜色就会改变。
OK基于简单原理,我们去寻找一个每个控件的string值,把他翻译成中文。
比如:‘start’修改成‘启动’,重新保存,就ok,后面如上试验下。
所以,我们汉化的主要工作就是把每个控件的string的英文值修改成中文值,就ok,之后,我们需要做的只是重复工作,前面部分说过的GUI文件夹中,找到以fig为后缀的文件,比如inputfig.fig,就是输入界面,请依次修改,汉化就ok。
(特别注意几个问题:1,控件的属性值callback是回调函数,不深入的朋友勿动,他是响应控件操作的属性,第二tag属性值,新手也勿动,它相当于控件的ID,有点像c语言的指针,不晓得这样说对不对,我c语言还在自学中。
)第三部分:软件的熟悉首先,说明在软件开启的过程,请注意matlab命令行,还有workspace。
(workspace后面再说。
)1,vehicle input是车辆输入的模型,只是一张图片,每个固定区域双击,都有响应。
如:点击发动机那部分,打开发动机模型数据文件选择的GUI界面2,左下部分,是图片是车辆部件的数据转化成图片,如:燃料转换器(fc_converter,可以有三种:一种是汽油机,柴油机,还有燃料电池)里面的数据,转速,转矩,和燃油消耗率,转化成map图。
软件开启默认是并联结构,fc默认是fc_SI41_emis.如果觉得图看的不清楚,你可以点击以下图,然后电机菜单edit,然后里面有3个copy….,n你点击,然后可以在打开图,在matlab中修改,放大,等等操作,动手试试。
3,中上,load file,是选择已有的车辆整个数据的m文件,仔细认识下,你点击load file,打开界面选择需要的文件,双击view/edit m-file部分解释:global vinf,代表全局变量vinf的声明,全局变量通俗的讲指,matlab的创建的函数,包括子函数及其他函数,都能用这个变量。
,特别注意其中的“.”这代表它是个结构变量,(c语言类似),后面的'PARALLEL_defaults_in'是这个变量的赋值,“''”这个形式代表是个字符串。
如果以上不了解,请先看看matlab基本知识的书。
懂上面的,余下的好解释了:='parallel',指驱动链名为parallel,(并联形式)vinf.XXX.ver,指XXX部件的模型(version的缩写ver,注意advisor很多都是缩写)vinf.XXX.type,指XXX部件的类型,值XXX部件的名字(注意:试试把parallel改成series其他不变,会出错)4 drivetrain config,代表驱动链结构,分别有(串联,并联,纯电动,传统汽车,自定义,pruis形式和insight形式),这里是和上面的有关联,如果第3点吧parallel改成‘ABC’,当载入车辆文件的时候,matlab会发现没有对应的驱动链ABC,matlab提示错误。
5 在之后的都是车辆结构数据文件,部件数据文件,vehicle里面有风阻系数,重力加速度,车重,车的重心高,等等Fc_converter值燃料转换器的数据文件,点击ic旁边的倒三角选择fc的simulink模型(它会自动选择的),点击is,选择模型的形式(汽油or柴油),后面的41代表最大功率,0.34代表最高效率,131代表fc的重量。
(注意,这里的数据都太老了,因为本身advisor开发的年代较早,发动机的一些数据都太老,如果用advisor建模需要现在发动机的实验数据,如果没有,有一种方法是通过内置发动机的map图,比例换算,但这是在没办法的情况下——这里我指的是数据建模,不是simulink建模,后面再说明)6 ok,其他部分自己琢磨,自己研究出来的东西,才记得清楚,懂的明白。
如果不懂欢迎来汽车工程师之家/advisor版区讨论,看教程做的,如果多了,我就后面单独另附教程,如果不多,我就写到这篇教程了)7,view block diagram,代表浏览advisor整车的顶层simulink模型,如下:(注意:advisor是前向后向模型建立的模型,后向指——从工况模型到车辆模型,再到轮胎,依次下去,最后一个部件反向计算,是需求功率等的计算,从上图中可以看出,是向右的方向,反之,向左的方向是前向模型,后向建模个人认为对于分析性能很好,向前模型对于设计很好,请品味这句话。
还有前向模型的软件一般会有驾驶员模型,指驾驶员的操作-加速踏板,制动踏板信号等)7 中下的variable,是变量值的修改,只要部件数据文件中含有的变量都可以通过这里修改,比如fc_acc_mass,(发动机附件质量,默认的,是32.8kg,点击Edit Var,修改为35kg,点击ok,仿真的就已35kg计算。
这里必须要说的:个人非常不建议这种方法来修改变量保存仿真,这里修改的变量,你需要逐个修改,可能你会修改了一个忘了哪个没修改,还有修改了只有仿真一次有效,也就是说,除非你修改之后每次都要点击save 按钮把新的车辆的全部数据保存成m-file,才能多次仿真有效。
而且在这里改还不容易了解各部件的内部数据结构,不建议,不建议,最好你建模的时候是一打开部件m-file,比如电池,ess_PB25,你打开,逐个认识变量,了解结构,当你懂了内部结构,然后根据实验数据,依次修改为你的数据,仿真准确度相对较高。
(当然没实验数据,特别是国内做论文,只能以相近的电池数据比例计算来得到。
)8 auto size 自动尺寸计算,个人认为它是有点前期优化性质,它有2种方法,一种是用matlab自动计算,一种是第三方软件visualDoc计算,指的是满足约束的情况下,自己计算以下部件的参数,约束有2个,一个是爬坡度,一个是加速性,设计的部件名有:燃料转换器,ESS个数(电池个数),motor size电机尺寸,还有其他等等,对于visualdoc,还可以有设计目标。
和设计循环。
9 设置好所有部件的参数之后,点击contisue,继续进入工况选择,和仿真性能要求设置。
左上是工况的数据图,横轴是time,纵轴是speed,(oh,前面忘了说,软件开启的时候,有单位选择,国内用metric米制,国外用的是US英制,如果前面忘了选,可以在菜单栏还有机会修改)。