MT 1 2 gene expression in the human prostate
Spatiotemporal control of gene expression by a light-switchable transgene system
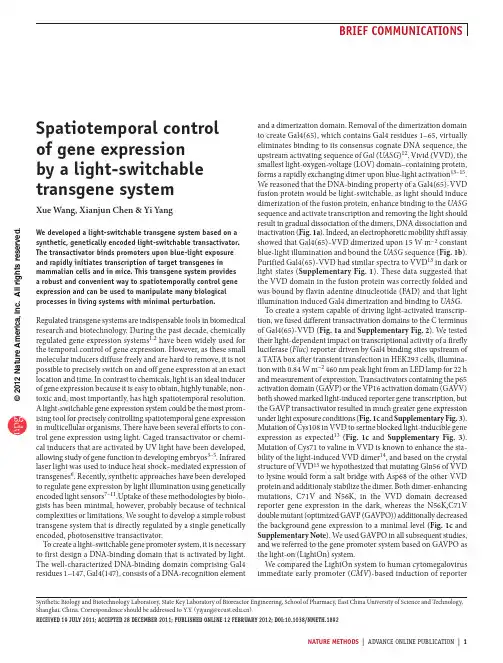
©2012 N a t u r e A m e r i c a , I n c . A l l r i g h t s r e s e r v e d.nature methods | ADVANCE ONLINE PUBLICATION | and a dimerization domain. Removal of the dimerization domain to create Gal4(65), which contains Gal4 residues 1–65, virtually eliminates binding to its consensus cognate DNA sequence, the upstream activating sequence of Gal (UASG )12. Vivid (VVD), the smallest light-oxygen-voltage (LOV) domain–containing protein, forms a rapidly exchanging dimer upon blue-light activation 13–15. We reasoned that the DNA-binding property of a Gal4(65)-VVD fusion protein would be light-switchable, as light should induce dimerization of the fusion protein, enhance binding to the UASG sequence and activate transcription and removing the light should result in gradual dissociation of the dimers, DNA dissociation and inactivation (Fig. 1a ). Indeed, an electrophoretic mobility shift assay showed that Gal4(65)-VVD dimerized upon 15 W m −2 constant blue-light illumination and bound the UASG sequence (Fig. 1b ).Purified Gal4(65)-VVD had similar spectra to VVD 13 in dark orlight states (Supplementary Fig. 1). These data suggested that the VVD domain in the fusion protein was correctly folded and was bound by flavin adenine dinucleotide (FAD) and that light illumination induced Gal4 dimerization and binding to UASG .To create a system capable of driving light-activated transcrip-tion, we fused different transactivation domains to the C terminus of Gal4(65)-VVD (Fig. 1a and Supplementary Fig. 2). We tested their light-dependent impact on transcriptional activity of a firefly luciferase (Fluc ) reporter driven by Gal4 binding sites upstream of a TATA box after transient transfection in HEK293 cells, illumina-tion with 0.84 W m −2 460 nm peak light from an LED lamp for 22 h and measurement of expression. Transactivators containing the p65 activation domain (GAVP) or the VP16 activation domain (GAVV) both showed marked light-induced reporter gene transcription, but the GAVP transactivator resulted in much greater gene expression under light exposure conditions (Fig. 1c and Supplementary Fig. 3). Mutation of Cys108 in VVD to serine blocked light-inducible gene expression as expected 13 (Fig. 1c and Supplementary Fig. 3). Mutation of Cys71 to valine in VVD is known to enhance the sta-bility of the light-induced VVD dimer 14, and based on the crystal structure of VVD 13 we hypothesized that mutating Gln56 of VVD to lysine would form a salt bridge with Asp68 of the other VVD protein and additionaly stabilize the dimer. Both dimer-enhancing mutations, C71V and N56K, in the VVD domain decreased reporter gene expression in the dark, whereas the N56K,C71Vd ouble mutant (optimized GAVP (GAVPO)) additionally decreased the background gene expression to a minimal level (Fig. 1c and Supplementary Note ). We used GAVPO in all subsequent studies, and we referred to the gene promoter system based on GAVPO as the light-on (LightOn) system.We compared the LightOn system to human cytomegalovirus immediate early promoter (CMV )-based induction of reporterspatiotemporal control of gene expression by a light-switchable transgene systemXue Wang, Xianjun Chen & Yi YangWe developed a light-switchable transgene system based on a synthetic, genetically encoded light-switchable transactivator. the transactivator binds promoters upon blue-light exposure and rapidly initiates transcription of target transgenes in mammalian cells and in mice. this transgene system provides a robust and convenient way to spatiotemporally control gene expression and can be used to manipulate many biological processes in living systems with minimal perturbation.Regulated transgene systems are indispensable tools in biomedical research and biotechnology. During the past decade, chemically regulated gene expression systems 1,2 have been widely used for the temporal control of gene expression. However, as these small molecular inducers diffuse freely and are hard to remove, it is not possible to precisely switch on and off gene expression at an exact location and time. In contrast to chemicals, light is an ideal inducer of gene expression because it is easy to obtain, highly tunable, non-toxic and, most importantly, has high spatiotemporal resolution. A light-switchable gene expression system could be the most prom-ising tool for precisely controlling spatiotemporal gene expression in multicellular organisms. There have been several efforts to con-trol gene expression using light. Caged transactivator or chemi-cal inducers that are activated by UV light have been developed, allowing study of gene function in developing embryos 3–5. Infrared laser light was used to induce heat shock–mediated expression of transgenes 6. Recently, synthetic approaches have been developed to regulate gene expression by light illumination using genetically encoded light sensors 7–11.Uptake of these methodologies by biolo-gists has been minimal, however, probably because of technical complexities or limitations. We sought to develop a simple robust transgene system that is directly regulated by a single genetically encoded, photosensitive transactivator.To create a light-switchable gene promoter system, it is necessary to first design a DNA-binding domain that is activated by light. The well-characterized DNA-binding domain comprising Gal4 residues 1–147, Gal4(147), consists of a DNA-recognition elementSynthetic Biology and Biotechnology Laboratory, State Key Laboratory of Bioreactor Engineering, School of Pharmacy, East China University of Science and Technology, Shanghai, China. Correspondence should be addressed to Y.Y. (yiyang@).Received 19 July 2011; accepted 28 decembeR 2011; published online 12 febRuaRy 2012; doi:10.1038/nmeth.1892©2012 N a t u r e A m e r i c a , I n c . A l l r i g h t s r e s e r v e d . | ADVANCE ONLINE PUBLICATION | nature methodsbrief communicationsvectors driving Fluc , Gaussia princeps luciferase (Gluc), humanized recombinant GFP (hrGFP) or monomeric (m)Cherry protein expression by transient transfection of vectors encoding all components into HEK293 cells and light exposure as described above (Fig. 1d and Supplementary Figs. 4 and 5). We con-firmed that light-mediated activation required all components by western blots of Gluc (Fig. 1e ). We routinely observed 200–300-fold induction of Fluc and Gluc in our experiments and a similarly high on/off ratio of gene expression and induction efficiency of LightOn system in other cells lines (Fig. 1f ). The blue-light irradiation had little effect on expression of proteins whose tran-scription was driven by CMV promoter (Fig. 1d ), suggesting that the LightOn system has minimal interference with or toxicity to normal cellular function.We investigated the time course of light-induced Gluc tran-scription using quantitative real-time PCR. Cellular Gluc mRNA amounts increased 13-fold and 81-fold after 0.5 h and 1 h of light induction, with respect to samples not exposed to light (Fig. 2a ) followed by an increase in secreted Gluc protein ~1 h later (Fig. 2b ). Removal of light resulted in a slow decay in the amount of Gluc mRNA and a plateau in the amount of protein when we did not change the medium (Fig. 2a ,b ). Gluc expression depended on the duration of illumination, but a 30-min illumination was suf-ficient for ~25-fold induction of Gluc protein above background expression 10 h after initial illumination (Supplementary Fig. 6). Off expression kinetics of Gluc mRNA suggested that GAVPO was kept in the activated state with a half life of 2 h (Supplementary Fig. 7), which is similar to that of VVD (half life of ~18,000 s)16.GAVP VVD domain mutantsaW i l t y p e C 108N 56C 71N56K ,C7152383831171027652GAVPOGlucActinpGAVPO Light pU5-Gluc Size (kDa) e R e l a t i v e e x p r e s s i o n (%)f +++++––––––––––++++++MC F -7He pG 2MDA -MB -231P C -3dR e l a t i v e e x p r e s s i o n (%)figure | LightOn gene expression system. (a ) Schematic representation of the LightOn system. After light activation, GAVP homodimerizes, interactswith UASG elements (5xUASG) and initiates expression of the gene of interest. (b ) Electrophoretic mobility shift assay of binding between Gal4(65)-VVD (at indicated concentrations) and UASG DNA probe (125 nM)in the dark (left) or under 15 W m −2 constant blue light (right). (c ) Light- dependent activation of Fluc reporters based on GAVP with different mutations to enhance dimerization. (d ) Comparison of induction various reporters betweenthe LightOn system with GAVPO-driven genes and conventional vectors with CMV -driven genes. Fluc activity, hrGFP fluorescence and mCherry fluorescence in cell lysate were measured by chemiluminescence and fluorescence assay,respectively. Gluc activity in cell culture medium was measured by a chemiluminescence assay. The data in c and d were normalized to the expression levels of the same reporter protein expressed from vectors with CMV promotersin the dark. (e ) Western blot of the Gluc expression in HEK293 cells transiently transfected with pGAVPO and pU5-Gluc under light or dark conditions. (f ) Light-switchable Gluc expression from pGAVPO in different cell lines. The data were normalized to the expression of the same reporter protein expressed from the CMV promoter under light-on conditions. (c ,d ,f ) Error bars, mean ± s.e.m. (n = 4 samples) from the same experiment. Six (c ) or ten (d –f ) hours after transfection, cells were illuminated by 0.84 W m −2 blue light or remained in the dark for 22 h before measurements.Time (h)G l u c m R N A f o l d o f i n d u c t i o naTime (h)5.0 × 1071.0 × 1081.5 × 108bG l u c a c t i v i t y (R L U )Number of pulsesG l u c a c t i v i t y (R L U )4.0 × 108.0 × 101.2 × 101.6 × 10cG l u c a c t i v i t y (R L U )Pulse length (s)2 × 104 × 106 × 10dfigure | Time course of light-switchable gene expression using LightOn in HEK293 cells transiently transfected with pGAVPO and pU5-Gluc. (a ) Cellular Gluc mRNA level measured at indicated times in the dark, after illumination under continuous 0.84 W m −2 blue light or after illumination under 0.84 W m −2 blue light for 2 h and then in the dark (light-dark). (b ) Expression kinetics of the Gluc reporter in cell culture medium measured at indicated times in the dark, after illumination under continuous 0.84 W m −2 blue light or after illumination under blue light for 15 h and then in the dark (light-dark).Insets, kinetics of Gluc mRNA (a ) or protein activity (b ) during the 4 h or 3 h after the initial light exposure, respectively. (c ,d ) Gluc activity in medium, measured 4 h after the initial light exposure to blue-light pulses (c ; 10 s pulses, 22 W m −2, 8 min apart) or to a single blue-light pulse of varying duration (22 W m −2). RLU, relative luciferase units. Error bars, mean ± s.e.m. (n = 4 samples) from the same experiment.©2012 N a t u r e A m e r i c a , I n c . A l l r i g h t s r e s e r v e d .nature methods | ADVANCE ONLINE PUBLICATION | brief communicationsThis led to continued mRNA synthesis during the first few hours after turning the light off (Fig. 2a ). The estimated half life of Gluc mRNA was 10 h (Supplementary Fig. 7), which explained the continuous increase in the amount of Gluc in the medium after light was turned off for another 20 h (Fig. 2b ). To increase the off rate of the system we modified the 3′ untranslated region of the Gluc reporter gene by inserting the conserved AU-rich element (ARE) from the gene encoding GM-CSF, which medi-ates selective degradation of mRNA 17. Expression of Gluc-ARE stopped much earlier than did expression of the original Gluc gene (Supplementary Fig. 8). We also investigated the capacity to activate the LightOn system by short pulses of light and observed a strong dose dependence on the number of pulses and the dura-tion of a single pulse, showing that continuous illumination is unnecessary (Fig. 2c ,d ).We next tested the ability of the LightOn system to induce graded protein expression in cells by controlling the irradiance (Fig. 3 and Supplementary Figs. 9 and 10). To spatially control gene expression in cultured cells, we illuminated in a specific pat-tern HEK293 cells transfected with mCherry reporter and GA VPO . The mCherry fluorescence image of the cells had the pattern of the original image used as the mask (Supplementary Fig. 11).These data indicate that the LightOn system can be robustly used to quantitatively, spatially and temporally control gene expression in mammalian cells.Finally, we validated the LightOn system in vivo . We transferred GA VPO and mCherry reporter vector into the livers of mice using a hydrodynamic procedure. Exposure of the mice to blue light from below resulted in the appearance of marked fluorescence from mCherry protein in their livers (Fig. 4a ). Light-dependent transgene expression was limited to the anterior side and poste-rior lining of liver that received sufficient blue light irradiance, in contrast to controls transfected with pcDNA3.1 vector containing the mCherry gene driven by a CMV promoter that resulted in homogenous expression (Fig. 4a ). Light-induced expression of the mCherry gene in the liver was limited to 1 mm or less from the surface (Fig. 4b ). Spatial control of gene expression in the liver was possible with localized illumination using optical fibers (Supplementary Fig. 12).We then used the LightOn system for Cre recombinase–m ediated LacZ activation in Gt(ROSA)26Sor (ROSA26)-LacZ mice transfected with pGAVPO and pU5-Cre vectors. We observed LacZ expression in the liver after illumination with90 mW cm −2 blue light for 22 h and 48 h in the dark but not incontrol mice kept only in the dark (Fig. 4c ). This suggests that light-mediated, tissue-specific expression should be possible. As a very preliminary proof-of-principle demonstration of the poten-tial of our system for regulated gene or cell therapy, we transfected type I diabetic mice with pGAVPO and pU5-insulin vectors and observed that blue-light illumination caused a large drop of blood glucose compared to mice transfected with the vector encoding the nonfunctional GAVPO mutant (Fig. 4d ).An ideal regulated gene expression system should have low background expression, low toxicity, low interference with endogenous proteins or genes and the capacity for temporal and spatial control, and should be easy to manipulate. Most existing systems 3,5–11, however, do not simultaneously satisfy all of these above requirements (Supplementary Table 1). Approaches involv-ing caged activators 3,5 or heating effects 6 are hard to implementLight irradiance (W m –2)0.020.110.210.430.83figure | Graded response of mCherry expression under different blue-light irradiances. Ten hours after transfection of mCherry reporter andGAVPO vectors, cells were illuminated by blue light of indicated irradiances adjusted by neutral density filters for 22 h before determination.Fluorescence images are shown. Scale bar, 0.5 cm.aAnterior viewpcDNA3.1-mCherry; darkpU5-mCherry and pGAVPO; darkNo vector;darkpU5-mCherry and pGAVPO;blue lightFluorescenceFluorescencePosterior view bWhite lightcB l o o d g l u c o s e (m M )dAnterior viewPosterior viewDark LightWhite lightpcDNA3.1-mCherry;darkpU5-mCherry and pGAVPO;blue lightFluorescenceLightfigure 4 | Light-switchable transgene expression in mice. (a ,b ) Light induced mCherry transgene expression inwhole livers or kidneys (a ) or in cryosections (b ). Mice were transfected with no vector, pU5-mCherry andpGAVPO or pcDNA3.1-mCherry; then illuminated with 90 mW cm −2 blue light for 22 h or remained in the dark. Mice were then killed, and their livers and kidneys were dissected for mCherry fluorescence imaging. Scale bar, 1 cm (a ) and 0.5 mm (b ). (c ) Images of whole-mount X-gal staining of the lacZ expression in livers of ROSA26-LacZ reporter mice transfected with pGAVPO and pU5-Cre. Mice were illuminated with 90 mW cm −2 blue light for 22 h and then kept in the dark for another 48 h before measurements. Control mice receivedno light. Scale bar, 0.5 cm. (d ) Diabetic mice induced by streptozotocin were transfected with pU5-insulin together with pGAVPO or pGAVPO(C108S), which encodes the nonfunctional mutant. Mice were illuminatedwith 90 mW cm −2 blue light or kept in dark for 8 h. Glucose levels were measured after the mice rested in the dark for another 4 h with sufficient food. Error bars, s.e.m. (n = 8–10) from two independent experiments; statistics by two-tailed t test. *P < 0.04 versus ‘dark’ control; **P < 0.0002 versus ‘dark’ control.©2012 N a t u r e A m e r i c a , I n c . A l l r i g h t s r e s e r v e d .4 | ADVANCE ONLINE PUBLICATION | nature methodsbrief communicationsand manipulate, and are associated with potential problems of cell injury or side effects resulting from the UV-light irradiance or heat shock used to activate gene expression. The LightOn system reported here is based on a genetically encoded light sensor that uses FAD as a photon acceptor 13 and offers obvious advantages compared to the above techniques. As FAD naturally exists in cells, it is unnecessary to treat cells with extraneous ligands that are required by phytochrome 7 or caged activators 3,5. The single- chain 56-kDa genetically encoded light-switchable transactivator in the LightOn system, which operated through homodimeriza-tion, additionally reduced the complexity of the multicomponent gene expression methodologies based on two-hybrid technologies previously reported for yeast 7,10 or mammalian cells 9. Recently, a well-designed synthetic light-regulated circuit has been reported to regulate gene expression in transgenic cells and blood-glucose homeostasis in mice 11. However, as this technique is based on coupling an exogenously expressed blue light–induced melan-opsin receptor to major existing cellular signaling players such as phospholipase, phosphokinase and calcium, it suffers from low on/off ratio of gene expression and mutual interference with endogenous signaling events that may limit its usage. In contrast, the LightOn system is orthogonal to mammalian cellular signal-ing, which should allow tighter control with minimal perturba-tion of, or from, existing signaling pathways.There are many other advantages of the LightOn gene expres-sion system reported here. LightOn has low background and allows high induction with reasonably fast kinetics and revers-ibility. We showed that continuous illumination was not necessary to activate LightOn, and single brief pulses of light were sufficient. This was possible owing to the high induction level and low back-ground we observed. Because of the unusually stable photoacti-vated state of VVD 16, the LightOn system is extremely sensitive to light, thus minimizing any potential toxicity of blue-light irradi-ance on cells. We observed a fourfold increase in Fluc expression when we irradiated cells with blue light five orders of magnitude lower than the sun’s irradiance. These characteristics provide the capability for gene activation with good spatial, temporal and quantitative control in an easy-to-use and robust system. LightOn should be a powerful yet convenient tool for life science research, allowing spatial and temporal control of gene expression.In the past three years, optogenetics has become a booming field by using genetically encoded light-sensitive proteins to control the behavior of living cells and organisms 18,19. Most of these tools are based on light-gated ion channels, light-switchable enzymes or protein interactions. The LightOn system provides another general way to control biological processes using light-switchable gene expression, thus avoiding the need for case-by-case protein engineering to create light-regulated protein modules. In addi-tion to its use in mammals, the LightOn gene expression system could be used to control gene expression spatiotemporally in other model eukaryotes such as Danio rerio and Drosophilam elanogaster , in which Gal-UAS systems are already widely used to control cell type–specific gene expression. We anticipate thatthe LightOn system will be widely used in many fields of life sci-ence research and biotechnology that have great demand for high- resolution spatial and temporal control of gene expression.methodsMethods and any associated references are available in the online version of the paper at /naturemethods/.Note: Supplementary information is available on the Nature Methods website.acknoWledgmentsWe thank Z.H. Yu and J.Z. Chen for their suggestions, and Z.M. Du, Z.C. Ma, J.H. Wang, W.T. Zhu, X.Y. Feng and Y.Z. Zhao for technical assistance. This work was supported by the National Natural Science Foundation of China (grants 31170815, 31071260 and 90713026), the 863 Program (grant no. 2006AA02Z160), the Fok Ying Tung Education Foundation (grant 111022), the Program for Professor of Special Appointment (Eastern Scholar) at Shanghai Institutions of Higher Learning, Dawn Program of Shanghai EducationCommission (grant 11SG31), Doctoral Fund of Ministry of Education of China (grant 20100074110010), the Fundamental Research Funds for the Central Universities and the 111 Project (grant B07023).author contributionsY.Y. conceived of the concept; Y.Y., X.W. and X.C. designed the experiments and analysed the data; X.W. preformed the molecular cloning, proteincharacterization and cell culture experiments; X.C. preformed animal studies; and Y.Y. wrote the manuscript.comPeting financial interestsThe authors declare no competing financial interests.Published online at /naturemethods/. reprints and permissions information is available online at /reprints/index.html.1. Braselmann, S., Graninger, P. & Busslinger, M. Proc. Natl. Acad. Sci. USA 90,1657–1661 (1993).2. Gossen, M. et al. Science 68, 1766–1769 (1995).3. Cambridge, S.B., Davis, R.L. & Minden, J.S. Science 77, 825–828(1997).4. Minden, J., Namba, R., Mergliano, J. & Cambridge, S. Sci. STKE 000, l1(2000).5. Cambridge, S.B. et al. Nat. Methods 6, 527–531 (2009).6. Kamei, Y. et al. Nat. Methods 6, 79–81 (2009).7. Shimizu-Sato, S., Huq, E., Tepperman, J.M. & Quail, P.H. Nat. Biotechnol. 0,1041–1044 (2002).8. Levskaya, A. et al. Nature 4 8, 441–442 (2005).9. Yazawa, M., Sadaghiani, A.M., Hsueh, B. & Dolmetsch, R.E. Nat. Biotechnol. 7,941–945 (2009).10. Kennedy, M.J. et al. Nat. Methods 7, 973–975 (2010).11. Ye, H., Daoud-El Baba, M., Peng, R.W. & Fussenegger, M. Science ,1565–1568 (2011).12. Hong, M. et al. Structure 6, 1019–1026 (2008).13. Zoltowski, B.D. et al. Science 6, 1054–1057 (2007).14. Zoltowski, B.D. & Crane, B.R. Biochemistry 47, 7012–7019 (2008).15. Lamb, J.S., Zoltowski, B.D., Pabit, S.A., Crane, B.R. & Pollack, L.J. Am. Chem. Soc. 0, 12226–12227 (2008).16. Zoltowski, B.D., Vaccaro, B. & Crane, B.R. Nat. Chem. Biol. 5, 827–834 (2009).17. Shaw, G. & Kamen, R. Cell 46, 659–667 (1986).18. Deisseroth, K. Nat. Methods 8, 26–29 (2011).19. Fenno, L., Yizhar, O. & Deisseroth, K. Annu. Rev. Neurosci. 4, 389–412(2011).©2012 N a t u r e A m e r i c a , I n c . A l l r i g h t s r e s e r v e d .nature methodsdoi:10.1038/nmeth.1892online methodsDNA cloning. Full length VVD gene was isolated from Neurospora crassa (gift of B. Chen, Guangxi Normal University) genomic DNA with both introns and exons. Introns were removed by reverse PCR. Sequences encoding the Gal4(1–65), and VP16 acti-vation domain was amplified from pBIND and pACT (Promega), respectively. Chimeric fusion construct pGAVV consisting of sequences encoding Gal4(1–65), VVD (37–186) and VP16 acti-vation domain was generated using overlapping PCR and inserted into Eco47III and BsrGI sites in pEGFP-N1 vector. To generate chimeric fusion construct pGAVP , sequence encoding VP16 acti-vation domain of pGAVV was replaced with sequence encoding p65 activation domain residues 286–550, which was isolated from HEK293 cDNA by EcoRI and BsrGI. Site-directed mutagenesis, to generate sequences encoding VVD proteins with mutations C71V , N56K and C108S, was performed on sequence encoding the VVD domain according to the MutanBEST protocol (Takara). The reporter vector pU5-Gluc was generated by overlapping poly(A)–5×UASG -TATA sequence from pG5luc (Promega) and secreted Gluc sequence from pGLuc-basic (NEB), and subsequent ligation into NruI and BamHI sites of pcDNA3.1/Hygro(+) using CloneEZ PCR Cloning kit (Genescript), thereby replacing CMV promoter in pcDNA3.1/Hygro(+) (Invitrogen). The 2×Flag tag was added to C-terminal end of Gluc (added into the gene using BamHI and XbaI) for convenient immunoassay detection. Other reporter vectors including pU5-hrGFP , pU5-Fluc, pU5-mCherry and pU5-Insulin were generated by substituting Gluc with genes encoding humanized recombinant (hr)GFP , Fluc, mCherry and a minimal human proinsulin, respectively. Plasmid pU5-Gluc-ARE was constructed by inserting the ARE of the sequence encoding GM-CSF into 3′ untranslated region of Gluc . A furin consensus cleavage sequence was introduced to the minimal human proin-sulin gene, allowing the translational product to be constitutively processed and secreted in liver cells 20. Genes encoding hrGFP , Fluc, mCherry and insulin were introduced into HindIII and BamHI site of pcDNA3.1/Hygro(+) and Gluc was cloned into pcDNA3.1/V5-His-TOPO (Invitrogen) to obtain CMV promoter–driven genes in expression vectors. To obtain the pU5-Cre vector, the multiple cloning site of pU5-Gluc was replaced, and Cre was introduced into HindIII-Eco47III site of the new vector by sub-stituting Gluc . To construct Escherichia coli expression vector, sequence encoding Gal4(65)-VVD was amplified from pGAVP and inserted into pET-28a(+) using CloneEZ PCR Cloning kit.Protein expression and purification. Gal4(65)-VVD was expressed in E. coli strain JM109 at 18 °C for 24 h under con-stant light in the presence of 0.4 mM IPTG, 10 µM ZnCl 2 and 5 µM FAD. The cell pellet was collected by centrifugation and sonicated in buffer A containing 20 mM Hepes, 0.5 M NaCl, 10 µM ZnCl 2, 20 mM imidazole, 10 mM β-mercaptoethanol and 10% glycerol, pH 7.5. The soluble cell lysate was fractionated by centrifugation. The supernatant was passed over a HisTrap FF column (GE Healthcare) and then washed thoroughly in buffer B containing 20 mM Hepes, 0.5 M NaCl, 50 µM ZnCl 2, 300 mM imidazole, 10 mM β-mercaptoethanol and 10% glycerol, pH 7.5. Proteins were desalted in 20 mM Hepes, 0.15 M NaCl, 20 µM ZnCl 2 and 10% glycerol, pH 7.5, using a HisTrap desalting column (GE Healthcare). After purification, Gal4(65)-VVD was stored at 4 °C and protected from light for recovery in the dark.Electrophoretic mobility shift assay. The probes used were as follows: 5′-TCTTCGGAGGGCTGTCACCCGAATATA-3′ and 5′-ACCGGAGGACAGTCCTCCGG-3′12. All samples containing VVD-derived proteins were prepared under red LED safe light. The DNA was annealed and diluted in 20 mM Hepes and 50 mM NaCl, pH 7.5 (renaturation buffer), to a final reaction DNA duplex concentration of 125 nM. Protein was diluted in renaturation buffer containing 100 µg ml −1 BSA (Jackson ImmunoResearch) by twofold serial dilution from 5.6 µM to 0.34 µM protein in dim red light. Protein and DNA were equilibrated at room tempera-ture (20–25 °C) for 30 min in reaction buffer with an additional5% (w/v) Ficoll either in the dark or with 15 W m −2 constant bluelight. After incubation, the dark and light irradiated samples were separately loaded onto different 6% native polyacrylamide gels in 0.5× Tris-borate buffer and were run at 100 V at 4 °C in the dark or with 15 W m −2 blue-light irradiance, respectively. After electrophoresis, the gel was stained with GelRed nucleic acid gel stain (Biotium) before fluorescence imaging using the In-Vivo Multispectral System FX (Kodak) with 530 nm excitation and 600 nm emission filters. Images of full-length gels from Figure 1b are available in Supplementary Figure 14.Cell culture and blue light irradiation. HEK293, HepG2, MDA-MB-231, MCF7 and PC-3 cells were maintained in high-glucose DMEM (HyClone) supplemented with 10% FBS, penicillin and streptomycin (Invitrogen). Cells were plated in phenol red–free, antibiotic-free high glucose DMEM supplemented with 10% FBS 16 h before transfection. We typically used equal amounts (0.4 µg each) of the light-switchable transactivator and reporter constructs with 2.4 µl Lipofectamine 2000 (Invitrogen) for each well of a 12-well plate according to the manufacturer’s protocol. To estimate the transcription efficiency of the LightOn system, equal amounts of CMV promoter–driven reporter constructs were used to trans-fect the cells as a control. Unless indicated, the transfected cells were kept in the dark for 10 h, and then they were illuminated by0.84 W m –2 (average irradiance) blue light from an LED lamp(460 nm peak) from below or remained in the dark for 22 h before characterization. The LED lamps were controlled with a timer to adjust the overall dose of blue light illumination during the speci-fied period (Supplementary Fig. 13a ). Neutral density filters were used to adjust the light irradiance. To spatially control gene expres-sion in cultured mammalian cells, single layers of HEK293 cells cultured on glass bottom dishes were transiently transfected with an mCherry reporter and the GA VPO transactivator, and then, the cells were illuminated with a spatial pattern using a photomask printed with a specific image for 24 h. LightOn system is sensi-tive to ambient light. One minute exposure to 0.16 W m −2 white fluorescent lamp light lead to substantial induction of gene expres-sion, whereas there was minimal gene induction when cells were illuminated with 630 nm red LED light. In this study, experiment procedures after cell transfection were carried out under red LED light, and cells were cultured inside dedicated CO 2 incubators.Animal experiments. All procedures involving animals were approved by the Institutional Animal Care and Use Committee of Shanghai and were conducted in accordance with the National Research Council Guide for Care and Use of Laboratory Animals. Unless otherwise mentioned, 10 µg of pGAVPO and 300 µg of pU5 vector carrying target gene were transferred into mice by。
靶向人多药耐药基因mrp1特异性小分子干扰RNA有效序列筛选_王新平
?论著??基础研究?靶向人多药耐药基因mrp1特异性小分子干扰RNA有效序列筛选王新平1,韩雷2,李德华2,赵兰英2,苟兴华2,潘光栋3,夏冬3,刘江文3,严茂林3,严律南3S creening effective sequences of small interferingRNA s targeting mrp1gene in human HepG2/mrp1cellsWang Xinping1,Han Lei2,Li Dehua2,Zhao Lanying2,Gou Xinghua2,Pan Guangdong3,Xia Dong3,Liu Jiangwen3,Yan Maolin3,Yan Lvnan31Department of General Surgery,Xi'a n Fourth Hospital,Shaanxi Xi'a n710004,China;2Institute of Gene Project,Chengdu DIAO Pharma-ceutical Group Co.Ltd,Sichuan Shengdu610041,China;3Department of General Surgery,West China Hospital,Sichuan University,Sichuan Chengdu610041,China.【Abstract】Objective:To screen effective sequences of small interferingRNA targeting human multidrug associat-ed-protein gene(mrp1).Methods:Four siRNAs(mrp1-si251,mrp1-si480,mrp1-si795,mrp1-si1016)targe-ting mrp1genes were designed and synthesized by in vitro transcription.The siRNA duplexes were used to transfectedinto the human hepatocellular carcinoma HepG2/mrp1cells,which transfected with human mrp1gene and obtainedMDRphenomenon.The expression level of mrp1mRNA was detected byRT-PCR.The multidru resistance-associ-ated protein and accumulation of intracellular daunorubicin(DNR)were examined by flow cytometry,respectively.Thecell sensitivity to adriamycin(ADM)was demonstrated by MTT.Results:The HepG2/mrp1cells treated with4siR-NAs led to reversal effectively on multidrug resistance to different extents.Among the HepG2/mrp1cells treated bysiRNAs for72h,the expression level of mrp1mRNA in cells of mrp1-si1016or mrp1-si795groups[(85.54ʃ1.04)%or(86.36ʃ2.26)%]was more decreased than that in cells of mrp1-si251or mrp1-si480groups(P<0.05).The accumulation of DNRin cells of mrp1-si795group was the most.In cells of mrp1-si1016group,more,in cells of mrp1-si480group,lower,and in cells of mrp1-si251group,the lowest(P<0.05).The rel-ative reversal efficiency of cells of mrp1-si1016and mrp1-si795groups to ADRwas higher than in the cells ofmrp1-si251and mrp1-si480groups significantly(P<0.05).The expression level of multidrug resistance-associ-ated protein in cells of mrp1-si1016and mrp1-si795groups was lowest among the HepG2/mrp1cells treated bysiRNAs for72h.Conclusion:The mrp1-si795with most,mrp1-si1016with more,mrp1-si480with less and mrp1-si251with least reversal effects on mrp1gene mediated multidrug resistance were found in the human hepatocellularcarcinoma HepG2/mrp1cells.【Key words】small interferingRNA;mrp1gene;HepG2cells;MDR;multidrug resistance-associated proteinModern Oncology2015,23(07):0881-0885【摘要】目的:筛选靶向人多药耐药相关蛋白基因(mrp1)特异性小分子干扰RNA(siRNA)的有效序列。
表观遗传学与基因组印记模板

研究背景
• 经典的孟德尔遗传理论的一个基本 假设是在二倍体生物的基因组中, 一个等 位基因无论来自父方还是母方, 其遗传性 质和表型特征是相同的, 即在同一位点的 等位基因中父方基因与母方基因的作用 是无区别的, 认为双亲的性状具有等同的 遗传性, 而且可以预测遗传性状在后代中 的分离。
然而有些种间杂交后代的性状表现 与此理论不符
CH3 CH3
X Gene A
Gene B
B
Paternal
[
]
Maternal deletion
Maternal
[
A
Paternal
Gene A
CH3 CH3
X
]
Gene B
Prader-Willi
Angelman
These two very different syndromes are caused by the same deletion
基因组印记 Genomic Imprinting
经典的遗传方式及发展:
1.孟德尔式遗传(细胞核遗传)
染色体遗传 2.非孟德尔式遗传(细胞质遗传)
非染色体遗传 3.印记遗传 母系遗传
1. 按照孟德尔遗传定律,来自父母双方的基 因组在功能上是相同的。
2. 与此相矛盾的是,在哺乳动物中发现基因 组印记(genomic imprinting)的现象,并因 此建立了核不等价(nuclear non-equivalency) 理论。
概念:基因组印记
• 基因组印记是指二倍体细胞中的父母亲特异的基因 表达。 • Describes the differential expression of genetic material at chromosomal/allelic level, depending on that material being maternal or paternal in origin. • 两个等位基因中只有一个基因表达;可遗传的修饰, 并且不改变基因序列的组成 • Genomic imprinting is an epigenetic process that marks DNA in a sex dependent manner, resulting in the differential expression of a gene depending on its parent of origin.
非小细胞肺癌患者病理组织中MTH1的表达和临床意义的研究
著·
国际呼吸杂志 2019 年 9 月第 39 卷第 18 期 I
n
tJRe
sp
i
r,
Sep
t
embe
r2019,
Vo
l.
39,
No.
18· 1367 ·nodeinf
i
l
t
r
a
t
i
on andva
s
cu
l
a
ri
nva
s
i
onhads
t
a
t
i
s
t
i
c
a
ld
i
f
f
e
r
enc
e
sbe
twe
en MTH1h
i
r
e
s
s
i
oni
nNSCLCshow
gh MTH1exp
h
i
rma
l
i
tcha
r
a
c
t
e
r
i
s
t
i
c
sandt
he
i
rsu
r
v
i
va
lr
a
t
ei
sl
owe
rt
hanpa
t
i
en
t
swi
t
hl
owexp
r
e
s
s
i
ono
f
ghe
gnan
MTH1
【
Ke
r
d
s】 Ca
r
c
i
noma non
MT1-MMP和TIMP-2在非小细胞肺癌中的表达及与病理特征的相关性

典型 的细胞外基质 降解酶 , 将 II、 I 胶原 降解 为典型 可 、 I型 II 的 14和 34片 断 , / / 同时 , T M 1一MM P还可 以降解 其他 细胞
ep es n e en MT x rs o sb t e 1一MM n I i w P a dT MP一2w r pee t e a v orl in r 一0 6 5 P<0 0 ) o - ee rsne n g t ec r a o ( = d i et .3 , . 5 .C n
cu i n:T e e p e so f l so h x r si n o 1一MMP a d T MP 一2 ma k a t n te p o r s f C C a d i x e td t e MT n I y t ep r i h r ge so a NS L n se p c e o b — c me t e i d x o r g o i fl n a c rme a t s . o h n e f o n sso g c n e t sa i p u s
( oK21A6 N . J00 16)
【 作者单 位】 安徽 医科大学附属第一 医院肿瘤 内科 , 安徽
2 o 01 3o
合肥
治疗 。男 6 例 , 1 ; 龄平均 5 1 女 9例 年 9岁 。腺 癌 4 0例 鳞癌
4 O例。T M 分期 ( 9 7 : I期 2 N 19 ) 4例 , Ⅱ期 3 8例 , Ⅲ期 1 8
Mo en O clg 0 2,0 0 :2 3—0 9 d r n oo 2 1 2 ( 2) 0 9 y 26
【 要】 目的 : 摘 研究 N C C中 M 1 M P及 TM 一 SL T一 M I P 2的表达及 与病理类型分型 、 巴结转 移和 T M分 期关 淋 N
英文log表达是什么中文意思(完整文档)
英文log表达是什么中文意思(完整文档)英文log表达的是什么中文意思1名词日志;记录;原木动词伐木;把…载入正式记录;行驶1.原木:(1)原木(log)是指伐倒并除去树皮、树枝和树梢的树干.(2)锯材(sawnlumber)是指由原木锯制而成的任何尺寸的`成品材或半成品材.锯材又分方木(squaretimber)、板材(plank)和规格材(dimensionlumber).2.系统日志:在构架设计过程中,设计师(Architect)必须完成对技术和运行*台的选取,整个项目的基础框架(Framework)的设计,完成对公共组件的设计,如审计(Auditing)系统,日志(Log)系统,错误处理(ExceptionHandling)系统,安全(Security)系统等.3.日志文件:7.日志文件(Log)AE在渲染的同时可以生成一个文本范式(TXT)的日志文件,该文件可以记载渲染纰缪的缘故原由及其它信息,咱们可以在渲染信息窗户入眼到生存该文件的路径信息.4.log:logistics;后勤支持5.log:logbook;通信记录簿6.log:laplacianofgaussianoperator;log算子7.log:laplacianofgaussian;高斯调和量算子英文log表达的是什么中文意思扩展阅读英文log表达的是什么中文意思(扩展1)——英文log表达的中文意思是什么(菁选2篇)英文log表达的中文意思是什么1名词日志;记录;原木动词伐木;把…载入正式记录;行驶1.原木:(1)原木(log)是指伐倒并除去树皮、树枝和树梢的树干.(2)锯材(sawnlumber)是指由原木锯制而成的任何尺寸的成品材或半成品材.锯材又分方木(squaretimber)、板材(plank)和规格材(dimensionlumber).2.系统日志:在构架设计过程中,设计师(Architect)必须完成对技术和运行*台的选取,整个项目的基础框架(Framework)的设计,完成对公共组件的设计,如审计(Auditing)系统,日志(Log)系统,错误处理(ExceptionHandling)系统,安全(Security)系统等.3.日志文件:7.日志文件(Log)AE在渲染的同时可以生成一个文本范式(TXT)的日志文件,该文件可以记载渲染纰缪的缘故原由及其它信息,咱们可以在渲染信息窗户入眼到生存该文件的路径信息.4.log:logistics;后勤支持5.log:logbook;通信记录簿6.log:laplacianofgaussianoperator;log算子7.log:laplacianofgaussian;高斯调和量算子英文log表达的中文意思是什么21.原木;圆材;干材Alogisapieceofathickbranchorofthetrunkofatreethathasbeencutsothatitcanbeusedforfuel orformakingthings.e.g.Hedumpedthelogsonthebigstonehearth.他将一根根短棍木柴扔进巨大的石壁炉里。
PRMT5在癌症中的研究进展
中国细胞生物学学报Chinese Journal of Cell Biology 2021, 43(3): 662-674DOI: 10.11844/cjcb.2021.03.0021PRMT5在癌症中的研究进展何伶靖#邹成'贺琴菊冯宇晴张定校#(湖南大学生物学院,分子医学与肿瘤学研宄所,长沙410082)摘要 蛋白质精氣酸甲基转移酶(protein arginine methyltransferases,P R M T s)是真核生物中常见的一种酶,可催化组蛋白和非组蛋白底物中的精氨酸残基发生曱基化。
在人类的基因组中,P R M T s由9个基因编码。
作为最主要的II型精氨酸曱基转移酶,P R M T5是P R M T家族成员之一,参与了包括信号转导、转录调控、R N A剪切及D N A损伤修复在内的多种生物学过程;在多种人类恶性 肿瘤中表达上调,发挥着类似致癌基因的作用。
该文对P R M T5在多种癌症中的研究进展进行综述,并对现有的P R M T5小分子抑制剂进行总结(包括其结构和潜在的癌症靶向治疗应用前景)。
关键词癌症;蛋白质精氨酸甲基转移酶;P R M T5;基因表达调控;小分子靶向治疗Recent Advances of PRMT5 in CancerH E Lingjing*1,Z O U C h e n g#,H E Qinju,F E N G Yuqing,Z H A N G Dingxiao*(Center o f Tumorigenesis and Molecular Medicine, College o f B iology, Hunan University, Changsha 410082, China)Abstract Protein arginine methylation i s one of the most abundant and evolutionarily conserved post-translational modifications catalyzed by the P R M T s(protein arginine methyltransferases).P R M T s,encoded by nine genes in the h u m a n g e n o m e,can methylate histone and nonhistone proteins.A s the main type I I arginine methyltransferase,P R M T5 has been implicated in the control of m a n y cellular processes such as cell cycle progression,signal transduction,gene expression regulation,R N A splicing and D N A-d a m a g e response.Overexpression of P R M T5 is frequently found in numerous h u m a n cancers with evidence indicative of an oncogene-like function. Here,an update on the recent advances of P R M T5 in cancer research i s provided and the promise of targeting P R M T S by small molecular inhibitors i s discussed for treating aggressive h u m a n cancers.K e y w o r d s cancer;protein arginine methyltransferases;P R M T5;gene expression regulation;targeted cancer therapy with small molecules癌症是由于细胞恶性増殖、迁移和侵袭引发的 一类疾病,是导致人类死亡的第二大因素。
人视网膜色素上皮细胞特异性吞噬过程中MERTK基因表达的变化
人视网膜色素上皮细胞特异性吞噬过程中MERTK基因表达的变化孙昱昭,洪晶中国医科大学附属一院眼科,沈阳(110001)E-mail:hongjing64@摘要:目的通过检测人视网膜色素上皮细胞(human retinal pigment epithelium, hRPE)吞噬视细胞外节(rod outer segment,ROS)过程中MERTK 基因表达的变化,明确MERTK 基因在hRPE的吞噬功能中所起的作用。
方法用1×10⁷个/ml ROS于37℃孵育体外培养的正常hRPE细胞,在孵育的不同时间终止吞噬反应。
用双重荧光标记法检测hRPE细胞吞噬动力学。
用RT-PCR方法检测MERTK基因 mRNA水平的变化。
结果hRPE细胞与ROS孵育过程中,ROS结合于hRPE细胞表面发生在15 min时,hRPE细胞吞噬ROS在24h时达到饱和。
MERTK基因在hRPE细胞与ROS短时(5min-90min)及长时(3h-24h)孵育过程中均呈现出高表达的状态。
结论MERTK基因的高表达对HRPE吞噬ROS过程的维持致关重要。
MERTK基因作为上游调控信号参与hRPE细胞吞噬功能的调节。
关键词: 视网膜色素上皮细胞;吞噬;MERTK基因0 前言随着人类基因组的逐渐破译,许多疾病的致病基因不断被发现。
眼科疾病的基因研究也取得了重大进展,发现了40余个与视网膜色素变性相关的致病基因,并有26个基因被定位、克隆。
其中与常染色体显性遗传性视网膜色素变性相关的基因有RHO,RDS,RP1等8个,与常染色体隐性遗传性视网膜色素变性相关的基因有RPE65,ABCR,CRB1,USH2A等,与性连锁遗传性视网膜色素变性相关的基因有RP2,RP3,而ROM1和RDS基因则与双基因视网膜色素变性相关(1,2)。
同时,在以RCS鼠为研究对象的实验研究中, D'Cruz等惊喜地发现了引起研究RCS 鼠吞噬缺陷的原因在于Mertk基因的DNA缺失导致密码20后翻译信号终止、错误转录出一个异常无功能的Mertk蛋白(3)。
MTA1通过HIF-1α上调MTDH基因表达促进肺癌细胞增殖与活力
㊃论 著㊃ d o i :10.3969/j.i s s n .1671-8348.2021.09.003网络首发 h t t ps ://k n s .c n k i .n e t /k c m s /d e t a i l /50.1097.R.20201210.1314.011.h t m l (2020-12-11)MT A 1通过H I F -1α上调MT D H 基因表达促进肺癌细胞增殖与活力*杨淑慧1,周 琳2,李银珍1,廖罗飞1,谭彩云1,丁 宇1,杜日昌1(汕头大学医学院附属粤北人民医院:1.病理科;2.胸外科,广东韶关512025) [摘要] 目的 探讨异黏蛋白(MT D H )和转移相关蛋白1(MT A 1)在肺癌中的表达相关性及调控机制㊂方法 通过免疫组织化学㊁实时荧光定量P C R ㊁W e s t e r n b l o t 检测50份肺癌标本肿瘤组织与癌旁组织中MT -D H ㊁MT A 1的表达水平并分析二者的相关性㊂构建MT A 1基因过表达及干涉载体,转染A 549㊁S B C -5细胞,检测其对MT D H 表达及细胞活力的影响㊂富集乙酰化蛋白后,检测MT A 1对MT D H 乙酰化水平的影响,进一步分析MT A 1对MT D H 的调控机制㊂结果 肺癌组织中MT A 1㊁MT D H 蛋白及m R N A 表达水平均明显高于癌旁组织,二者表达呈正相关(r 2=0.8093㊁0.7741㊁0.5519)㊂过表达MT A 1上调MT D H ㊁增殖细胞核抗原(P C N A )蛋白的表达(P <0.05),增加肿瘤细胞的活力;而抑制MT A 1则下调MT D H ㊁P C N A 蛋白表达(P <0.05),抑制肿瘤细胞活力㊂MT A 1不通过调控乙酰化修饰上调MT D H 的表达(P >0.05)㊂过表达MT A 1可同时上调MT D H 和缺氧诱导因子-1α(H I F -1α)的表达(P <0.05),给予H I F -1α抑制剂C A Y 10585后,MT D H 的表达水平被抑制㊂结论 MT A 1和MT D H 在肺癌中高表达并呈正相关㊂MT A 1通过上调H I F -1α间接促进MT D H 表达㊂[关键词] 肺肿瘤;异黏蛋白;转移相关蛋白1;乙酰化;缺氧诱导因子-1α[中图法分类号] R 734.2[文献标识码] A [文章编号] 1671-8348(2021)09-1451-05M T A 1p r o m o t e s p r o l i f e r a t i o n a n d v i a b i l i t y i n l u n g ca n c e r c e l l s v i a u p -r e g u l a t i n g M T D H g e n e e x p r e s s i o nb y HI F -1α*Y A N G S h u h u i 1,Z H O U L i n 2,L I Y i n z h e n 1,L I A O L u o f e i 1,T A N C a i y u n 1,D I N G Y u 1,D U R i c h a n g 1(1.D e p a r t m e n t o f P a t h o l o g y ;2.D e p a r t m e n t o f T h o r a c i c S u r g e r y ,A f f i l i a t e d N o r t h G u a n g d o n g P e o p l e 's H o s p i t a l ,M e d i c a l C o l l e g e o f S h a n t o u U n i v e r s i t y ,S h a o g u a n ,G u a n g d o n g 512025,C h i n a ) [A b s t r a c t ] O b je c t i v e T o i n v e s t i g a t e t h e e x p r e s s i o n c o r r e l a t i o n a n d r e g u l a t o r y m e c h a n i s m of m a t a d e r i n (MT D H )a n d m e t a s t a s i s a s s o c i a t e d p r o t e i n 1(MT A 1)i n l u ng c a n c e r .M e th o d s T h e e x p r e s si o n l e v e l s o f MT D H a n d MT A 1i n t u m o r t i s s u e s a n d p a r a c a n c e r o u s t i s s u e s o f 50l u n g c a n c e r s a m p l e s w e r e d e t e c t e d b yt h e i mm u m o h i s t o c h e m i s t r y ,r e a l -t i m e f l u o r e s c e n c e q u a n t i t a t i v e P C R a n d W e s t e r n b l o t .S u b s e q u e n t l y,t h e c o r r e l a -t i o n b e t w e e n MT D H a n d MT A 1e x p r e s s i o n w a s a n a l y z e d .T h e o v e r e x pr e s s i o n a n d i n t e r f e r e n c e v e c t o r s o f MT A 1g e n e w e r e c o n s t r u c t e d a n d t r a n s f e c t e d i n t o A 549a n d S B C -5c e l l s ,t h e i r e f f e c t s o n MT D H e x pr e s s i o n a n d c e l l v i a b i l i t y w e r e d e t e c t e d .A f t e r e n r i c h i n g a c e t y l a t e d p r o t e i n ,t h e e f f e c t o f MT A 1o n t h e a c e t yl a t e d l e v e l o f MT D H w a s d e t e c t e d ,a n d t h e r e g u l a t o r y m e c h a n i s m o f MT A 1o n MT D H w a s f u r t h e r a n a l yz e d .R e s u l t s T h e r e l a t i v e e x p r e s s i o n l e v e l s o f p r o t e i n a n d m R N A o f MT A 1a n d MT D H i n l u n g ca n c e r t i s s u e s w e r e s i g n i f i c a n t l y h i g h e r t h a n t h o s e i n p a r a c a n c e r o u s t i s s u e s ,a n d t h e i r e x pr e s s i o n s s h o w e d t h e p o s i t i v e c o r r e -l a t i o n (r 2=0.8093,0.7741,0.5519).T h e MT A 1o v e r e x p r e s s i o n u p -r e g u l a t e d t h e MT D H a n d p r o l i f e r a t i n gn u c l e a r a n t i g e n (P C N A )e x p r e s s i o n (P <0.05)a n d i n c r e a s e d t h e v i a b i l i t y o f t u m o r c e l l s ;w h i l e i n h i b i t i n gMT A 1d o w n -r e g u l a t e d t h e MT D H a n d P C N A e x p r e s s i o n (P <0.05)a n d i n h i b i t e d t h e t u m o r c e l l v i a b i l i t y .MT A 1d i d n o t u p -r e g u l a t e t h e MT D H e x p r e s s i o n b y r e g u l a t i n g t h e a c e t y l a t i o n m o d i f i c a t i o n (P >0.05).T h e MT A 1o v e r e x p r e s s i o n c o u l d s i m u l t a n e o u s l y u p -r e g u l a t e t h e e x p r e s s i o n l e v e l s o f MT D H a n d h y po x i a -i n d u c i b l e f a c t o r 1α(H I F -1α)(P <0.05)a n d a f t e r g i v i n g H I F -1αi n h i b i t o r C A Y 10585,t h e MT D H e x pr e s s i o n l e v e l w a s i n h i b i t e d .C o n c l u s i o n MT A 1a n d MT D H a r e h i g h l y e x p r e s s e d i n l u n g c a n c e r a n d s h o w t h e p o s i t i v e c o r r e l a -t i o n .MT A 1i n d i r e c t l y p r o m o t e s t h e e x p r e s s i o n o f MT D H b y u p -r e g u l a t i n g HI F -1α.[K e y w o r d s ] l u n g n e o p l a s m s ;m a t a d e r i n ;m e t a s t a s i s a s s o c i a t e d p r o t e i n 1;a c e t y l a t i o n ;h y p o x i a -i n d u c i b l e f a c t o r 1α1541重庆医学2021年第50卷第9期*基金项目:2019年广东省韶关市卫生计生科研计划项目(Y 19038);广东省医学科学技术研究基金项目(B 2019221)㊂ 作者简介:杨淑慧(1985-),主治医师,硕士,主要从事肿瘤发病机制及分子靶向治疗方面的研究㊂肿瘤转移相关蛋白1(MT A1)在肿瘤增殖㊁转移和侵袭等方面发挥重要的调控作用,被视为肿瘤发生㊁发展过程中的关键分子,其主要作用机制是通过募集组蛋白去乙酰化酶复合物于靶基因的启动子序列进行转录水平的调控[1]㊂而最早发现于乳腺癌患者的异黏蛋白(MT D H),又名星形胶质细胞上调基因1(A E G-1),也与肿瘤发生㊁侵袭㊁转移关系密切,并在乳腺癌㊁肝癌㊁前列腺癌等肿瘤中呈现高表达,MT D H 表达水平与肿瘤病理分级㊁分期㊁复发呈正相关[2-4]㊂然而,MT A1和MT D H在肺癌中表达水平及二者之间是否存在相关性,目前尚不明确,本研究围绕上述问题展开研究㊂1资料与方法1.1一般资料本研究所采用组织标本来源于2018年1月至2019年12月于本院胸外科确诊肺癌并行手术切除的Ⅰ~Ⅲ期癌组织石蜡包埋固定标本,选取50份肺癌标本肿瘤组织与癌旁组织(距瘤体边缘大于3c m),其中腺癌32例,鳞癌16例,小细胞肺癌2例㊂1.2方法1.2.1细胞株及主要试剂(1)细胞株:肺腺癌细胞系A549购自中科院上海细胞库,小细胞肺癌细胞系S B C-5购自A T C C细胞库㊂MT A1干扰序列(s i R N A)㊁MT A1过表达质粒由上海吉玛基因公司设计合成㊂(2)主要试剂:R N A组织保存液㊁组织蛋白抽提试剂盒㊁二喹啉甲酸(B C A)法蛋白浓度测定试剂盒㊁脂质体3000㊁蛋白质免疫沉淀法试剂盒均购自赛默飞世尔科技(中国)有限公司; R N A i s o试剂㊁P r i m e S c r i p t R T M a s t e r M i x,T B G r e e n P r e m i x E x T a qⅡ购自日本T a K a R a公司;抗-MT D H 抗体购自英国A b c a m公司;抗-MA T1㊁抗-缺氧诱导因子-1α(H I F-1α)㊁抗-增殖细胞核抗原(P C N A)㊁抗-β-a c t i n抗体购自上海帛龙生物科技公司;二抗及二氨基联苯胺(D A B)染色液购自罗氏诊断产品(上海)有限公司;胎牛血清购自美国G i b c o公司;C C K-8试剂购自碧云天生物技术公司;抑制剂C A Y10585购自英国A b c a m公司㊂1.2.2免疫组织化学(I H C)检测利用切片机制成厚度约4μm的石蜡切片备用㊂将石蜡切片进行二甲苯脱蜡㊁梯度乙醇复水处理,采用柠檬酸盐缓冲液微波加热法进行抗原修复㊂3%过氧化氢灭活处理后经羊血清封闭4h后,抗体(MT A1抗体㊁MT D H抗体)稀释后4ħ孵育过夜㊂漂洗后二抗孵育2h,行D A B染色,并复染细胞核,显微镜下拍照㊂I H C染色评分根据染色程度给予0~5分,每张切片由3名人员独立评分,取平均分进行统计学分析㊂1.2.3 R N A提取及实时荧光定量P C R检测所取组织标本置于R N A组织保存液中,避免R N A降解㊂转移至实验室后采用化学试剂法提取总R N A,并采用逆转录试剂盒将R N A逆转录为c D N A,具体操作参见说明书进行㊂采用荧光嵌合P C R法检测目的基因的相对表达水平㊂1.2.4蛋白质提取与蛋白W e s t e r n b l o t实验组织蛋白抽提试剂加入1%的蛋白酶和磷酸酶抑制剂,4ħ下匀浆并离心保留上清液㊂B C A法测定蛋白浓度,并稀释蛋白浓度至2μg/μL㊂蛋白煮沸进行变性处理,然后进行蛋白电泳㊁转膜㊁封闭㊁抗体孵育㊁漂洗后行化学发光显色㊂1.2.5细胞培养与转染A549㊁S B C-5用含10%胎牛血清的D M E M-F12培养基进行培养㊂当细胞密度达到80%~90%时进行细胞转染,s i R N A和过表达质粒转染条件按照脂质体3000说明书进行处理,转染48h后收集细胞进行后续实验㊂1.2.6细胞活力测定收集转染48h后的各组细胞,接种至96孔板,调整细胞浓度约每孔5ˑ103个细胞,每组设4个复孔,将培养板置于37ħ,5%C O2的培养箱培养24h,每孔中加入10μL的C C K-8试剂后孵育2h,用酶标仪记录450n m波长处吸光度㊂1.2.7乙酰化蛋白的富集采用抗乙酰化蛋白的抗体富集样本中所有乙酰化的蛋白,然后采用MT D H抗体进行检测,得到乙酰化的MT D H水平㊂乙酰化蛋白的免疫沉淀采用磁珠法进行,具体操作参考说明书㊂1.3统计学处理实验数据采用G r a p h p a d P r i s m8.0统计软件进行分析,相关性分析采用线性回归分析,两组间差异比较采用t检验,多组间比较采用方差分析加每组间差异分析,以P<0.05为差异有统计学意义㊂2结果2.1两组标本组织中MT A1㊁MT D H表达水平比较I H C染色结果显示,MT A1㊁MT D H在癌旁组织表达水平较低,而在癌组织中高表达,且二者表达水平存在正相关(r2=0.8093),见图1㊂实时荧光定量P C R检测结果显示,癌组织中MT A1㊁MT D H的m R N A表达水平明显增高(P<0.001),且二者的m R N A表达水平存在正相关(r2=0.7741),见图2㊂W e s t e r n b l o t实验显示,MT A1㊁MT D H在癌组织中高表达,且二者的表达水平正相关(r2=0.5519),见图3㊂2.2肺癌细胞系中MT A1对MT D H表达水平的影响W e s t e r n b l o t实验结果显示,在A549和S B C-5中,转染MT A1干扰序列抑制MT A1表达的同时也引起MT D H㊁P C N A蛋白表达下降,见图4㊂C C K-8实验结果显示,转染MT A1干扰序列后的A549细胞活力下降㊂相反,转染过表达MT A1质粒的A549和S B C-5细胞,MT A1表达上调的同时,MT D H和P C-2541重庆医学2021年第50卷第9期N A 的表达均呈现上调,见图5㊂C C K -8实验结果显示,抑制MT A 1表达后A 549细胞活力受抑制,过表达MT A 1时A 549细胞活力增强,见图6㊂图1 两组标本组织中M T A 1㊁M T D H 的表达水平及肺癌组织中M T A 1㊁M T D H表达水平相关性分析a:P <0.001,与癌旁组织比较㊂图2 两组标本组织中M T A 1㊁M T D H m R N A表达水平及肺癌组织中二者表达水平相关性分析a:P <0.05,与癌旁组织比较㊂图3 W e s t e r n b l o t 检测肺癌组织中M T A 1和M T D H 的表达水平及肺癌组织中二者表达水平的相关性2.3 MT A 1通过非直接乙酰化修饰途径上调MT -D H 的表达在A 549细胞系中过表达MT A 1后MT D H 表达上调,但W e s t e r n b l o t 实验分析显示,过表达MT A 1并未影响MT D H 的乙酰化水平,见图7㊂2.4 MT A 1通过H I F -1α上调MT D H 的表达W e s t e r n b l o t 实验结果显示,过表达MT A 1引起A 549细胞的H I F -1α表达上调,而抑制MT A 1引起A 549细胞的H I F -1α表达下调㊂给予H I F -1α通路抑制剂C A Y 10585(5μm o l /L ),结果显示C A Y 10585可以减弱MT A 1对MT D H 表达的促进作用,见图8㊂ a :P <0.05,b:P <0.01,与s i -MT A 1比较㊂图4 转染s i -M T A 1后肺癌细胞系A 549㊁S B C -5中M T A 1及P C N A ㊁M T D H 蛋白表达水平3541重庆医学2021年第50卷第9期a :P <0.05,b:P <0.01,与V e c -M T A 1比较㊂图5 肺癌细胞系A 549㊁S B C -5转染V e c -M T A 1后M T A 1㊁M T D H 和P C N A 蛋白表达水平a :P <0.05,b :P <0.01,与s i -MT A 1比较,c :P <0.01,d :P <0.05,与Ve c -MT A 1比较㊂图6 C C K -8方法检测干预A 549细胞中M T A 1基因表达对细胞活力的影响图7 A 549细胞中M T A 1对M T D H乙酰化水平的影响a :P <0.05,与V e c -M T A 1比较;b :P <0.05,与s i -MT A 1比较;c :P <0.01,与C A Y 10585比较;d:P <0.05,与V e c -M T A 1+C A Y 10585比较㊂图8 C A Y 10585及M T A 1对M T D H 表达的影响3 讨 论MT A 1㊁MT D H 作为促癌蛋白 在多种恶性肿瘤,如肺癌㊁结肠癌㊁乳腺癌㊁胶质瘤和头颈鳞状细胞癌中被充分证明㊂肿瘤中MT A 1㊁MT D H 表达水平的异常可能介导了肿瘤的增殖㊁进展和对放化疗的敏感性[5-7]㊂本研究收集了50份手术切除的肺癌组织标本,经I H C 染色㊁实时荧光定量P C R 和W e s t e r n b l o t 实验证实了肺癌组织中MT A 1㊁MT D H 表达上调,且二者的表达呈正相关㊂细胞学实验证实MT A 1正向调控MT D H 在肺癌细胞系中的表达,然而这种调控作用并非通过直接乙酰化调节实现的,而是可能通过增强H I F -1α的表达,间接上调了MT D H 的表达㊂本研究证实了MT A 1㊁MT D H 在肺癌中的调控关系,发现MT A 1通过H I F -1α-MT D H 通路促进肺癌细胞增殖的作用,可为后续肺癌的靶点特异性治疗打下基础㊂4541重庆医学2021年第50卷第9期基因表达调控是通过募集大分子调控复合物到特定的基因位点修饰D N A和组蛋白的表观调控位点,进而影响染色质结构实现㊂MT A1是核小体重构和去乙酰酶复合物(N u R D)的一个重要组成部分[8]㊂MT A1包括4个特征性的结构域㊁一系列相互作用的模体和部分无序的区域㊂E L M2-S A N T域是MT A1的最具特征性的区域之一,招募组蛋白去乙酰酶1 (H D A C1)并磷酸肌醇存在的情况下激活该酶[9]㊂MT A蛋白调节一系列癌症促进过程,包括侵袭㊁上皮间质转化㊁D N A损伤反应㊁血管生成㊁转移和耐药[6]㊂从机制上讲,MT A蛋白在癌细胞中的这些不同作用主要是通过调控靶基因表达和(或)调控MT A相互作用蛋白的活性而实现㊂如MT A1的上调通过刺激转化生长因子β(T G F-β)㊁E r b B2和转录激活因子3 (S T A T3)信号通路,或者作为核内原癌基因(c-M y c)介导转化的下游效应因子及拮抗肿瘤抑制因子p53等途径促进肿瘤发生过程[10-11]㊂本研究结果发现, MT A1在肺癌中高表达,也提示MT A1可能是肺癌发生的关键调控分子,并且体外实验也证实抑制MT A1可明显抑制肺癌细胞的增殖和活力㊂MT D H是肿瘤研究中的热点分子,因为其在多种肿瘤中高表达而在正常组织中表达量很低,提示MT D H参与肿瘤的发生并且具有成为肿瘤生物标志物的潜能[12]㊂另外,有研究对比分析了不同临床分期的肿瘤中MT D H的表达水平,结果提示MT D H的高表达与增殖㊁转移和预后不良密切相关[13]㊂功能分析研究发现,MT D H的表达受多种信号通路调控,其中较为关键的是磷脂酰肌醇3激酶(P I3K)-蛋白激酶β(A k t)和糖原合成酶激酶3β(G S K-3β)通过r a s信号通路激活经典的原癌基因c-M y c,随后导致MT D H 的高表达[14]㊂另有研究发现,MT D H的高表达还与肿瘤的化疗药物耐药有关,人为抑制MT D H的表达能增强肿瘤细胞对顺铂㊁培美曲塞等化疗药物的敏感性[15-16]㊂MT A1与MT D H相关性的研究多集中于下游共有的多个靶基因调控,二者具有相同的下游信号通路,到目前为止,MT A1直接调控MT D H基因表达的证据尚无报道㊂本研究分别通过抑制和过表达肺癌细胞系A549和S B C-5中MT A1的表达,检测MT-D H㊁P C N A表达水平,结果显示MT A1对MT D H㊁P C N A的表达具有正向调控作用㊂本研究进一步验证这种调控作用是否通过直接乙酰化修饰实现,实验结果显示,MT A1对MT D H的乙酰化水平没有影响㊂有研究发现,MT A1可通过H D A C1去乙酰化H I F-1α,从而增强H I F-1α的稳定性和活性[17]㊂本研究在A549细胞内调控MT A1的表达后,发现H I F-1α也出现相应的变化,提示在A549肺癌细胞系中MT A1也能调控H I F-1α的表达㊂有研究证实,MT D H的表达受H I F-1α的调控,MT D H介导了H I F-1α引起的肿瘤对缺氧的适应性改变[18]㊂因此,本研究在A549细胞系中进行验证,结果发现阻断H I F-1α,消除了MT A1对MT D H的上调作用,提示MT A1可能通过H I F-1α间接调控MT D H的表达,解释了在不同肺癌标本中MT A1和MT D H的表达增加且存在正相关性㊂综上所述,MT A1和MT D H在肺癌组织表达上调且存在正相关,而内在的调控通路可能是通过H I F-1α介导的㊂MT A1-H I F-1α-MT D H通路可能在肺癌的发生中起关键的调控作用,可能成为未来肿瘤治疗的靶点㊂参考文献[1]I S H I K AWA M,O S A K I M,Y AMA G I S H I M,e t a l.C o r r e l a t i o n of t w o d i s t i n c t m e t a s t a s i s-a s-s o c i a t e d p r o t e i n s,MT A1a n d S100A4,i n a ng i o-g e n e s i s f o r p r o m o t i n g t u m o r g r o w t h[J].O n c o-g e n e,2019,38(24):4715-4728.[2]WA N L,L U X,Y U A N S,e t a l.MT D H-S N D1i n t e r a c t i o n i s c r u c i a l f o r e x p a n s i o n a n d a c t i v i t yo f t u m o r-i n i t i a t i n g c e l l s i n d i v e r s e o n c o g e n e-a n d c a r c i n o g e n-i n d u c e d m a mm a r y t u m o r s[J].C a n c e r C e l l,2014,26(1):92-105.[3]WA N G Q,T A N L,L I U J,e t a l.M i c r o R N A-98/ P T E N/A K T p a t h w a y i n h i b i t s c e l l p r o l i f e r a t i o n a n d m a l i g n a n t p r o g r e s s i o n o f h y p o p h a r y n g e a lc a r c i n o m a b y MT D H[J].O n c o l R e p,2019,41(2):863-874.[4]L U O Z,HU X,X I O N G H,e t a l.A p o l y s a c c h a-r i d e f r o m H u a i e r i n d u c e d a p o p t o s i s i n M C F-7 b r e a s t c a n c e r c e l l s v i a d o w n-r e g u l a t i o n o f MT-D H p r o t e i n[J].C a r b o h y d r P o l y m,2016,151: 1027-1033.[5]E M D A D L,D A S S K,HU B,e t a l.A E G-1/MT-D H/L Y R I C:A p r o m i s c u o u s p r o t e i n p a r t n e r c r i t i c a l i n c a n c e r,o b e s i t y,a n d C N S d i s e a s e s[J].A d v C a n c e r R e s,2016,131:97-132.[6]L E E M H,K OH D,N A H,e t a l.MT A1i s a n o-v e l r e g u l a t o r o f a u t o p h a g y t h a t i n d u c e s t a m o x-i f e n r e s i s t a n c e i n b r e a s t c a n c e r c e l l s[J].A u t o-p h a g y,2018,14(5):812-824.[7]Z H U G,P E N G F,G O N G W,e t a l.H y p o x i a p r o-m o t e s m i g r a t i o n/i n v a s i o n a n d g l y c o l y s i s i n h e a d a n d n e c k s q u a m o u s c e l l c a r c i n o m a v i a a n H I F-1α-MT D H l o o p[J].O n c o l R e p,2017,38(5): 2893-2900.[8]L I N K S,S P I T Z E R R M M,S A N A M,e t a l.P WW P2A b i n d s d i s t i n c t c h r o m a t i n m o i e t i e s a n d i n t e r a c t sw i t h a n M T A1-s p e c i f i c c o r e N u R D c o m p l e x[J].N a tC o m m u n,2018,9(1):4300.(下转第1460页)5541重庆医学2021年第50卷第9期急性淋巴细胞白血病细胞增殖[J].中华实验外科杂志,2019,36(2):295-297.[7]Y A N G X Y,S H E N G Y.m i R-101r e p r e s s e s T-C e l l a c u t e l y m p h o b l a s t i c l e u k e m i a b y t a r g e t i n gC X C R7/S T A T3a x i s[J].O n c o l R e s,2019,27(9):997-1006.[8]T U Z,X I O N G J,X I A O R,e t a l.L o s s o f m i R-146b-5p p r o m o t e s T c e l l a c u t e l y m p h o b l a s t i c l e u k e m i a m i g r a t i o n a n d i n v a s i o n v i a t h e I L-17A p a t h w a y[J].J C e l l B i o c h e m,2019,120(4): 5936-5948.[9]H E Z,L I A O Z,C H E N S,e t a l.D o w n r e g u l a t e dm i R-17,m i R-29c,m i R-92a a n d m i R-214M a y b e r e l a t e d t o B C L11B o v e r e x p r e s s i o n i n T c e l l a-c u t e l y m p h o b l a s t i c l e u k e m i a[J].A s i a P a c J C l i nO n c o l,2018,14(5):e259-265.[10]W A N G Q,T E N G Y,W A N G R,e t a l.T h e l o n g n o n-c od i n g R N A S N H G14i n h i b i t s ce l l p r o l if e r a t i o n a n d i n v a s i o n a n d p r o m o t e s a p o p t o s i s b y s p o ng i n g m i R-92a-3p i n g l i o m a[J].O n c o t a r g e t,2018,9(15):12112-12124.[11]A HMA D I S,S H A R I F I M,S A L E H I R.L o c k e dn u c l e i c a c i d i n h i b i t s m i R-92a-3p i n h u m a n c o l o-r e c t a l c a n c e r,i n d u c e s a p o p t o s i s a n d i n h i b i t s c e l lp r o l i f e r a t i o n[J].C a n c e r G e n e T h e r,2016,23(7):199-205.[12]张丽华,欧阳丹,徐立凤,等.m i R-92a-3p对3T3-L1前体脂肪细胞增殖与分化的影响[J].中国兽医科学,2016,46(11):1450-1455. [13]唐凯玲,龙鼎新.N o t c h信号通路在相关疾病中的研究进展[J].中南医学科学杂志,2016,44(2):219-223.[14]Z H A N G Y,G U N D E L A C H J,L I N D Q U I S T L D,e t a l.C h e m o t h e r a p y-i n d u c e d c e l l u l a r s e n e s c e n c e s u p p r e s s e s p r o g r e s s i o n of N o t c h-d r i v e n T-A L L[J].P L o S O n e,2019,14(10):1-12. [15]卫晓华,康建民,李参,等.D L K1调控N o t c h信号通路对急性T淋巴细胞白血病细胞的影响[J].白血病㊃淋巴瘤,2013,22(10):586-588.[16]杨琦,康建民,陈秀花,等.N o t c h1基因表达对急性T淋巴细胞白血病S u p T1细胞增殖㊁凋亡的影响及其机制[J].白血病㊃淋巴瘤,2015,24(11):645-649.(收稿日期:2020-06-18修回日期:2020-12-15)(上接第1455页)[9]K UMA R A,D H A R S,C AM P A N E L L I G,e t a l.MT A1d r i v e s m a l i g n a n t p r o g r e s s i o n a n d b o n em e t a s t a s i s i n p r o s t a t e c a n c e r[J].M o l O n c o l, 2018,12(9):1596-1607.[10]D E N G L,T A N G J,Y A N G H,e t a l.M T A1m o d u-l a t e d b y m i R-30e c o n t r i b u t e s t o e p i t h e l i a l-t o-m e s-e n c h y m a l t r a n s i t i o n i n h e p a t o c e l l u l a r c a r c i n o m a t h r o u g h a n E r b B2-d e p e n d e n t p a t h w a y[J].O n c o-g e n e,2017,36(28):3976-3985.[11]L I L,L I U J,X U E H,e t a l.A T G F-β-MT A1-S O X4-E Z H2s i g n a l i n g a x i s d r i v e s e p i t h e l i a l-m e s e n c h y m a l t r a n s i t i o n i n t u m o r m e t a s t a s i s[J].O n c o g e n e,2020,39(10):2125-2139.[12]B I J,A R E E C H E E W A K U L S,L I Y,e t a l.M T D H/A E G-1d o w n r e g u l a t i o n u s i n g p r i s t i m e r i n-l o a d e dn a n o p a r t i c l e s i n h i b i t s F a n c o n i a n e m i a p r o t e i n s a n d i n c r e a s e s s e n s i t i v i t y t o p l a t i n u m-b a s e d c h e m o t h e r-a p y[J].G y n e c o l O n c o l,2019,155(2):349-358.[13]L I Q,WA N G M,WA N G N,e t a l.D o w n r e g u l a-t i o n o f m i c r o R N A-216b c o n t r i b u t e s t o g l i o m a c e l l g r o w t h a n d m i g r a t i o n b y p r o m o t i n g A E G-1-m e d i a t e d s i g n a l i n g[J].B i o m e d P h a r m a c o t h-e r,2018,104:420-426.[14]L E E S G,S U Z Z,E M D A D L,e t a l.A s t r o c y t ee l e v a t e d g e n e-1a c t i v a t e s c e l l s u r v i v a l p a t h w a y s t h r o u g h P I3K-A k t s i g n a l i n g[J].O n c o g e n e, 2008,27(8):1114-1121.[15]L O N G J,M E N G G E N Q,WU R E N Q,e t a l.L o n gn o n c o d i n g R N A t a u r i n e-u p r e g u l a t e d g e n e1(T U G1)p r o m o t e s t u m o r g r o w t h a n d m e t a s t a-s i s t h r o u g h T U G1/M i r-129-5p/a s t r o c y t e-e l e-v a t e d g e n e-1(A E G-1)a x i s i n m a l i g n a n t m e l a-n o m a[J].M e d S c i M o n i t,2018,24:1547-1559.[16]C H E N C Y,C H E N Y Y,C H E N J,e t a l.A s t r o-c y t e-e l e v a t ed ge n e-1c o nf e r s r e s i s t a n c e t o p e m-e t r e x e d i n n o n-s m a l l c e l l l u ng c a n c e r b y u p r e g-u l a t i n g t h y m i d y l a t e s y n t h a s e e x p r e s s i o n[J].O n c o t a r g e t,2017,8(37):61901-61916.[17]WA N G T,L I W,HU A N G H,e t a l.M e t a s t a s i s-a s s o c i a t e d1(MT A1)g e n e e x p r e s s i o n p r o-m o t e s a n g i o g e n e s i s i n m o u s e x e n o g r a f t s f r o mh u m a n n o n-s m a l l c e l l l u n g c a n c e r(N S C L C)c e l l s[J].M ed S c i M o n i t,2019,25:484-491.[18]Z H A O T,Z H A O C,Z H O U Y,e t a l.H I F-1αb i n d-i n g t o A E G-1p r o m o t e r i n d u c e d u p r e g u l a t e d A E G-1e x p r e s s i o n a s s o c i a t e d w i t h m e t a s t a s i s i n o v a r i a n c a n c e r[J].C a n c e r M e d,2017,6(5):1072-1081.(收稿日期:2020-08-20修回日期:2020-12-06)0641重庆医学2021年第50卷第9期。
人类基因组计划路线
人类基因组计划路线英文回答:As a researcher in the field of genetics, I have had the opportunity to work on the Human Genome Project, a groundbreaking international research initiative that aimed to map and sequence all the genes in the human genome. The project was a massive undertaking that involved scientists from around the world working together to decode the genetic blueprint of our species.One of the key milestones of the Human Genome Project was the completion of the first draft of the human genome in 2000. This was a major achievement that provided researchers with a comprehensive map of the approximately 20,000-25,000 genes in the human genome. This milestone paved the way for further research into the genetic basis of human diseases and traits.After the completion of the first draft, the HumanGenome Project entered a new phase focused on refining the genome sequence and identifying all the functional elements within it. This involved identifying genes, regulatory elements, and non-coding regions that play a role in gene expression and regulation.In my own research, I have used the data generated by the Human Genome Project to study the genetic basis of complex diseases such as cancer and diabetes. By analyzing the genome sequences of individuals with these diseases, I have been able to identify genetic mutations and variations that contribute to disease risk.Overall, the Human Genome Project has had a profound impact on the field of genetics and has opened up new avenues for research into the genetic basis of human health and disease. By understanding the genetic code that makes us who we are, we are better equipped to develop new treatments and interventions to improve human health.中文回答:作为遗传学领域的研究人员,我有幸参与了人类基因组计划,这是一个开创性的国际研究项目,旨在绘制和测序人类基因组中的所有基因。
- 1、下载文档前请自行甄别文档内容的完整性,平台不提供额外的编辑、内容补充、找答案等附加服务。
- 2、"仅部分预览"的文档,不可在线预览部分如存在完整性等问题,可反馈申请退款(可完整预览的文档不适用该条件!)。
- 3、如文档侵犯您的权益,请联系客服反馈,我们会尽快为您处理(人工客服工作时间:9:00-18:30)。
The Prostate 43:125–135 (2000)Metallothionein Isoform 1 and 2 Gene Expression in the Human Prostate: Downregulation of MT-1X in Advanced Prostate CancerScott H. Garrett, Mary Ann Sens, Deepti Shukla, Luis Flores, Seema Somji, John H. Todd, and Donald A. Sens* Robert C. Byrd Health Sciences Center, Departments of Pathology and Urology, West Virginia University, Morgantown, West VirginiaBACKGROUND. Studies have shown an association of metallothionein (MT) overexpression with tumor type and grade. However, a family of genes underlies the expression of these proteins. The goals of this study were to define the expression of MT genes and protein in normal human prostate and to provide evidence that the expression of the MT isoforms is altered in prostate cancer. METHODS. Immunohistochemistry was used to localize MT protein, reverse transcriptionpolymerase chain reaction (RT-PCR) to determine the MT isoform-specific mRNAs, and immunoblot analysis to determine MT protein levels. RESULTS. The localization of MT in the prostate was further defined using the E9 antibody. Using normal prostate tissue dissected from glands removed for prostate cancer, it was demonstrated that MT protein expression in the normal prostate is supported by mRNA from the MT-1A, MT-1E, MT-1X, and MT-2A genes. No expression of the MT-1X gene was demonstrated in cases of advanced prostate cancer. The expression of MT-1 and MT-2 isoformspecific mRNA varied among three commonly utilized prostate cancer cell lines. CONCLUSIONS. MT protein in the normal human prostate is supported by transcription of mRNA from the MT-1A, MT-1E, MT-1X, and MT-2A genes. Expression of MT-1X mRNA is downregulated in advanced prostate cancer. Variable expression of MT mRNA in prostate cell lines provides evidence that MT gene expression may be altered among individual prostate cancers. Prostate 43:125–135, 2000. © 2000 Wiley-Liss, Inc. KEY WORDS: metallothionein; immunohistochemistry; RT-PCR; cell culture; PIN; prostate cancer; mRNA; prostateINTRODUCTION The metallothioneins (MTs) are a family of low molecular weight, cysteine-rich intracellular proteins that bind transition metals, including Cu+2, Zn+2, Ag+2, Hg+2, and Cd+2 [1]. Most studies have centered on the analysis of two major isoforms of MT (designated MT-1 and MT-2) that were identified through ionexchange chromatography [1,2]. The MT-1 and MT-2 isoforms have been proposed to play a role in metal detoxification (Cd+2, Hg+2, Ag+2, and Pb+2), in essential metal homeostasis (Zn+2 and Cu+2), and in the protection of cells against damage induced by alkylating agents, oxygen radicals, and ionizing radiation © 2000 Wiley-Liss, Inc.[3]. Furthermore, the MT-1 and MT-2 isoforms have been shown in numerous animal and human tissues and derived cell lines to be highly inducible by these metals and by a variety of other chemicals and stimuli [1–3]. Genes for two other charge-separable MT isoforms with restricted tissue distribution, MT-3 and MT-4, were recently described [4,5]. Recently, it was also demonstrated that antibodies are available that*Correspondence to: Don Sens, Ph.D., Department of Pathology, West Virginia University, P.O. Box 9203, Morgantown, WV 26506. E-mail: dsens@ Received 8 June 1999; Accepted 10 December 1999126Garrett et al. mens were obtained from radical prostatectomies removed due to primary prostate cancer. The control specimens were obtained from areas well removed from the tumor, as determined by the pathologist. The normal specimens included sampling from the peripheral, transitional, and central zones of the prostate. All specimens were obtained following completion of diagnostic protocols in surgical pathology; the protocol for tissue acquisition was approved by our Institutional Review Board for Human Research. Only samples showing no evidence of tissue degradation, as judged by histochemical examination of hematoxylin and eosin-stained sections, were used for molecular analysis. For the immunohistochemical analysis of MT-1 and MT-2 expression, paraffin blocks of prostate specimens were obtained from the pathology archives. For the determination of MT-1 and MT-2 isoformspecific gene expression in prostate cancer, paraffin blocks from 5 cases of advanced cancer were selected from the pathology archives. Case 1 is a poorly differentiated adenocarcinoma (Gleasons 5 + 5) from a 69year-old male. Case 2 is a moderately differentiated adenocarcinoma (Gleasons 3 + 4) from a 69-year-old male. Case 3 is a moderately differentiated adenocarcinoma (Gleasons 3 + 2) from a 73-year-old male. Case 4 is a poorly differentiated adenocarcinoma (Gleasons 4 + 5) from a 64-year-old male. Case 5 is a moderately differentiated adenocarcinoma (Gleasons 2 + 3) from a 74-year-old male. Cell Culture The cell lines used in this study were obtained from the American Type Culture Collection (Rockville, MD) with corresponding designations: Du-145 (HTB 81), LNCaP (CRL 1740), and PC-3 (CRL 1435). The cells were grown in Ham’s F-12 or RPMI medium supplemented with 10% (v/v) fetal calf serum. The cells were passaged at a 1:4 ratio upon attaining confluence. RNA Isolation and RT-PCR From Fresh Tissues and Cell Lines Prostate tissue was ground to a powder under liquid nitrogen. The human prostate cancer cell lines were grown to confluence in 75-cm2 T-flasks. Total RNA was isolated from the cultured cells and powdered tissue according to the protocol supplied with TRI REAGENT™ (Molecular Research Center, Inc., Cincinnati, OH), as described previously [11,12]. The concentration and purity of the RNA samples were determined using a spectrophotometer scan in the ultraviolet (UV) region and ethidium bromide (EtBr) visualization of intact 18S and 28S RNA bands following agarose gel electrophoresis. Total RNA (0.5 g) wascan be used to immunohistochemically determine the coexpression of MT-1 and MT-2 protein in archival paraffin-embedded tissues. This has allowed the retrospective analysis of MT overexpression status in a wide variety of human tumors (review in Jasani and Schmid [6]). Overall, these studies have shown an association of MT overexpression with the type and grade of tumor [6]. In the normal human prostate, both immunohistochemistry and radioimmunoassay have been employed to determine the expression of MT-1 and MT-2 proteins [7]. MT immunoreactivity was localized in the cytoplasm and nucleus of glandular epithelial cells. In general, the immunoreactivity of MT was most intense in the peripheral zone, moderate in the transitional zone, and weak in the central zone; however, epithelial cells in all zones showed a large variability in MT staining intensity. In prostate cancer, MT was detected in 15 of 45 cases of primary cancer [8]. When immunoreactive, MT was localized to both the cytoplasm and nucleus. The expression of MT was correlated to tumor grade, with significant differences between high and low Gleason scores, and between middle and low Gleason scores, but no relationship was found with clinical stage. It was concluded that there was a close correlation of MT expression with tumor grade and that MT has a wide range of expression in prostate cancer. However, what is not widely appreciated when assessing and interpreting the immunoreactivity of the MT-1 and MT-2 proteins, is that a family of genes underlies the expression of these proteins. In humans, the MTs are encoded by a family of genes located at 16q13 consisting of 10 functional (MT-1A, MT-1B, MT-1E, MT-1F, MT-1G, MT-1H, MT1X, MT-2A, MT-3, and MT-4) and 7 nonfunctional (MT-1C, MT-1D, MT-1I, MT-1J, MT-1K, MT-1L, and MT-2B) MT isoforms [4,5,9,10]. This raises the possibility that the clinical significance of MT expression in human prostate cancer might be further defined if specific MT gene expression patterns were known for both normal and cancerous tissue. The first goal of this study was to confirm the expression of MT in the normal prostate and then to define the expression of the active MT-1 and MT-2 genes underlying this MT immunoreactivity. An additional goal was to provide initial evidence, using advanced cases of prostate cancer and prostatic cell lines, that the expression of the MT isoforms might vary among individual cancers. MATERIALS AND METHODS Prostate Specimens for Immunohistochemical and Molecular Analysis For the determination of MT-1 and MT-2 isoform gene expression in normal prostates, six control speci-MT Gene Expression in Human Prostate reverse-transcribed using murine leukemia virus (MuLV) reverse transcriptase (50 units) in 1 × PCR buffer (50 mM KCl and 10 mM Tris-HCl, pH 8.3), 5 mM MgCl2, 20 units RNase inhibitor, 1 mM each of the dNTPs, and 2.5 M random hexanucleotide primers. The samples were reverse transcribed for 20 min at 42°C, followed by a 5-min denaturation step at 99°C using a DNA thermocycler (Perkin-Elmer-Cetus 9600, Perkin Elmer, Foster City, CA). The reversetranscribed product was used for PCR amplification using the AmpliTaq DNA polymerase enzyme (2.5 units) (Perkin Elmer) and the specific upstream and downstream primers at a concentration of 0.075 M each. The primers developed for analysis of each of the active MT genes have been previously described [11,12]. The thermocycler was programmed to cycle at 95°C for a 2-min initial step, at 95°C for 30 sec, and at 68°C for 30 sec, with a final elongation step at 68°C for 7 min. Controls for each PCR included a no-template control where water was added instead of the RNA, and a no-reverse-transcriptase control where water was added instead of the enzyme. Samples were removed at 25, 30, 35, and 40 PCR cycles to ensure that the reaction remained in the linear region. The final PCR products were electrophoresed on 2% agarose gels containing EtBr along with DNA markers. The intensity (integrated optical density, IOD) of the PCR product bands was determined on a Roche Pathology workstation (Roche Image Analysis Systems, Inc., Elon College, NC) configured with Kontron KS 400 image analysis software (Zeiss, Thornwood, NY). RNA Isolation and RT-PCR of Microdissected Tissue From Paraffin Blocks The PixCell II™ LCM System (Arcturus Engineering, Mountain View, CA) was used for laser capture. Five-micron-thick sections were cut from formalinfixed, paraffin-embedded tissue blocks with a microtome and mounted on plain glass slides. The slides were stained with hematoxylin and eosin-y. Total RNA was extracted from samples using the micro RNA isolation kit (catalog no. 200344, Stratagene, La Jolla, CA). The captured tissue was placed in a reagent tube containing 200 l of denaturing buffer and 1.6 l of -mercaptoethanol. The tube was inverted several times to digest the tissue from the cap. Twenty microliters of 2 M sodium acetate (pH 4.0) solution were added to the samples along with 220 l of phenol and 60 l of chloroform:isoamyl alcohol. The samples were vortexed and placed on ice for 15 min, followed by centrifugation at maximal speed in a microfuge for 30 min at 4°C to separate the aqueous and organic phase. The upper aqueous phase was transferred to a fresh tube, and 1 l of glycogen (2 g/l) was added. RNA127was precipitated with the addition of 200 l of ice-cold isopropanol. The samples were left overnight in a −70°C freezer, after which they were centrifuged at maximal speed in a microfuge for 30 min at 4°C. The supernatant was removed and the RNA pellet was washed twice with 70% ethanol. The pellet was dried on ice and resuspended in RNase-free water. Total RNA (1 l) was reverse transcribed in a 20 l reaction mixture using MuLV reverse transcriptase (50 units) in 1 × PCR buffer (50 mM KCl and 10 mM Tris-HCl, pH 8.3), 5 mM MgCl2 solution, 20 units RNase inhibitor, 1 mM each of the dNTPs, and 2.5 M random hexanucleotide primers. The samples were reverse-transcribed for 20 min at 42°C, followed by a 5-min step at 99°C to inactivate the reverse transcriptase using a GeneAmp 9600 thermocycler (PE Applied Biosystems, Foster City, CA). The resulting cDNA was amplified in a 100-l reaction mixture containing 2 mM MgCl2, 1 × PCR buffer, 2.5 units of AmpliTaq DNA polymerase, and 0.2 M of the respective outer primers. The PCR was performed as follows: an initial incubation at 95°C for 2 min for a denaturation step, followed by 40 cycles of 95°C for 30 sec and 68°C for 30 sec. Controls for each PCR reaction included a notemplate control in which 1 l water was added instead of the RNA, and a no-reverse-transcriptase control in which 1 l of water was added instead of the enzyme. Twenty microliters of the product from the first-round of PCR were added to 80 l of a PCR reaction mixture (2 mM MgCl2, 1 × PCR buffer, 200 M dNTPs, 2.5 units of AmpliTaq DNA polymerase, and 0.2 M of the respective inner nested primers) for a second round of PCR. Samples were removed at 30, 35, and 40 PCR cycles to ensure that the reaction remained in the linear region. The outer and inner nested primers for the human -actin gene and MT isoforms were developed using Oligo 5.0 software (National Biosciences, Inc., Plymouth, MN). The upper outer and inner primer sequence for MT-1A and the lower outer and inner primer sequence for MT-1E were the same. The sequences of the outer and inner nested primers along with the product sizes are as follows: -actin: outer primer upper 5Ј ATGGATGATGATATCGCCGCG 3Ј and lower 5Ј CTCCATGTCGTCCCAGTTGGT 3Ј (product size, 249 bp), nested inner primer upper 5Ј CGACAACGGCTCCGGCATGT 3Ј and lower 5Ј TGCCGTGCTCGATGGGGTACT 3Ј (product size, 194 bp); MT-1A outer primer upper 5Ј CTCGAAATGGACCCCAACT 3 Ј and lower 5 Ј ATATCTTCGAGCAGGGCTGTC 3Ј (product size, 219 bp), nested inner primer lower 5Ј TCTCTGATGCCGCTTTGC 3Ј (product size, 172 bp); MT-1E outer primer upper 5Ј GCTTGTTCGTCTCACTGGTG 3Ј and lower 5Ј CAGGTTGTGCAGGTTGTTCTA 3Ј (product size, 284 bp), nested inner primer upper 5Ј TTGCTC-128Garrett et al. has detection limits in the range of 0.1–0.5 ng MT-1/2 protein. Immunohistochemistry For immunohistological characterization, prostate specimens were obtained from pathology archives. These specimens were routinely fixed in neutralbuffered formalin for 16–18 hr. All tissues were transferred to 70% ethanol and dehydrated in 100% ethanol. Dehydrated tissues were cleared in xylene, infiltrated, and embedded in paraffin. Serial sections were cut at 3–5 m for use in immunohistochemical protocols. Prior to immunostaining, sections were pretreated in a microwave at 700 W in 10 mM citrate buffer (pH 6.0) for 5 min. Sections were allowed to cool for 5 min at room temperature, were microwaved again for 5 min, and were slowly immersed into distilled water. MT was localized using a monoclonal mouse anti-horse MT-1, MT-2 antibody (DAKO-MT, E9, in 0.05M Tris/HCl, 15mM NaN3, pH 7.5, 1%BSA, DAKO Corp.) as the primary antibody. The primary anti-MT antibody was localized using the avidinbiotin-peroxidase complex (ABC) procedure (Vectastain Kit, Vector Laboratories), using diaminobenzidine for visualization (Stable DAB, Research Genetics, Huntsville, AL). Slides were rinsed in distilled water, dehydrated in graded ethanols, cleared in xylene, and coverslipped. The positive control was the demonstration of MT staining localized to the proximal tubule in human archival kidney specimens. The negative control consisted of omission of primary antibody from the immunohistochemical ABC sequence. RESULTS Immunohistochemical Localization of MT in the Human Prostate The first goal of the present study was to confirm the results of the only previous study to detail the expression of MT in the normal human prostate [7]. This earlier study employed a laboratory-generated MT antibody, while the present study used the commercially-available source of MT antibody (DAKO, E9) that has been used in the majority of studies detailing MT expression in human tumors [6]. The results of the present study demonstrated variable, punctate staining of MT-1/2 in the cytoplasm of the acinar cells with frequent nuclear profiles, particularly in the peripheral zone acini (Fig. 1A,B). Similar to the previous study, the MT staining was generally stronger in the peripheral zone than in prostatic glands in the central zone; however, there was considerable variation in staining, as was also noted in the previousGAAATGGACCC 3Ј (product size, 246 bp); MT-1X outer primer upper 5Ј TCTCCTTGCCTCGAAATGGAC 3Ј and lower 5Ј GGGCACACTTGGCACAGC 3Ј (product size, 151 bp), nested inner primer upper 5Ј TCGAAATGGACCCCAACT 3Ј and lower 5Ј CTTGGCACAGCCGACA 3Ј (product size, 134 bp); MT-2A outer primer upper 5Ј CCGACTCTAGCCGCCTCTT 3Ј and lower 5Ј GTGGAAGTCGCGTTCTTTACA 3Ј (product size, 259 bp), and nested inner primer upper 5Ј CCATGGATCCCAACTGCTC 3Ј and lower 5Ј TGGAAGTCGCGTTCTTTACAT 3Ј (product size, 232 bp). The final PCR products were electrophoresed on 2% a agarose gel containing ethidium bromide along with DNA markers (Gibco BRL, Grand Island, NY) to verify the size of PCR products. The intensity (integrated optical density, IOD) of the PCR product bands was determined on a Roche Pathology workstation configured with Kontron KS 400 image analysis software. MT Protein Determination Cells were washed twice with PBS and then lysed in buffer containing 50 mM of Tris (pH 6.8) with 2% wt/v SDS. Prostate tissue samples were homogenized in the same buffer. Protein concentration was determined by the BCA protein assay (Pierce Chemical Co., Rockford, IL). MT protein was detected by immunoblotting using a mouse anti-horse antibody (DAKOMT, E9, Dako, Carpinteria, CA) as the primary antibody [13,14]. This antibody detects both the MT-1 and MT-2 isoforms, and the product detected is referred to as MT-1/2 in this report. Aliquots of 3 g total protein were diluted to 75 l in buffer (10 mM Tris, pH 7.4, 75 mM NaCl) and mixed with 75 l of 3% glutaraldehyde to enhance the detection of MT. One hundred microliters of this mixture (2 g total protein) were applied to a dot-blot apparatus with a polyvinylidine difluoride membrane. Samples were allowed to flow through the apparatus by gravity, followed by two PBS washes. After blocking with 10% skim milk in PBS, the membrane was soaked in primary antibody (1:100 dilution, 1% bovine serum albumin (BSA) in PBS) for 2 hr. The membrane was washed three times with PBS before anti-mouse alkaline phosphataseconjugated secondary antibody (Promega, Madison, WI) was added (1:500 dilution, 0.4% BSA in PBS). Antibody complexes were visualized using the alkaline phosphatase kit III (Vector Laboratories, Burlingame, CA). Rabbit liver Cd/Zn metallothionein-1 (Sigma Chemical Co., St. Louis, MO) was applied to each blot to generate standard curves. MT-1/2 protein was quantified by comparing the optical density of the sample dots to that of the standard MT curve, using image analysis software (KS 400, Kontron). This assayMT Gene Expression in Human Prostate129Fig. 1. Immunohistochemical localization of MT-1/2 in the human prostate (1:200 antibody dilution). A: Moderate, variable punctate staining for MT is present in the cytoplasm of acinar cells in the peripheral zone and frequently in the nucleus of the lining acinar cells. No staining for MT was noted in the basal cell layer (magnification ×200). B: Variable staining in central zone acini, with less frequent nuclear staining. The basal cell layer stained more consistently in the central zone acini. The underlying compact muscular stromal cells demonstrated very weak or negative staining (magnification ×200). C: Strong staining of MT in areas of cystic atrophy (magnification ×400). D: High magnification of the epithelial cells in C highlights the punctate staining within the cytoplasm, with some nuclear profiles visible (magnification ×1,000, oil). E: Stromal cells in fibromuscular hyperplasia demonstrate moderate staining (magnification ×200). F: Areas of granulomatous prostatitis demonstrate strong MT staining in the inflammatory cells and stroma, and increased MT staining within adjacent prostatic glands (magnification ×100). G: Main prostatic duct, with strong MT staining in lining cells and weaker staining in underlying urothelial cells. Moderate staining of inflammatory cells within the underlying lamina is also seen (magnification ×200). H: Corpora amylacea were generally negative or demonstrated weak staining of the concentric laminations (magnification ×200).130Garrett et al.study. The MT-1/2 immunostaining in the peripheral zone had increased uniformity between cells, and more frequent nuclear profiles were seen within the acinar cells when compared to staining in the central zone acini. The immunostaining for MT-1/2 was generally stronger in adenomatous areas and in areas of cystic atrophy (Fig. 1C,D). The noncompact stroma of the peripheral zone was generally negative for MT staining, while very weak, occasional staining of the compact muscular stroma of the central zone was present. Increased staining for MT-1/2 was also noted in the stromal cells of fibromuscular hyperplasia (Fig. 1E) and in areas of granulomatous and chronic prostatitis (Fig. 1F). In areas of inflammation, the acini also tended to have increased immunostaining for MT-1/2. The epithelial cell lining of the major prostatic ducts generally had moderate to strong MT immunoreactivity, while the underlying urothelial epithelium demonstrated negative or weak reactivity (Fig. 1G). The corpora amylacea within prostate glands had negative or weak nonspecific staining of the concentric laminations (Fig. 1H). MT Isoform Gene Expression in the Human Prostate RT-PCR was utilized to determine which of the active MT-1 and MT-2 genes were expressed in the normal prostate, and the relative amounts of each were determined by comparison to the housekeeping genes, -actin and glyceraldehyde 3-phosphate dehydrogenase (G3PDH). Examination of a typical gel profile obtained from RT-PCR analysis of total RNA from one clinical sample demonstrated expression of MT-1A, MT-1E, MT-1F, MT-1X, and MT-2A isoforms, while no expression of the MT-1B, MT-1G, and MT-1H isoforms was detected (Fig. 2). Assuming equal efficiencies of the PCR for each MT isoform, examination of the gel profiles also demonstrated that the MT-2A and MT-1X isoforms had the highest, and approximately equal, levels of expression when compared to the MT-1A, MT-1E, and MT-1F isoforms. The relative level of expression of the MT-2A and MT-1X isoforms approximated that of the G3PDH housekeeping gene, but was below that of the -actin housekeeping gene (Fig. 2). An identical analysis of MT isoform-specific mRNA expression on total RNA from the other five samples of human prostate demonstrated very similar results (Table I). The only notable exception was that the MT1F isoform was only expressed in 1 of the 6 specimens. Determination of the MT-1/2 protein content of the six normal prostate specimens by immunoblot demonstrated a range of MT-1/2 expression that varied from a low of 2.97 ± 0.19 ng MT/g total protein to a high of 8.71 ± 0.13 ng MT/g total protein (Table I).Fig. 2. Basal MT gene expression determined by RT-PCR, using total RNA from a normal human prostate. Total RNA was purified from human prostate tissue and subjected to RT-PCR using primers specific for: G3PDH, -actin, MT-1A, MT-1B, MT-1E, MT-1F, MT-1G, MT-1H, MT-1X, and MT-2A. Reactions were sampled at 25, 30, 35, and 40 cycles, and the products were visualized on 2% agarose gels containing 0.25 µg per ml ethidium bromide.MT Isoform Gene Expression in Three Human Prostate Cancer Cell Lines If the regulation of MT-1 and MT-2 gene expression is altered among individual prostate cancers, it was reasoned that this would be reflected in cell lines derived from prostate cancer. An analysis of MT-1 and MT-2 isoform-specific gene expression patterns proved this hypothesis to be correct. While the pattern of basal expression of the MT isoforms in the Du-145 cell line was similar to that found for the normal prostate, with the MT-1A, MT-1E, MT-1F, MT-1X, and MT2A genes being expressed, this was not true for the PC-3 and LNCaP cell lines (Table I). Specifically, for the PC-3 cell line, no mRNA representing the MT-1A and MT-1E isoform was noted, and in the LNCaP cell line, no expression of the MT-1E isoform was found. In all three prostate cancer cell lines, expression of the MT-1F isoform was clearly detectable, while only 1 of 6 normal prostate samples was noted to express this isoform. Also, the relative level of mRNA for the MT2A isoform was elevated in all three cell lines when compared to the other MT isoforms. Surprisingly, an analysis of MT-1/2 protein expression demonstrated no clear correlation between the pattern of MT-1 and MT-2 isoform mRNA expression and the amount ofMT Gene Expression in Human ProstateTABLE I. Basal MT Expression in Normal Prostate Tissues and Cancer Cell Lines* Tissue 1 2 3 4 5 6 Cell lines DU-145 PC-3 LNCaP G3PDH (30) 11,939 5,620 7,977 6,802 10,294 5,125 (25) 4,379 5,461 4,943 ND ND ND -actin (25) 5,458 2,351 3,372 3,458 5,045 3,931 1A (40) 4,809 4,358 3,657 3,894 4,263 3,788 (40) 7,707 − 6,495 − − − 1B − − − − − − 1E (40) 5,260 9,036 4,987 9,382 9,238 4,659 (35) 9,934 − − 1F (40) 4,862 − − − − − (40) 6,179 5,581 3,054 − − − − − − 1G − − − − − − 1H − − − − − − 1X (35) 9,383 8,329 7,128 8,807 9,464 5,593 (35) 9,294 9,323 9,014 2A (35) 8,810 1,952 8,721 8,406 9,518 16,962 (30) 6,647 8,567 9,665131MT protein 5.30 ± 0.28 2.97 ± 0.19 3.94 ± 0.25 8.71 ± 0.13 6.48 ± 0.01 7.84 ± 0.541.62 ± 0.41 0.92 ± 0.08 0.00a*Sample 1 is depicted in Figure 2. MT protein, ng MT-1⁄2 protein/g total protein. ND, not determined. Number of reaction cycles in parentheses. Isoform expression is in units of optical density. a Below detection limit (0.05 ng/g protein).total cellular MT-1/2 protein (Table I). While the PC-3 and Du-145 prostate cancer cell lines accumulated similar amounts of MT-1/2 protein, the LNCaP cell line displayed MT-1/2 protein levels that were below the limit of detection (<0.05 ng MT/g total protein). MT Isoform Gene Expression in Five Advanced Cases of Human Prostate Cancer The patterns of MT-1 and MT-2 gene expression were also determined on paraffin-embedded tumor samples from 5 patients with advanced-stage prostate cancer. Due to the focal nature of prostate cancer, microdissection of the paraffin-embedded specimens was used to minimize any contamination of the samples with normal tissue. The MT immunoreactivity and area chosen for microdissection were documented for each sample (Fig. 3). In all 5 cases, MT staining intensity was increased compared to normal prostate. In sample 1, MT-1/2 staining was +1 within the cytoplasm of most cells, with occasional cells demonstrating intense (+4) immunoreactivity and nuclear localization. In sample 2, immunoreactivity ranged from +1–+3 and displayed cell to cell variability in both the glandular, cribriform, and micropapillary areas. There were occasional profiles of nuclear localization. In sample 3, immunoreactivity was very strong (+2–+4) and demonstrated some cell to cell variability. There were occasional profiles of nuclear localization. In sample 4, MT-1/2 staining was weak to moderate, with a large degree of cell to cell variability. Only occasional nuclear staining was present. In sample 5, immunoreactivity was intense (+2–+4), with minimal cell to cell variability and only occasional profiles of nuclear localization. The most striking feature of the molecular analysis for MT gene expression was thatnone of the tumor samples expressed mRNA corresponding to the MT-1X gene (Table II). That this was not an artifact of the assay system was confirmed by demonstrating the generation of an MT-1X reaction product in the tumor samples when these samples were “spiked” with total RNA from the normal prostate samples. The expression of MT-2A was demonstrated in all the prostate cancer samples, and the level of expression was similar to that of the -actin housekeeping gene. The expression of MT-1A and MT-1E mRNA was variable among the samples, with 2 samples expressing MT-1A and 3 samples expressing MT-1E. In both instances, expression was far less than that of the -actin housekeeping gene, differing by 10 PCR cycles. All 5 cases were negative for the expression of the MT-1B, 1F, 1G, and 1H isoforms. DISCUSSION The retrospective analysis of MT expression by immunohistochemical methods in a variety of human tumors has demonstrated an association of MT overexpression with the type and grade of tumor. As reviewed by Jasani and Schmid [6], MT overexpression appears to be predominantly associated with the more malignant, higher-grade tumors in ductal breast cancer, skin carcinomas, melanomas, cervical carcinomas, acute lymphoblastic leukemia, and pancreatic carcinomas. In contrast, for colonic, bladder, and fibroblastic skin tumors, MT overexpression is associated with more differentiated lower-grade tumors. The MT antibody (E-9) used in the majority of these studies for immunocytochemical detection of tumor-associated MT overexpression is well-characterized for specificity, and it is known that it is unable to distinguish between the MT-1 and MT-2 isoforms and unable to distinguish between the metal saturated and metal。