Changes in land surface temperatures and NDVI values
全球海洋热浪的多时间尺度变化特征及气候调控因子分析

张小娟, 郑飞. 2022. 全球海洋热浪的多时间尺度变化特征及气候调控因子分析[J]. 气候与环境研究, 27(1): 170−182. ZHANG Xiaojuan,ZHENG Fei. 2022. Analysis of Multi-time Scale Variation Characteristics and Climate Regulation Factors on Global Marine Heatwaves [J]. Climatic and Environmental Research (in Chinese), 27 (1): 170−182. doi:10.3878/j.issn.1006-9585.2021.21061全球海洋热浪的多时间尺度变化特征及气候调控因子分析张小娟 1, 2 郑飞11 中国科学院大气物理研究所国际气候与环境研究中心,北京 1000292 中国科学院大学,北京 100049摘 要 基于1982~2019年美国国家海洋和大气管理局(National Oceanic and Atmospheric Administration,NOAA )日最优插值海表温度(Daily Optimum Interpolation Sea Surface Temperature V2, OISST )观测资料和物理实验室(Physical Sciences Laboratory, PSL )多种气候观测指数,采用最小二乘回归、高低通滤波和相关分析等统计方法,分析了全球海洋热浪(Marine Heatwaves, MHWs )频次、持续时间、总天数和最大强度的多时间尺度演变特征及不同气候信号对其演变的调控。
研究表明,MHWs 频次在赤道西太平洋线性增长最快。
在去除全球变暖趋势后,全球平均MHWs 各属性年际和年代际变化均存在明显区域变化特征,主导区域也均受到多时间尺度气候信号的调制。
气候变化和人类活动对西南喀斯特地貌区植被NDVI变化相对作用
第29卷第3期2022年6月水土保持研究R e s e a r c ho f S o i l a n d W a t e rC o n s e r v a t i o nV o l .29,N o .3J u n .,2022收稿日期:2021-04-16 修回日期:2021-05-22资助项目:广西自然科学资助项目 气候变化和人类活动对西南喀斯特地貌区植被覆盖变化相对作用研究 (2020G X N S F B A 297160);广西空间信息与测绘重点实验室资助课题(191851016);桂林理工大学科研启动资助项目(G U T Q D J J 2019172);2021年大学生创新创业训练计划项目(202110596006,202110596785) 第一作者:徐勇(1988 ),男,湖南省益阳市人,博士,讲师,主要从事气候变化和植被N D V I 反演的研究㊂E -m a i l :y o n gx u @g l u t .e d u .c n 气候变化和人类活动对西南喀斯特地貌区植被N D V I 变化相对作用徐勇1,2,黄雯婷2,卢梦缘2,欧昱贤2,张占奕2,李明杰2,郭振东2,马瑞雪2(1.桂林理工大学广西空间信息与测绘重点实验室,广西桂林5410062.桂林理工大学测绘地理信息学院,广西桂林541006)摘 要:定量厘定气候变化和人类活动对西南喀斯特地貌区植被N D V I 变化的相对作用,可为揭示喀斯特地貌区植被N D V I 时空演变特征及其驱动机制提供依据㊂以MO D I SN D V I ㊁S R TM D E M ㊁基于站点的气象数据为数据源,建立T h e i l -S e n M e d i a n 斜率估计㊁残差分析㊁相对作用分析等多数学模型,分析了2001 2019年西南喀斯特地貌区气候变化和人类活动对植被N D V I 变化的相对作用,揭示植被N D V I 与降水㊁气温㊁相对湿度和日照时数的相关性㊂结果表明:研究时段内西南喀斯特地貌区植被N D V I 总体上呈上升态势,植被N D V I 变化趋势呈现明显的空间异质性,植被N D V I 增加的区域面积远大于减少的区域面积;研究区植被改善和植被退化均受人类活动的主导㊂研究时段内西南喀斯特地貌区植被N D V I 与降水㊁气温以及相对湿度整体呈正相关,相关程度依次递减,与日照时数呈负相关㊂综上可知,研究时段内西南喀斯特地貌区植被覆盖呈改善态势,人类活动可被认为是影响西南喀斯特地貌区植被N D V I变化的主要驱动力,植被N D V I 与降水㊁气温㊁相对湿度和日照时数的相关系数在空间上呈现明显的异质性㊂关键词:西南喀斯特地貌区;植被N D V I;气候变化;人类活动;相对作用中图分类号:Q 948 文献标识码:A 文章编号:1005-3409(2022)03-0292-08V e g e t a t i o nC o v e rC h a n g e a n d t h eR e l a t i v eR o l e o fC l i m a t e C h a n ge a n dH u m a nA c t i v i t i e s i nS o u t h w e s tK a r s tA r e a s X U Y o n g 1,2,HU A N G W e n t i n g 2,L U M e n g yu a n 2,O U Y u x i a n 2,Z H A N GZ h a n y i 2,L IM i n g j i e 2,G U OZ h e n d o n g 2,MA Ru i x u e 2(1.G u a n g x iK e y L a b o r a t o r y o f S p a t i a l I n fo r m a t i o na n dG e o m a t i c s ,G u i l i nU n i v e r s i t y o f T e c h n o l o g y ,G u i l i n ,G u a n g x i 541006,C h i n a ;2.C o l l e g e o f G e o m a t i c s a n dG e o i n f o r m a t i o n ,G u i l i nU n i v e r s i t y o f T e c h n o l o g y ,G u i l i n ,G u a n gx i 541006,C h i n a )A b s t r a c t :S t u d y i n g o nv e g e t a t i o n c o v e r c h a n g e a n d t h e r e l a t i v e r o l e o f c l i m a t e c h a n ge a n d h u m a n a c t i v i t i e s c a n p r o v i d e ab e t t e r u n d e r s t a n d i n gf o r s p a t i o t e m p o r a l v eg e t a t i o nv a r i a t i o na n d th ed ri v i n g me c h a n i s mof c l i m a t e c h a ng e a n dh u m a na c ti v i t i e s t ov e ge t a t i o nv a r i a t i o n i ns o u t h w e s t k a r s t a r e a s ,C h i n a .B a s e do n t h em o d e r a t e r e s o l u t i o n i m a g i n g s p e c t r o r a d i o m e t e r (MO D I S )n o r m a l i z e dd if f e r e n c e v eg e t a t i o n i n d e x (N D V I )t i m e s e r i e s ,d i g i t a l e l e v a t i o nm o d e l d a t a (D E M ),i n s i t u c l i m a t e d a t a u s i n g Th ei l -S e nM e d i a n a n a l y s i s ,M a n n -K e n d a l l s i g-n i f i c a n c e t e s t ,r e l a t i v e a n a l y s i s ,a n d s o o n ,w e a n a l y z e d t h e r e l a t i v e r o l e o f c l i m a t e c h a n ge a n dh u m a n a c t i v i -t i e so nv e g e t a t i o nv a r i a t i o n ,e x p l o r e dt h ec o r r e l a t i o nc o ef f i c i e n t sb e t w e e n N D V Ia n dc l i m a t ev a r i a b l e s i n s o u t h w e s t k a r s t a r e a s ,C h i n a f r o m2001t o 2019.T h e r e s u l t s s h o w e d t h a t f r o m2001t o 2019,t h e v eg e t a t i o n c o v e r p r e s e n t e d a nu p w a r d t r e n d i n s o u th w e s t k a r s t a r e a s .T h e s p a ti a l p a t t e r no f v e g e t a t i o nv a r i a t i o n e x h i b i -t e do b v i o u s s p a t i a l h e t e r o g e n e i t y a n d t h e a r e a sw i t h v e g e t a t i o n i m pr o v e m e n tw e r e g r e a t e r t h a n t h e a r e a sw i t h v e g e t a t i o nd e g r a d a t i o n .F u r t h e r m o r e ,t h er e l a t i v er o l eo fh u m a na c t i v i t i e so nv e g e t a t i o ni m pr o v e m e n ta n dv e g e t a t i o nd e g r a d a t i o nw a s h i g h e r t h a n t h e r e l a t i v e r o l e o f c l i m a t e c h a n g e o nv e g e t a t i o nv a r i a t i o n.T h e v e g e-t a t i o n c o v e rw a s p o s i t i v e l y a n dm o s t s i g n i f i c a n t l y a s s o c i a t e dw i t h p r e c i p i t a t i o n,f o l l o w e db y t e m p e r a t u r e a n d r e l a t i v eh u m i d i t y b u tn e g a t i v e l y a s s o c i a t e d w i t hs u n s h i n ed u r a t i o ni ns o u t h w e s tk a r s ta r e a sf r o m2001t o 2019.T h e s e r e s u l t s i n d i c a t e d t h a t b o t h t h e v e g e t a t i o n i m p r o v e m e n t a n d v e g e t a t i o nd e g r a d a t i o nw e r e d o m i n a-t e db y h u m a n a c t i v i t i e s,a n d t h e c o r r e l a t i o n c o e f f i c i e n t b e t w e e nN D V I a n d c l i m a t e v a r i a b l e s e x h i b i t e d s i g n i f i-c a n t r e g i o n a l d i f f e r e n c e s i n s o u t h w e s t k a r s t a r e a s i n t h e s t u d yp e r i o d.K e y w o r d s:s o u t h w e s t k a r s t a r e a s;N D V I;c l i m a t e c h a n g e;h u m a na c t i v i t i e s;r e l a t i v e r o l e喀斯特地貌区作为中国四大生态环境敏感区之一,地质构造复杂㊁地貌类型多变,加上受区域气候和人类活动的双重作用,部分地区生态环境日益恶化,石质荒漠化已经成为制约区域经济发展和生态文明建设的重要因素[1-3]㊂因此,在喀斯特地貌区开展生态环境监测及生态质量评价,对推动喀斯特地貌区的生态恢复具有重要现实意义㊂植被作为生物圈的重要组成部分,可以有效地反映区域的生态状况,对生态环境变化具有良好的指示作用[4-9]㊂传统的植被生长监测主要为地面实测法,但该方法通常需要大量的人力物力,且易受时间空间限制,难以进行大尺度植被生长监测㊂20世纪以来,得益于遥感产业的蓬勃发展,海量的遥感数据为大面积植被生长监测提供了多源数据支持,遥感监测成为全球和地区生态环境监测的重要技术手段之一[10-12]㊂归一化植被指数(N o r m a l i z e dD i f f e r e n c eV e g e t a t i o n I n d e x,N D V I)常被用来反演植被的覆盖程度,能在不同的时间和空间尺度上反映植被状况,因而被广泛应用于植被覆盖格局时空演变特征研究及植被生长监测中[13-18]㊂近年来,已有许多国内外学者使用遥感技术在不同时空尺度上对植被覆盖动态变化及影响因素方面进行了研究,气候变化作为影响植被生长和空间分异的驱动力受到广泛关注[19-25]㊂随着学者对植被覆盖动态变化及其驱动力研究的不断深入,针对西南喀斯特地貌区植被覆盖动态变化及其驱动力方面的研究也取得了一系列成果,肖建勇等[26]研究表明喀斯特地区植被空间分异受气候变化和人类活动的影响强于非喀斯特地区,丁文荣等[27]研究发现滇东南喀斯特地貌区植被改善受气候变化和人类活动的双重作用,且表现出较强的地域分布差异㊂张凯选等[28],吕妍等[29],也对西南喀斯特地貌区植被覆盖变化及其成因进行了分析,发现除了气候变化外,植被覆盖还受非气候因子的影响㊂在已有研究中,对气候变化的影响研究较多,且主要集中于降水和气温两种气象要素对植被生长的驱动,没有考虑日照时数和相对湿度等气象因子对区域植被生长状况的影响,在一定程度上降低了研究结果的精度;对人类活动和植被生长之间的响应机制的研究大都停留在定性描述层面,人类活动对喀斯特地貌区植被N D V I变化的驱动机制尚不明确,且并未定量厘定各驱动力对植被覆盖变化的影响㊂因此,本文基于2001 2019年MO D I S N D V I时间序列㊁S R T M D E M数据㊁降水㊁气温㊁相对湿度和日照时数时间序列,通过建立T h e i l-S e n M e d i a n斜率估计模型㊁M a n n-K e n d a l l显著性检验模型㊁残差分析模型和相对作用分析模型等,厘清气候变化和人类活动对西南喀斯特地貌区植被N D V I变化的影响,进一步明晰西南喀斯特地貌区植被覆盖在气候变化和人类活动驱动下的时空演变机制,研究结果对喀斯特地貌区生态环境评估和保护㊁资源的合理开发和利用以及石漠化研究和防治具有重要的现实和科学意义㊂1数据来源及研究方法1.1研究区概况研究区位于中国西南部,区域范围在20ʎ54' 34ʎ19'N,97ʎ21' 112ʎ04'E㊂在行政区划上,包含 西南三省一区一市 ,即四川省㊁云南省㊁贵州省㊁广西壮族自治区以及重庆市,总面积为137.63万k m2㊂研究区内最高海拔为6304m,最低海拔为-20m,地势起伏较大(图1)㊂研究区内地貌类型复杂,从西部青藏高原向东部丘陵平原地区过渡,喀斯特地貌分布广泛㊂气候类型主要包括热带季风和亚热带季风气候,大部分地区冬暖夏热,年平均气温在-3~24ħ,年日照时数在752.6~ 3504.9h;年均降水量在340~2300m m,自东南向西北递减,雨热同季期,降水充沛,为植被的生长提供了有利条件㊂此外,该地区经济发展较为缓慢,是 西部大开发战略 的重要发展区域之一㊂1.2数据来源与处理本研究采用的N D V I时间序列来自美国国家航空航天局发布的MO D13A C6产品数据集,数据的时间分辨率和空间分辨率分别为1月和1k m,本研究采用2001年1月至2019年12月逐月MO D I S392第3期徐勇等:气候变化和人类活动对西南喀斯特地貌区植被N D V I变化相对作用N D V I 时间序列,数据集不需要进行大气校正等预处理,发布的产品数据集已经消除了水㊁云㊁重气溶胶和云影等对数据带来的偏差㊂图1 研究区高程及其气象站点空间分布气象数据共选取了研究区及其周围155个气象站点的逐日气象数据㊂气象数据来自中国气象数据网(h t t p :ʊd a t a .c m a .c n ),数据经过严格的精度控制,质量良好㊂为了减少地理位置信息对气象数据插值精度的影响,选用A N U S P L I N 插值软件引入D E M 作为协变量对气象数据进行空间内插,D E M 数据来源于中国科学院资源环境科学与数据中心,数据的空间分辨率为1k m ,投影系统与气象因子数据集一致㊂1.3 研究方法1.3.1 T h e i l -S e n M e d i a n 斜率估计和M a n n -K e n d a l l 显著性检验 T h e i l -S e n M e d i a n 斜率估计常用来探究某长时间序列变量随时间的变化态势㊂本文采用T h e i l -S e n M e d i a n 斜率估计[30]探究研究时段内西南喀斯特地貌区植被N D V I 的变化趋势,揭示其在时间尺度上的变化特征㊂T h e i l -S e n M e d i a n 趋势分析计算公式如下:βN D VI =M e d i a n (N D V I j -N D V I i j -i ),1ɤi <j ɤn (1)式中:i 和j 代表年份;N D V I i 代表在第i 年的植被N D V I 值;N D V I j 代表在第j 年的植被N D V I 值;βN D V I 代表研究时段内植被N D V I 的变化斜率;当βN D V I >0时,说明研究时段内植被N D V I 呈上升趋势,植被覆盖有所改善,当βN D VI =0时,说明研究时段内植被N D V I 保持不变,植被覆盖较为稳定,当βN D V I <0时,说明研究时段内植被N D V I 呈下降趋势,植被覆盖有所退化㊂为定性区分研究时段内植被N D V I 变化趋势,使用M a n n -K e n d a l l 显著性检验法进行判别[27,30]㊂对于给定显著性水平α,当|Z |>Z 1-α/2,代表植被N D V I 时间序列在给定显著性水平α上变化显著,反之,则认为其在给定显著性水平α上变化不显著㊂本文定义变化斜率在给定显著性水平α=0.05下显著时,为显著变化;在α=0.01下显著时,为极显著变化㊂1.3.2 多元线性回归分析和残差分析 植被群落的时空演变受区域气候条件和人类活动强度的共同影响,本研究通过构建多元回归分析模型和残差分析模型,定量厘定气候变化和人类活动对植被N D V I 变化的影响[11,31]㊂首先,基于研究时段内植被N D V I观测值(N D V I O b s ,下同)㊁降水㊁气温㊁相对湿度和日照时数时间序列,构建多元一次线性回归模型,获得单独气候变化影响的植被N D V I 预测值(N D V I P r e ,下同)时间序列;然后,基于植被N D V I O b s 与植被N D V I P r e 时间序列,构建残差分析模型,获得单独人类活动影响的植被N D V I 残差值(N D V I R e s ,下同)时间序列;当N D V I P r e >0时,说明气候变化对植被N D V I 的上升起到了积极的作用;当N D V I P r e =0,说明气候变化对植被N D V I 影响甚微;当N D V I P r e <0时,说明气候变化对植被N D V I 的上升起到了抑制作用㊂同理,可得出人类活动对植被N D V I 变化的影响㊂1.3.3 相对作用分析法 本文使用相对作用分析法来定量区分气候变化和人类活动对植被N D V I 变化的相对作用[32]㊂主要思路为:首先,基于植被N D V I O b s 时间序列,获得2001 2019年植被N D V I O b s 的变化斜率,即βN D V I O b s ㊂定义βN D VI O b s 大于0的区域为植被改善区,βN D V I O b s 小于0的区域为植被退化区;接下来,计算植被N D V I P r e 和N D V I R e s 的时间序列的变化斜率即βN D V P r e 和βN D V I R e s ;最后,基于βN D V I P r e 和βN D V I R e s 的取值区间,构建气候变化和人类活动驱动下植被N D V I 变化的6种情境㊂具体如表1所示㊂1.3.4 相关分析 基于相关分析法,得到研究区植被生长与气温㊁降水㊁相对湿度和日照时数的相关性,探究植被N D V I 对各气象因子变化的响应程度㊂具体公式如下[11]:R x y =ðni =1(x i -x )(y i -y )ðni =1(x i -x )2ðni =1(y i -y )2(7)式中:R x y 为x 与y 之间的相关系数,相关系数大,则代表x 与y 存在较强的相关性;n 表示研究时段的总年492 水土保持研究 第29卷数;i表示第i年;x与y分别为n年x和y的平均值㊂为揭示植被N D V I变化和气候变化的最大响应关系,本文通过计算植被N D V I与同期及前1 3月气象因子相关系数,然后选取4个相关系数中的最大值来实现㊂表1不同情景下气候变化和人类活动对植被N D V I变化作用大小的定量分离方法参数βN D V I P r eβN D V I R e s气候变化的相对作用[ˑ100%]人类活动的相对作用[ˑ100%]说明植被改善情境1>0>0ΔN D V I P r eΔN D V I P r e+ΔN D V I R e sΔN D V I R e sΔN D V I P r e+ΔN D V I R e s气候变化和人类活动共同促进植被覆盖改善,以其各自N D V I变化量所占百分比为各自相对作用情境2>0<010气候变化综合作用导致植被覆盖改善情境3<0>001人类活动综合作用导致植被覆盖改善植被退化情境1<0<0ΔN D V I P r eΔN D V I P r e+ΔN D V I R e sΔN D V I R e sΔN D V I P r e+ΔN D V I R e s气候变化和人类活动共同促进植被覆盖减少,以其各自N D V I变化量所占百分比为各自相对作用情境2<0>010气候变化综合作用导致植被覆盖退化情境3>0<001人类活动综合作用导致植被覆盖退化式中:ΔN D V I P r e是t+1时刻气候变化所造成的N D V I P r e与t时刻N D V I P r e的差值;ΔN D V I R e s是t+1时刻人类活动所造成的N D V I R e s与t时刻N D V I R e s的差值㊂2结果与分析2.1植被N D V I时空演变特征由图2可知,研究时段内研究区植被N D V I年平均值在0.757~0.802之间,最大值出现在2018年,最小值出现在2001年㊂研究区植被N D V I整体呈现波动上升趋势,上升速率为0.0025/a㊂由上可知,近19a来,西南喀斯特地貌区植被N D V I整体得到改善㊂但在2011年㊁2014年㊁2016年植被N D V I值出现明显下降趋势,其中以2011年的下降趋势最为显著㊂研究区在2010年㊁2013年㊁2015年均遭受了大范围且程度严重的自然灾害,其中2010年西南地区出现了近50a来最严重的干旱[33-34],极端天气等自然灾害的发生,会对植被活动产生负面影响,是导致西南喀斯特地貌区部分年份植被N D V I下降的主要原因㊂图22001-2019年西南喀斯特地貌区植被N D V I时间变化特征尽管西南喀斯特地貌区植被N D V I状况总体趋于好转且植被N D V I年际差异较小,但植被N D V I 变化存在明显的空间异质性㊂由图3看出,研究时段区域内植被N D V I呈上升态势的区域面积大于呈下降态势的面积,分别占研究区总面积的86.25%和13.75%,其中,极显著上升(p<0.01)的区域约占研究区总面积的35.33%,主要分布在横断山脉以东地区,包括四川东北部㊁重庆东部㊁贵州西部和广西中西部等㊂极显著下降(p<0.01)和显著下降(p<0.05)的区域仅占研究区总面积的1.82%,零星分布在城市中心区和旅游业发达地区㊂近年来,随着经济的快速发展,在城市扩张㊁城市基础设施建设㊁工业化发展和旅游资源开发的综合作用下,以上城市及其周边地区以及各旅游开发区植被覆盖呈下降趋势[26]㊂图32001-2019年西南喀斯特地貌区植被N D V I变化趋势2.2植被改善区气候变化和人类活动的相对作用大小本文中提到的植被改善区是指βN D V I O b s>0的区域,人类活动对研究区植被改善区的相对作用略大于气候变化,人类活动对植被改善区的相对作用平均值592第3期徐勇等:气候变化和人类活动对西南喀斯特地貌区植被N D V I变化相对作用为55.13%,气候变化对植被改善区相对作用平均值为44.87%(图4)㊂2001 2019年人类活动是研究区植被改善的主要驱动力㊂以人类活动为主(相对作用大于50%)导致植被改善的区域面积占总改善面积的54.97%,主要分布于四川东南部㊁重庆南部㊁贵州北部和中部㊁广西北部和西南部以及云南东南部和西部;而以气候变化为主导致植被改善的区域占总改善区域的45.03%,主要分布在云贵川三地接壤处㊁广西南部㊁重庆大部分地区以及四川北部㊂从空间分布格局来看,气候变化和人类活动对研究区植被改善区的相对作用在空间上呈交错格局㊂植被覆盖呈极显著上升的地区同样受人类活动的主导㊂图42001-2019年西南喀斯特地貌区气候变化和人类活动在植被改善区域的相对作用2.3植被退化区气候变化和人类活动的相对作用大小气候变化和人类活动对西南喀斯特地貌区大部分地区植被生长具有促进作用,但也导致局部植被活力呈下降趋势㊂与植被改善区相对应,植被退化区是指βN D V I O b s<0的区域㊂2001 2019年人类活动和气候变化对西南喀斯特地貌植被退化区的相对作用分别为54.57%和45.43%(图5),由此可知,人类活动是引起研究区植被退化的重要驱动力㊂气候变化和人类活动共同导致研究区局部地区的植被呈退化趋势,但两者相对作用大小存在较大空间差异㊂以气候变化为主导致植被退化的区域面积占总退化面积的42.96%,主要分布于重庆与四川交汇地区㊁云南中部㊁广西东部和中部;以人类活动为主导致植被退化的区域面积占总退化面积的57.04%,主要分布在四川中西部㊁四川和重庆交界处以及贵州中部和云南中部㊂以人类活动为主导致研究区植被呈退化的面积占极显著下降与显著下降面积的50%以上㊂3讨论3.1气候变化影响下植被N D V I时空演变特征在区域和全球尺度上,植被生态系统时空演变特征及空间分布格局很大程度上受到气候变化的影响㊂通过多元线性回归法,得到研究区植被N D V I P r e时间序列,对西南喀斯特地貌区植被N D V I P r e变化趋势作进一步分析,获得气候变化影响下植被N D V I空间演变特征,结果见图6㊂气候变化影响下,植被N D V I 呈退化态势的面积远小于植被呈改善态势的面积,植被呈改善态势的区域占81.06%,其中呈显著上升和极显著上升的区域占31.90%,主要分布在云贵川三地接壤处㊁广西中部和南部以及四川和重庆北部㊂显著下降和极显著下降的区域仅占2.91%,零散分布于云贵川三省和重庆㊂图52001-2019年西南喀斯特地貌区气候变化和人类活动在植被退化区域的相对作用图62001-2019年西南喀斯特地貌区植被N D V I预测值变化趋势3.2植被N D V I对气候变化的响应关系气候变化通过多种气象因子的动态变化和相互作用影响植被的生长㊂本文通过分析植被N D V I与前0 3月降水㊁气温㊁相对湿度和日照时数的相关系数,然后利用绝对值最大值合成法得到两者之间的最大相关系数,以此得到植被N D V I对各气象因子变692水土保持研究第29卷化的最大响应,揭示各气象因子对植被N D V I变化的驱动㊂总体上,降水㊁气温和相对湿度对研究区植被生长具有正向促进作用,而日照时数对研究区植被生长具有负向抑制作用㊂其中,植被N D V I与气温㊁降水和相对湿度的平均最大相关系数依次降低,分别为0.174,0.171和0.081,与日照时数的平均最大相关系数为-0.046㊂综上可知,气温㊁降水和相对湿度能够促进研究区植被的生长,而日照时数抑制了研究区植被的生长㊂植被N D V I与各气象因子的相关性呈现明显的地域差异㊂研究区大部分地区植被生长受降水㊁气温和相对湿度的正向影响,与之相反,研究区大部分地区植被生长受日照时数的负向影响㊂超过78%的区域植被N D V I与降水呈正相关关系,其中,通过p< 0.05显著性检验的区域占10.51%,如图7A所示,主要分布在重庆北部以及四川东北部㊂超过76%的区域植被N D V I与气温呈正相关关系,其中,通过p<0.05显著性检验的区域占13.23%,如图7B所示,主要分布在四川北部㊁重庆北部㊁云南西南部以及云南㊁四川㊁贵州三省交界处㊂超过60%的区域植被N D V I 与相对湿度呈正相关关系,其中,通过p<0.05显著性检验的区域占9.10%,如图7C所示,主要分布在重庆南部㊁四川南部㊁云南南部㊁贵州北部和广西中南部㊂超过58%的区域植被N D V I与日照时数呈负相关关系(图7D),其中,通过p<0.05显著性检验的区域占3.37%,主要分布在重庆以及四川㊁重庆㊁贵州三省交界处,抑制作用自西向东呈现上升的趋势㊂由相关分析结果可知,2001 2019年西南喀斯特地貌区植被N D V I与降水㊁气温以及相对湿度整体呈正相关,且与气温的相关性最强,而西南喀斯特地貌区植被N D V I与日照时数呈负相关㊂由上可知,西南喀斯特地区气候变化对植被生长既有正向促进作用,又有负向抑制作用,且影响程度呈明显的空间分异特征㊂图7西南喀斯特地貌区植被N D V I与气象因子相关显著性3.3人类活动影响下植被N D V I时空演变特征植被生长与气候变化和人类活动有着密不可分的联系㊂本文利用残差分析得到西南喀斯特地貌区研究时段植被N D V I R e s,并根据时间序列计算得到其变化趋势,得到人类活动影响下的植被变化趋势的空间差异,如图8所示㊂2001 2019年西南喀斯特地貌区植被N D V I R e s的变化趋势表现出明显的空间分异性,呈现出 东南高,西北低 的分布特征㊂植被N D V I R e s呈上升趋势和下降趋势的面积分别占82.86%和17.14%㊂综上所述,区域植被生长受到人类活动正向促进和负向抑制的双重影响,整体上对区域植被生长的正向促进作用占主要地位㊂受人类活动的影响,12.45%的地区植被N D V I呈极显著上升,分布在云南东南部㊁重庆东南部㊁广西北部以及贵州大部分地区,这一定程度上得益于当地森林保护工程的实施以及自然环境的科学保护[35-37]㊂在研究区内,零散的分布着植被N D V I残差变化趋势小于0的区域,有约0.73%的区域呈现显著下降和极显著下降,大多数分布在城市中心地区以及其周边邻近地区㊂3.4植被N D V I对人类活动的响应关系近19a来,随着西南喀斯特地貌区生态保护的推进,西南喀斯特地貌区各省区植被覆盖度都有不同程度的增加,尤其是进入21世纪以来,国家高度重视西南石漠化的防治,把西南喀斯特地貌区的石漠化治理提升到了国家目标高度[38],一系列生态工程的实施对植被恢复起着至关重要的作用㊂广西的林业工程和云南的退耕还林工程,不仅改善了区域植被覆盖,同时还大大改善了区域生物群落生存环境[35,39];西南地区生态林业工程的实施,如天然林资源保护工程和退耕还林工程,在一定程度上增强了土地抵御灾害的能力,有效地降低了区域石漠化程度,提升了区域植被覆盖[40]㊂792第3期徐勇等:气候变化和人类活动对西南喀斯特地貌区植被N D V I变化相对作用图82001-2019年西南喀斯特地貌区植被N D V I残差值变化趋势与生态工程的正向促进作用相对,人类社会在快速发展中对资源的不合理利用也是影响区域植被整体覆盖状况的重要原因㊂例如,四川省西北部畜牧业的快速发展对当地生态环境造成了一定的破坏,致使部分地区植被严重减少[41],同时,人口密度的不断增长和城市化进程的不断加快,也一定程度上抑制了植被群落的繁衍进程;2002 2019年,云南省人口比重增长超过20%,经济增长和城镇人口的不断攀升致使城镇建设用地面积不断扩大,最终导致部分地区植被覆盖呈下降趋势㊂综上可知,生态林业工程的实施使得植被覆盖整体呈上升态势,但人类在发展经济中的不合理开发对部分地区植被生长的抑制作用同样不可忽略㊂4结论(1)研究时段内西南喀斯特地貌区植被N D V I 整体呈上升态势,且上升态势呈 东南高西北低 的分布格局㊂植被N D V I呈上升趋势的面积远大于呈下降趋势的面积,呈上升趋势的区域主要分布在研究区东南部㊂(2)西南喀斯特地貌区植被改善区和植被退化区受人类活动作用均强于气候变化,其中,人类活动对研究区植被改善和植被退化的相对作用分别为55.13%和54.57%㊂因此,人类活动被认为是驱动西南喀斯特地貌区植被N D V I变化的主导因素㊂(3)植被N D V I和气象因子相关性呈现明显的空间异质性㊂气候变化对研究区植被N D V I变化具有双重影响,研究区植被N D V I与降水㊁气温和相对湿度整体上呈正相关关系,而与日照时数整体上呈负相关关系㊂参考文献:[1]陈洪松,聂云鹏,王克林.岩溶山区水分时空异质性及植物适应机理研究进展[J].生态学报,2013,33(2):317-326. [2]宋同清,彭晚霞,杜虎,等.中国西南喀斯特石漠化时空演变特征㊁发生机制与调控对策[J].生态学报,2014,34(18):5328-5341.[3]李建明,王志刚,王爱娟,等.退耕还林恢复年限对岩溶槽谷区石漠化土壤物理性质的影响[J].农业工程学报, 2020,36(1):99-108.[4] C h e nT,D e J e uR A M,L i uY Y,e t a l.U s i n g s a t e l l i t eb a s e d s o i lm o i s t u r e t o q u a n t i f y t h ew a t e r d r i v e n v a r i a b i l-i t y i nN D V I:Ac a s es t u d y o v e rm a i n l a n d A u s t r a l i a[J].R e m o t eS e n s i n g o fE n v i r o n m e n t,2014,140:330-338.[5] G e r i sJ,T e t z l a f fD,M c D o n n e l l JJ,e ta l.S p a t i a l a n dt e m p o r a l p a t t e r n so fs o i lw a t e rs t o r a g ea n dv e g e t a t i o nw a t e r u s e i nh u m i dn o r t h e r nc a t c h m e n t s[J].S c i e n c eo f t h eT o t a l E n v i r o n m e n t,2017,595:486-493. [6] H u a n g S,H u a n g Q,L e n g G,e t a l.V a r i a t i o n s i n a n n u a lw a t e r-e n e r g y b a l a n c e a n d t h e i r c o r r e l a t i o n sw i t hv e g e t a-t i o na n d s o i lm o i s t u r e d y n a m i c s:Ac a s e s t u d y i n t h eW e iR i v e rB a s i n,C h i n a[J].J o u r n a lo f H y d r o l o g y,2017, 546:515-525.[7] N e m a n iR R,K e e l i n g C D,H a s h i m o t o H,e ta l.C l i-m a t e-d r i v e ni n c r e a s e si n g l o b a lt e r r e s t r i a ln e t p r i m a r yp r o d u c t i o n f r o m1982t o1999[J].S c i e n c e,2003,300(5625):1560-1563.[8] P e n g S,P i a oS,C i a i sP,e ta l.A s y mm e t r i ce f f e c t so fd a y t i m ea n d n i g h t-t i me w a r m i n g o n N o r t h e r n H e m i-s p h e r e v e g e t a t i o n[J].N a t u r e,2013,501(7465):88-92.[9]彭文甫,张冬梅,罗艳玫,等.自然因子对四川植被N D V I变化的地理探测[J].地理学报,2019,74(9):1758-1776.[10] B r a s w e l l B,S c h i m e l DS,L i n d e rE,e t a l.T h e r e s p o n s e o fg l o b a l t e r r e s t r i a l e c o s y s t e m s t o i n t e r a n n u a l t e m p e r a t u r e v a r-i a b i l i t y[J].S c i e n c e,1997,278(5339):870-873.[11]马瑞雪.西南地区植被覆盖时空演变特征及其驱动力分析[D].桂林理工大学,2021.[12]徐勇,奚砚涛,刘欣婷.2000 2013年江苏省植被覆盖度时空变化特征[J].西南农业学报,2016,29(2):437-444. [13]刘明星,李长春,李振海,等.基于高光谱遥感与S A F Y模型的冬小麦地上生物量估算[J].农业机械学报,2020,51(2):192-202,220.[14]孙华林,耿石英,王小燕,等.晚播条件下基于高光谱的小麦叶面积指数估算方法[J].光谱学与光谱分析,892水土保持研究第29卷。
基于NDVI的植被物候变化及其与气候因子之间的关系

摘要植被物候是气候变化的敏感指示器,其变化直接反映了植被生长对气候变化的响应。
植被物候的研究对于了解全球气候变化对陆地生态系统的影响具有重要意义。
本文基于GIMMS NDVI3g v1数据集,采用Polyfit-Maximum(PM)方法提取1982-2015年植被生长季开始日期(SOS)、植被生长季结束日期(EOS)和植被生长季长度(LOS),并分析SOS、EOS和LOS时空变化特征。
结合同期气象数据,分析SOS与气候因子(温度和降水)的关系,探索SOS对气候变化的响应机制。
1.欧亚大陆中东部地区不同气候带植被物候的趋势及其转变模式1982-2015年欧亚大陆中东部地区总体及其四个气候带(寒带、寒温带、温带和青藏高原)SOS均呈现提前趋势,EOS均呈现延迟趋势,LOS均呈现延长趋势。
气候带尺度上,植被物候趋势发生了转变,其模式存在差异。
寒带,温带和青藏高原SOS趋势的转折点(TP)发生在1990s中后期。
TP之后,寒带、温带和青藏高原SOS的提前趋势分别表现为增大、停滞和逆转模式。
寒温带和青藏高原EOS趋势的TP分别发生在1987年和1989年。
寒带和温带EOS趋势的TP分别发生在1995年和1994年。
TP之后,寒带、寒温带、温带和青藏高原EOS的延迟趋势减弱或消失。
LOS趋势及其变化由SOS和EOS 控制,但SOS是主导因素。
植被物候趋势模式的差异反映了气候变化的长期和短期特征以及空间异质性。
2.中国温带草原和荒漠区域春季物候的变化及其敏感性分析1982-2015年中国温带草原和荒漠区域SOS总体上以提前趋势为主,平均速率为0.14 d•a-1。
草甸、草原和荒漠植被SOS分别以0.08d•a-1、0.17d•a-1和0.10d•a-1的速率提前。
空间上,68%的地区呈现提前趋势,32%的地区呈现延迟趋势。
季前平均温度是控制SOS 变化的主要因子,且季前3个月平均温度对SOS影响较大。
SOS分别与季前40d平均温度和季前200d累积降水的相关性最大。
基于Landsat 8数据反演地表发射率的几种不同算法对比分析
收稿日期:2018-07-08 责任编辑:李克永基金项目:国家自然科学基金(41471452);中央高校基本科研业务资助项目(300102269201,300102299206)通信作者:王丽霞(1979-),女,山西大同人,博士,副教授,E mail:zylxwang@chd.edu.cn第39卷 第2期2019年3月西安科技大学学报JOURNALOFXI’ANUNIVERSITYOFSCIENCEANDTECHNOLOGYVol.39 No 2Mar 2019基于Landsat8数据反演地表发射率的几种不同算法对比分析王丽霞1,2,孙津花3,刘 招4,张双成1,杨 耘1(1.长安大学地质工程与测绘学院,陕西西安710054;2.国土资源部退化及未利用土地整治工程重点实验室,陕西西安710075;3.长安大学地球科学与资源学院,陕西西安710054;4.长安大学环境科学与工程学院,陕西西安710054)摘 要:为了分析研究不同地表发射率反演算法的精度和适用性,文中选取西安市的遥感影像Landsat8为基础数据,运用ENVI,ArcGIS等软件,首先对Landsat8数据进行预处理,提取西安市的NDVI影像;然后,建立决策树模型得到西安市地表分类影像,并基于像元二分模型反演得到植被覆盖度,基于NDVI得到4种不同算法的地表发射率;最后,以精度0.01的MODISLSE产品为标准数据,从像元尺度上对比分析了4种算法的精度,并依据回归决策树方法的分类结果,对比分析了不同算法在各类地表覆盖类型上的发射率反演差异。
结果表明:在像元尺度上,植被指数混合模型法与NDVITEM改进算法精度较高且较为接近;从不同下垫面的反演差异来看,在植被区域4种算法之间的差异较小,而对于水体区域,4种算法之间的差异较大;从反演方法的适用性而言,植被指数混合模型法与NDVITEM改进算法较为适合本研究区。
关键词:地表发射率;遥感反演;归一化植被指数;Landsat8数据中图分类号:P237 文献标志码:ADOI:10.13800/j.cnki.xakjdxxb.2019.0220 文章编号:1672-9315(2019)02-0327-07ComparisonofseveraldifferentalgorithmstoretrievelandsurfaceemissivityusingLandsat8dataWANGLi xia1,2,SUNJin hua3,LIUZhao4,ZHANGShuang cheng1,YANGYun1(1.SchoolofGeologyEngineeringandSurveying,Chang’anUniversity,Xi’an710054,China;2.KeyLaboratoryofDegradedandUnusedLandConsolidationEngineering,TheMinistryofLandandResource,Xi’an710075,China;3.SchoolofEarthScienceandResources,Chang’anUniversity,Xi’an710054,China;4.SchoolofEnvironmentalScienceandEngineering,Chang’anUniversity,Xi’an710054,China)Abstract:Inordertoanalyzetheaccuracyandapplicabilityofdifferentsurfaceemissivityinversional gorithms,theLandsat8dataofremotesensingimageryinXi’anwasselected,andsoftwaresuchasEN VIandArcGISwasused.First,theLandsat8dataispreprocessedtoextractNDVIimagesfromXi’an.Then,thedecisiontreemodelisestablishedtoobtainthesurfaceclassificationimageofthecity,theveg etationcoverageisobtainedbasedontheinversionofthepixelbinarymodel,andthesurfaceemissivityoffourdifferentalgorithmsisobtainedbasedonNDVI.Finally,withtheaccuracyof0.01MODISLSEproductsasthestandarddata,theaccuracyofthefouralgorithmsiscomparedandanalyzedfromthepix elscale,andbasedontheclassificationresultsoftheregressiondecisiontreemethod,thedifferencesofemissivityinversionofdifferentalgorithmsondifferenttypesofsurfacecoveragearecomparedandana©博看网 . All Rights Reserved.lyzed.TheresultsindicatethatthevegetationindexhybridmodelmethodandtheNDVITEMimprovedal gorithmaremoreaccurateandclosetoeachotheronthepixelscale.Fromtheinversiondifferenceofdif ferentunderlyingsurfaces,thedifferencebetweenthefouralgorithmsinthevegetationregionissmall.Forthewaterbodyregion,thedifferencebetweenthefouralgorithmsisgreat;fromtheapplicabilityoftheinversionmethod,thevegetationindexhybridmodelmethodandtheNDVITEMimprovedalgorithmaremoresuitableforthestudyarea.Keywords:surfaceemissivity;remotesensinginversion;normalizedvegetationindex;Landsat8data0 引 言地表发射率是遥感数据获取陆面温度中的一个关键参数,它与地表组成成分、地表粗糙度、含水量等因素有关,普遍应用于辐射传输过程和地气系统的能量平衡[1]。
库尔勒市地表温度反演

DOI :10.19392/j.cnki.1671-7341.201921119库尔勒市地表温度反演黄波成都理工大学地球科学学院四川成都610059摘要:地表温度(LST )是地表自然生态环境的一个重要指标,是水平衡和地面能量平衡中的重要参数。
本次研究采用库尔勒市Landsat8第10波段数据,利用单窗算法反演该地区2017年8月7日的地表温度。
得到库尔勒市该日最高温度为56.21ħ,平均温度为38.61ħ。
关键词:Landsat8;单窗算法;库尔勒;地表温度1绪论地表温度(Landsurfacetemperature ,LST )是地表自然生态环境的一个重要指标,是水平衡和地面能量平衡中的重要参数,它影响着地表和大气之间能量互换和水热均衡过程,在地表研究中扮演着主要的作用,在气候气象,农业林业,生态环境,地质和勘察等范畴也有着特别广泛的应用。
近年来对于Landsat 8地表温度的反演也有越来越多的学者参与其中。
现在主要用于地表温度反演的方法基本都是基于物理模型的方法,对于单通道主要有三种,辐射传输方程法、单窗算法、还有普适性单通道算法。
辐射传输方程法,在有实时大气廓线数据时,能使用如今成熟的大气辐射传输模型计算获得大气辐射和大气透过率,然后带入辐射传输方程就能够根据地表发射率和辐射亮度值获得温度。
单窗算法是通过热辐射传输方程,通过各种参数来估算的温度。
普适性单通道算法算法是一种适合任何热红外数据反演温度的方法,该算法只需要大气水汽含量和地表比辐射率两个参数。
2地表温度反演对于本次地表温度反演,研究区为库尔勒市,位于新疆维吾尔自治区的中部,区域位置为东经85ʎ14'10ᵡ-86ʎ34'21ᵡ、北纬41ʎ10'48ᵡ-42ʎ21'36ᵡ。
该市气候特点是暖温带大陆性干旱气候。
研究数据采用在美国地质调查局(USGS )上下载的Landsat8数据,主要采用该数据的第10波段反演温度。
用辐射传输方程从modis数据中反演地表温度的方法
用辐射传输方程从modis数据中反演地表温度的方法地表温度是指地球表面的温度,这一参数对于土地利用、资源与环境等多个领域具有重要意义。
MODIS是一个运行在太阳同步轨道上的传感器,能够提供高质量的地球观测数据,因此可以应用于地表温度反演研究。
本文将介绍从MODIS数据中反演地表温度的方法——用辐射传输方程。
一、地表温度地表温度(Land Surface Temperature,LST)是指地球表面的物体温度。
地表温度反映地表热量平衡状态,同时能够提供地表水文周期(如蒸散发过程)、大气学方面(如湍流输送过程)和地表物理学(如热容和热导率等)重要的信息。
二、辐射传输方程辐射传输方程(Radiative Transfer Equation,RTE)用于描述一束光束通过大气、地表等介质时,光通过某些介质后所产生的轨迹、散射、吸收的变化。
由于地球大气的吸收、散射、反射作用,导致MODIS接收到的辐射并不是来自地表,因此需要通过辐射传输方程反演地表温度。
当地表温度为T,定高角度上的亮温值为L,大气温度为Ta时,辐射传输方程可表示为: $$ L = \frac{ER}{1-\alpha}+\alpha B(Ta)+(1-\alpha)B(T) $$ 其中,$E$为模型能量转移通量,$R$为模型接收光通量。
$\alpha$表示地表反射率,$B(T)$为以$T$为温度的Planck函数,为天体辐射强度。
而$B(Ta)$则为大气温度为Ta时的Planck函数。
公式右边第二项是由于大气温度的辐射贡献而产生的光辐射,而最后一项是地表温度自己的辐射贡献。
三、从MODIS数据中反演地表温度从地球观测卫星MODIS数据中反演地表温度,可以分为以下三个步骤:3.1 获取modis数据MODIS数据可以从NASA网站免费获取。
对于地表温度反演研究,需要获取L1B产品中的通量文件和反射和红外辐射文件。
3.2 估算大气影响估算大气影响包括大气延迟、光学深度和水汽量的估算等,因此需要获取MODIS数据所覆盖区域的大气参数场。
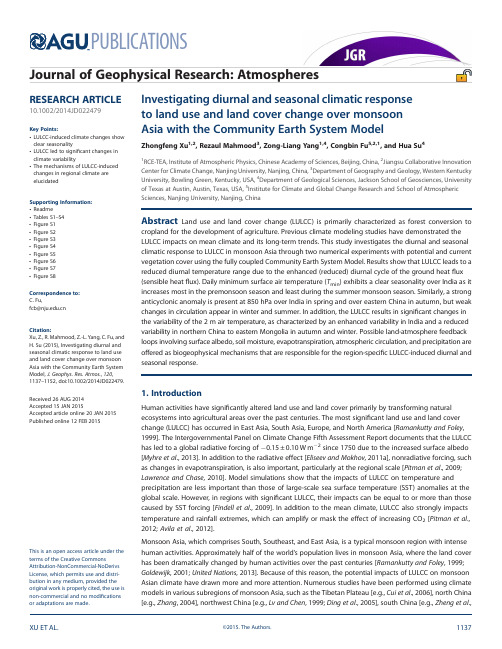
大尺度土地利用对季风区气候变化的影响表现出显著的季节性
Investigating diurnal and seasonal climatic response to land use and land cover change over monsoon Asia with the Community Earth System Model Zhongfeng Xu 1,2,Rezaul Mahmood 3,Zong-Liang Yang 1,4,Congbin Fu 5,2,1,and Hua Su 41RCE-TEA,Institute of Atmospheric Physics,Chinese Academy of Sciences,Beijing,China,2Jiangsu Collaborative Innovation Center for Climate Change,Nanjing University,Nanjing,China,3Department of Geography and Geology,Western Kentucky University,Bowling Green,Kentucky,USA,4Department of Geological Sciences,Jackson School of Geosciences,University of Texas at Austin,Austin,Texas,USA,5Institute for Climate and Global Change Research and School of Atmospheric Sciences,Nanjing University,Nanjing,ChinaAbstract Land use and land cover change (LULCC)is primarily characterized as forest conversion to cropland for the development of agriculture.Previous climate modeling studies have demonstrated the LULCC impacts on mean climate and its long-term trends.This study investigates the diurnal and seasonal climatic response to LULCC in monsoon Asia through two numerical experiments with potential and current vegetation cover using the fully coupled Community Earth System Model.Results show that LULCC leads to a reduced diurnal temperature range due to the enhanced (reduced)diurnal cycle of the ground heat flux (sensible heat flux).Daily minimum surface air temperature (T min )exhibits a clear seasonality over India as it increases most in the premonsoon season and least during the summer monsoon season.Similarly,a strong anticyclonic anomaly is present at 850hPa over India in spring and over eastern China in autumn,but weak changes in circulation appear in winter and summer.In addition,the LULCC results in signi ficant changes in the variability of the 2m air temperature,as characterized by an enhanced variability in India and a reduced variability in northern China to eastern Mongolia in autumn and winter.Possible land-atmosphere feedback loops involving surface albedo,soil moisture,evapotranspiration,atmospheric circulation,and precipitation are offered as biogeophysical mechanisms that are responsible for the region-speci fic LULCC-induced diurnal and seasonal response.1.Introduction Human activities have signi ficantly altered land use and land cover primarily by transforming natural ecosystems into agricultural areas over the past centuries.The most signi ficant land use and land coverchange (LULCC)has occurred in East Asia,South Asia,Europe,and North America [Ramankutty and Foley ,1999].The Intergovernmental Panel on Climate Change Fifth Assessment Report documents that the LULCChas led to a global radiative forcing of À0.15±0.10W m À2since 1750due to the increased surface albedo[Myhre et al .,2013].In addition to the radiative effect [Eliseev and Mokhov ,2011a],nonradiative forcing,suchas changes in evapotranspiration,is also important,particularly at the regional scale [Pitman et al .,2009;Lawrence and Chase ,2010].Model simulations show that the impacts of LULCC on temperature andprecipitation are less important than those of large-scale sea surface temperature (SST)anomalies at theglobal scale.However,in regions with signi ficant LULCC,their impacts can be equal to or more than thosecaused by SST forcing [Findell et al .,2009].In addition to the mean climate,LULCC also strongly impactstemperature and rainfall extremes,which can amplify or mask the effect of increasing CO 2[Pitman et al .,2012;Avila et al .,2012].Monsoon Asia,which comprises South,Southeast,and East Asia,is a typical monsoon region with intensehuman activities.Approximately half of the world ’s population lives in monsoon Asia,where the land coverhas been dramatically changed by human activities over the past centuries [Ramankutty and Foley ,1999;Goldewijk ,2001;United Nations ,2013].Because of this reason,the potential impacts of LULCC on monsoonAsian climate have drawn more and more attention.Numerous studies have been performed using climatemodels in various subregions of monsoon Asia,such as the Tibetan Plateau [e.g.,Cui et al .,2006],north China[e.g.,Zhang ,2004],northwest China [e.g.,Lv and Chen ,1999;Ding et al .,2005],south China [e.g.,Zheng et al .,PUBLICATIONSJournal of Geophysical Research:AtmospheresRESEARCH ARTICLE10.1002/2014JD022479Key Points:•LULCC-induced climate changes showclear seasonality•LULCC led to signi ficant changes inclimate variability•The mechanisms of LULCC-inducedchanges in regional climate areelucidated Supporting Information:•Readme •Tables S1–S4•Figure S1•Figure S2•Figure S3•Figure S4•Figure S5•Figure S6•Figure S7•Figure S8Correspondence to:C.Fu,fcb@ Citation:Xu,Z.,R.Mahmood,Z.-L.Yang,C.Fu,andH.Su (2015),Investigating diurnal andseasonal climatic response to land useand land cover change over monsoonAsia with the Community Earth SystemModel,J.Geophys.Res.Atmos.,120,1137–1152,doi:10.1002/2014JD022479.Received 26AUG 2014Accepted 15JAN 2015Accepted article online 20JAN 2015Published online 12FEB 2015This is an open access article under the terms of the Creative Commons Attribution-NonCommercial-NoDerivs License,which permits use and distri-bution in any medium,provided the original work is properly cited,the use is non-commercial and no modi fications or adaptations are made.2002a,2002b],India[e.g.,Sud and Smith,1985;Douglas et al.,2006,2009;Sen Roy et al.,2007,2011],East Asia [Zhang and Gao,2009],Southeast Asia[e.g.,Delire et al.,2001],and Asia[Takata et al.,2009]over the recent decades.Different from these earlier studies,especially Zhang and Gao[2009]and Takata et al.[2009],our focus here is on the entire monsoon Asian region,using a significantly more sophisticated climate system model with afiner spatial resolution and with explicit ocean-atmosphere interactions.Many of previous modeling studies on the climatic effects of land cover change did not consider ocean-atmosphere interactions [e.g.,Fu,2003;Findell et al.,2009;Pitman et al.,2009;Avila et al.,2012;Boisier et al.,2012],but recent works suggest that the ocean-atmosphere coupling effect may modulate the magnitude of the climate response to LULCC[Delire et al.,2001;Davin and de Noblet-Ducoudré,2010;Ma et al.,2012].Using the National Center for Atmospheric Research(NCAR)Community Climate System Model(CCSM)with fully dynamic atmosphere, ocean,sea ice,and land surface(vegetation),Notaro et al.[2011]examined the response of global monsoons to an idealized reduction in the vegetation fraction.Their results show that the East Asian monsoon season occurs earlier in the year,while the change in the Indian monsoon is weak.Lawrence and Chase[2010]simulated the impacts of LULCC on the global climate in terms of changes in temperature,precipitation,energy,and the hydrological budget over different regions using the CCSM version3.In this study,we investigate the LULCC impacts on the monsoon Asian climate by generally following the experimental design of Lawrence and Chase[2010].However,our simulations use the Community Earth System Model(CESM),which includes the updated representation of the land surface as the Community Land Model version4(CLM4).Compared to the earlier CLM3,which was used in CCSM3in Lawrence and Chase [2010],CLM4better simulates soil moisture dynamics,surface albedo,and soil temperature[Lawrence et al., 2011].In addition,our analysis focuses on the diurnal and seasonal response of the monsoon Asian climate to LULCC,with an in-depth investigation of biogeophysical feedbacks involving land cover,soil moisture,surface albedo,soil temperature,and atmospheric circulation,an important topic that has not been thoroughly addressed in previous studies.2.Methodology2.1.Model DescriptionThis study uses CESM version1[Gent et al.,2011].CESM is a fully coupled Earth system model comprising four separate models that simultaneously simulate the Earth’s atmosphere,ocean,land surface,and sea ice. The atmospheric model is the Community Atmosphere Model(CAM)with the Lin-Roodfinite volume core [Lin,2004]and26vertical layers.The horizontal grid resolution was set to2.5°×1.875°.The ocean component is the Parallel Ocean Program version2[Smith et al.,2010],which is a three-dimensional general ocean circulation model.The land surface model is the Community Land Model version4(CLM4),with15vertical levels for vegetated,wetland,and glacier land units and10vertical levels for lakes.CLM4includes15plant functional types,as well as bare ground,lakes,and glaciers.Each vegetation type has its own leaf and stem areas,root distributions,optical properties,and canopy top and bottom heights[Dai et al.,2003].CLM4 does not differentiate the types of crops.All types of crops are given the same parameters.CLM4includes improved soil evaporation and snow parameterizations compared with its predecessor.These updates result in more realistic soil moisture dynamics,snow cover,soil temperature in organic-rich soils,and albedos in forests and grasslands[Lawrence et al.,2011].The sea ice component is the Community Ice Code,which is a dynamic-thermodynamic model that includes a subgrid-scale ice thickness distribution[Bitz et al.,2001; Lipscomb,2001].CESM and its predecessors,the Community Climate System Model(CCSM),have been widely used to study the paleoclimate and climate of the recent past and to project future climate change.The fully coupled CCSM3greatly improves South Asian monsoon rainfall relative to the atmosphere model(CAM3) due to the presence of thermodynamic air-sea coupling over the South Asia region[Meehl et al.,2006]. In comparison with CCSM3,CCSM4produces more realistic simulations of soil water from one season to the next,which improves the simulation of the latent heatflux in the dry and transitional seasons [Gent et al.,2011].The seasonality of LULCC-induced changes in the surface air temperature and land-atmosphere interactions are closely related to the precipitation and soil moisture climatology,which is elucidated in the next section.In addition,the intraseasonal and interannual variabilities in the Asia-Australian monsoon in CCSM4are improved relative to CCSM3[Meehl et al.,2012].The improvements in the simulatedTable1.LULCC-Induced Fractional Change in CLM Plant Functional Types(CurVeg-PotVeg)Over the Land Area in India (10–30°N,70–90°E)and in Eastern China(20–50°N,105–125°E)aPFT India Eastern China BareÀ5.15À1.72 Needleleaf evergreen temperate treeÀ0.73À15.19 Needleleaf evergreen boreal tree0.00À0.49 Needleleaf deciduous boreal tree0.000.00 Broadleaf evergreen tropical treeÀ3.07À0.23 Broadleaf evergreen temperate treeÀ0.25À0.44 Broadleaf deciduous tropical treeÀ38.21À1.29 Broadleaf deciduous temperate treeÀ6.20À15.58 Broadleaf deciduous boreal tree0.00À2.16 Evergreen temperate shrub0.000.00 Deciduous temperate shrubÀ4.10À0.66 Deciduous boreal shrub0.00À0.04C3grass arctic0.00+0.02C3grass nonarcticÀ0.04+7.11C4grass+3.65+5.71 Crop+46.71+20.79 Urban+7.40+4.16a Only the grid cells over land with surface pressure higher than850hPa were included in the statistics. precipitation,soil water,and monsoon variabilities provide more confidence for investigating the impacts of LULCC on Asian climate using CESM.2.2.Experimental DesignTo examine the effect of large-scale LULCC on monsoon Asia climate,two experiments were conducted using the fully coupled CESM.Thefirst experiment(PotVeg)was driven by potential vegetation cover data,and the second(CurVeg)was driven by current vegetation cover data.The potential vegetation distribution data were provided by Lawrence and Chase[2010]and were derived from the global land cover change data created by Ramankutty and Foley[1999].In the CurVeg experiment,a remote sensing vegetation map valid in 2000from Moderate Resolution Imaging Spectroradiometer data was used.In this study,the vegetation types and their fractional cover do not change with time;the leaf area index(LAI)varies monthly but not interannually.The soil color,soil texture,and areal percentages of lakes and glaciers in each grid cell are identical in all of the experiments.The ocean model was initialized from the present-day oceanic temperature and salinity conditions and from a state of rest.Both simulations were integrated for100years.Note that the deep ocean requires hundreds of years to reach an equilibrium state,but the upper ocean can reach equilibrium within a few decades.Investigating interannual variability requires the upper ocean be in a reasonable state of equilibrium[Kantha and Clayson,2000].In our simulations,the annual mean SST can reach equilibrium within10–20years in the western Pacific and northern Indian Oceans,which is generally consistent with previous studies[e.g.,Abe et al.,2003;Wohlfahrt et al.,2004;Kioth,2004].Deep soil moisture takes approximately30years to reach equilibrium in eastern China and India(not shown).Therefore,thefirst 40years of the simulations were discarded for spin-up purposes.Table1shows the fractional changes in various plant functional types(PFTs)between the current and potential vegetation maps over India and eastern China.In India,the loss of natural PFTs is dominated by decreases in broadleaf deciduous tropical trees,and cropland increases by approximately47%.In eastern China,the primary loss of natural PFTs is due to the losses of needleleaf evergreen temperate trees and broadleaf deciduous temperate trees by approximately15%,respectively.Consequently,cropland increases by approximately21%.These changes in PFTs are generally consistent with those in Lawrence and Chase [2010].As a result of these PFTs’changes,LAI shows a remarkable decrease over eastern China,the Indo-China peninsula,and India(Figure1).The decrease in LAI is greater in India than in eastern China throughout the year because a higher percentage of forest is converted into cropland in India than in China(Tables1and S1 in the supporting information).The needleleaf evergreen temperate trees have a smaller albedo than the broadleaf deciduous tropical trees.As a result,the LULCC leads to a larger increase in surface albedo in eastern China than in India(Table S2).2.3.Data and Statistical MethodThe National Centers for Environmental Prediction (NCEP)–National Center for Atmospheric Research(NCAR)reanalysis data [Kalnay et al .,1996]and Climatic Research Unit (CRU)data [Harris et al .,2014]were used to validate the performance of CESM in simulating monsoon Asian climate.The statisticalsigni ficance of the difference in the time series between the CurVeg and PotVeg experiments wasevaluated using the Student ’s t test,which takes the serial correlation into account [Zwiers and vonStorch ,1995].A field signi ficance test [Livezey and Chen ,1983;Elmore et al .,2006]was employed toevaluate the collective signi ficance of the differences between two spatial distributions.The F test wasemployed to examine the signi ficance of differences in the standard deviations between the CurVeg andPotVeg experiments.3.Results3.1.Evaluation of the Simulated Climate in Monsoon AsiaA 100year modern day CESM simulation was produced,and the last 60years were compared with observationsor the NCEP-NCAR reanalysis data.CESM well reproduces the spatial patterns of sea level pressure and 850hPavector winds over monsoon Asia.A high-pressure system is centered over the Asian continent in winter,which is associated with northerly winds over East Asia and easterly winds over South Asia;a reversedpattern occurs in summer (Figure S1).In spring and autumn,the 850hPa circulation is generally weakerthan in winter and summer in both the NCEP-NCAR reanalysis and CESM simulations.CESM can reasonablysimulate the Asian monsoon circulation and precipitation in a way similar to CCSM4[Meehl et al .,2012].However,relative to the NCEP-NCAR reanalysis wind,CESM displays signi ficant biases in monsooncirculation (Figure S1),as characterized by overestimated 850hPa wind speeds over monsoon Asia inwinter,spring,and autumn.Similar to its predecessors,CESM does a fairly good job in reproducing the annual cycle of precipitation inmonsoon Asia and the timing of the monsoon onset [Meehl et al .,2006;Notaro et al .,2011;Lee et al .,2013],but signi ficant precipitation biases are noted.For example,in comparison with CRU data,the simulatedprecipitation is underestimated by 0.02mm d À1(2.5%)over eastern China in winter but is overestimatedby 1.33,0.95,and 0.75mm d À1(41%,20%,and 38%)in spring,summer,autumn,respectively.Over India,the precipitation is overestimated by 0.01,2.00,1.64,and 0.55mm d À1(2.3%,35%,74%,and 56%)inspring,summer,autumn,and winter,respectively.CESM captures the annual cycle of T max ,T min ,and diurnaltemperature range (DTR)over both India and eastern China (Figure S2).However,the simulated T max is lowerthan CRU data by about 2°C throughout the year,and the simulated T min is signi ficantly higher than CRUby 2–4°C in India throughout the year (Figure S2c).As a result,DTR is underestimated by 1–4°C in India(Figure S2e).In eastern China,the simulated T min is signi ficantly higher than CRU data by 2–3°C from April toSeptember but is lower by 1–2°C in winter (Figure S2d).The errors in the DTR are generally smaller in easternChina than in India (Figures S2e andS2f).Figure 1.LULCC-induced changes (CurVeg-PotVeg)in leaf area index (LAI)in (a)winter (December-January-February)and(b)summer (June-July-August).3.2.Diurnal and Seasonal Climatic Response to LULCC3.2.1.Surface Air TemperatureLULCC leads to a signi ficant decrease in T max by 1–1.5°C in eastern China in both winter and summer(Figures 2a and 2b).A weak decrease (increase)in T max is found in India in winter (summer)(Figures 2a and2b).In contrast,T min is signi ficantly increased by 0.5–1°C (0.5–1.5°C)in eastern China and 0.5–3°C (0.5–2°C)inIndia in winter (summer)(Figures 2c and 2d).The magnitude of the change in the daily mean air temperatureis similar to that in T max and T min but closer to that in T min (not shown),suggesting that the nighttimetemperature increase plays a more important role than the daytime temperature decrease in determining thechange in the daily mean air temperature.A signi ficant decrease in the DTR is found over India and easternChina in both seasons due to the signi ficant increase in T min and the decrease (or weak increase)in T max .Thechanges in T min and DTR are larger over India in winter than in summer (Figures 2c –2f).To examine the time dependence of LULCC-induced changes in the surface climate,the annual cycle of thechanges in T max ,T min ,T2m,and DTR over India and eastern China were assessed.In India,the LULCC-inducedchange in T max is weak throughout the year (Figure 3a).However,the LULCC leads to a signi ficant increaseinFigure 2.Difference in the 2m air temperature (°C)between the CurVeg and PotVeg experiments in (a,c,and e)winter(December-January-February)and (b,d and f)summer (June-July-August).T max :daily maximum temperature,T min :dailyminimum temperature,and DTR:diurnal temperature range (°C).The shaded areas denote the signi ficance level of 0.05.All changes in T max ,T min ,and DTR have a field signi ficance level of 0.05.T min throughout the year.The change in T min shows a clear seasonality characterized by signi ficant warming(1.5°C)in spring and a smaller warming (0.5°C)in summer.The annual cycle of the daily mean T2m basicallyfollows that of T min except that the change is smaller.The maximum decrease in the DTR (À1.7°C)appearsin February-March-April and the minimum decrease (À0.4°C)during the Indian summer monsoon season(Figure 3a).In eastern China,the LULCC results in a signi ficant cooling in T max and a signi ficant warming inT min throughout the year.The DTR is reduced by approximately 1°C throughout the year without a clearseasonality (Figure 3b).Kalnay and Cai [2003]also found that LULCC could lead to a decrease in the DTRwhen contrasting reanalysis data with observation data.To investigate the causes of the LULCC-induced changes in the surface air temperature and its seasonality,wecomputed all components of the land surface energy balance equation using the three-hourly output fromthe PotVeg and CurVeg experiments:R a ÀL ↑ÀL ↓ÀÁÀH ÀλE ÀG ¼0(1)The longwave radiation emitted from the land surface can be written as follows:σT 4¼R a þL ↓ÀH ÀλE ÀG (2)where σis the Stefan-Boltzmann constant (5.67×10À8W m À2K À4),T is the land surface temperature(radiative temperature),R a is the absorbed solar radiation at the land surface (ASR),L ↑is the upward longwaveradiation from the surface,L ↓is the downward atmospheric longwave radiation (ALR),H is the sensible heatflux (SH),λE is the latent heat flux (LH),and G is the ground heat flux (GHF).Subsequently,we can determinewhich component(s)of the energy budget is responsible for the change in the land surface temperatureby analyzing changes in the land surface fluxes.A similar approach was employed in Boisier et al .[2012]toattribute changes in the monthly surface air temperature in North America and western Eurasia to changes inthe surface energy budget components.The climatology of land surface fluxes simulated by CESM is important to understand the impact of LULCCon regional climate.We brie fly introduce the climatology of the land surface fluxes before analyzing theLULCC-induced changes.The climatological GHF exhibits a clear diurnal cycle characterized by a downwardheat flux (positive)in the day and an upward heat flux (negative)at night throughout the year (not shown).The downward GHF transfers energy from the land surface into deeper soil,which decreases the land surfacetemperature in the day.The upward GHF transfers energy from deeper soil to the land surface andincreases the land surface temperature at night.The sensible heat flux also shows a similar diurnal cyclebut with an upward (positive)flux during the day and a downward (negative)flux at night (not shown).The positive (negative)SH transfers energy from the land surface (atmosphere)to the atmosphere(land surface),which then cools (warms)the land surface and warms (cools)the atmosphere.We onlydiscuss the climatology of GHF and SH because they are the most important variables regarding thechanges in diurnal cycle of surface air temperature based on the following analysis.The LULCC-induced changes in GHF,SH,LH,ASR,ALR,and their sum over India and eastern China wereassessed.The GHF,SH,and LH were multiplied by À1,respectively,for convenient comparison.Thus,apositiveFigure 3.Annual cycle of the LULCC-induced (CurVeg-PotVeg)change in the daily maximum and minimum 2m air temperature (°C),daily mean temperature,and DTR over the land grid cells (a)in India (10–30°N,70–90°E)and (b)in eastern China (22–40°N,105–120°E).Only the grid cells over land with surface pressures higher than 850hPa were included in the statistics.The open circles indicate differences that reach the signi ficance level of 0.05.(negative)change in the sum of the five variables warms (cools)the land surface based on equation (2).The sum of GHF,SH,LH,ASR,and ALR for both the day and night is positive,indicating a warming of the land surface over India (Figures 4a and 4b).The daytime land surface warming favors an increase in T max at 2m.However,the LULCC-induced decrease in SH (Figure 4a)reduces the energy transfer from the land surface to the atmosphere,thereby reducing T max .As a result,no signi ficant change is found in T max over India (Figure 3a).In eastern China,no signi ficant change is found in land surface temperature;thus,the weakening of SH accounts for the decrease in T max (cooling)throughout the year (Figures 3b and 4c).At night,the sum of GHF,SH,LH,ASR,and ALR is also positive,indicating a land surface warming in eastern China (Figure 4d).In addition,the weakening of the downward sensible heat flux helps maintain the nighttime air temperature and cools the land surface.As a result,T min signi ficantly increases over India and eastern China throughout the year (Figures 3a,3b,4b,and 4d).Clearly,the LULCC-induced subdaily changes in the GHF and SH are signi ficant in both India and eastern China throughout the year and are the primary factors leading to a signi ficant decrease in DTR.Interestingly,the most signi ficant increase in T min over India occurs before the summer monsoon season,with a smaller increase during the summer monsoon season (Figure 3a).A similar seasonality of T2m is also found over western Eurasia,as characterized by the most signi ficant decrease in T2m in spring [de Noblet-Ducoudréet al .,2012].The LULCC leads to an enhanced diurnal cycle of GHF,suggesting that more energy enters deeper soil during the day throughout the year.The energy transmitted to and absorbed by the deeper soils during the day is transferred toward the surface at night,leading to an increased nighttime surface temperature and a reduced DTR [cf.Oke ,1987;Rosenberg et al .,1983].On the other hand,the LULCC leads to a decrease intheFigure 4.Annual cycle of the changes (CurVeg-PotVeg)in the daytime and nighttime fluxes (W m À2)(a,b)in India (10–30°N,70–90°E)and (c,d)in eastern China (20–40°N,105–125°E).Only the grid cells over land with surface pressures higher than 850hPa were included in the statistics.GHF:ground heat flux,SH:sensible heat flux,LH:latent heat flux,ASR:absorbed solar radiation at the land surface,ALR:atmospheric longwave radiation,and sum:sum of the five variables.The GHF,SH,and LH were multiplied by À1,respectively,for convenient comparison.A positive (negative)change warms up (cools)the land surface.The stippled bars indicate differences that reach the signi ficance level of 0.05.Daytime (nighttime):UTC 09(UTC 21)for India and UTC 06(UTC 18)for eastern China.surface roughness length,which enhances the aerodynamic resistance.Consequently,the sensible heatflux shows a weakened diurnal cycle.The reduced downward SH from the atmosphere to the land surface at night is also favorable for maintaining the air temperature.Clearly,the maximum change in GHF and SH appears in spring and accounts for the most significant increase in T min over India in spring(Figures3a and4b).The maximum change in GHF is related to the highest absorbed solar insolation and the driest soil condition in spring(Figure S3).These conditions cause stronger and more effective heat transfer between the land surface and deeper soils,thereby increasing the downward GHF during the day and the upward GHF at night.Previous studies also suggest that drier soil and degradation of vegetation can lead to a reduction in DTR across North Africa and global monsoon regions[Zhou et al.,2007;Notaro et al.,2011].A recent study using observed ground heatflux and radiation data from the Ecosystem Research Network developed by the Chinese Academy of Sciences suggests that the GHF is positively(negatively)correlated with net radiation(soil heat capacity)at the subdaily timescale[Li et al.,2012],which are consistent with our results.Yang et al.[1999]investigated theinfluence of vegetation on ground heatflux by using two land surface models;their study suggested that vegetation dampens the solar radiation at the surface and reduces the amplitude of the diurnal cycle of temperature,which in turn reduces the amplitude of the ground heatflux,and vice versa.LULCC is primarily characterized by a degradation of vegetation,which typically enhances the diurnal cycle of the GHF.The enhanced GHF and reduced SH plays a dominant role in determining T2m at the subdaily time scale in both India and eastern China.However,on the daily mean or longer time scales,the change in the daytime GHF(SH) is partly canceled out by the change in the nighttime GHF(SH).In this case,the changes in other land surface fluxes,such as LH,become important[Lawrence and Chase,2010].3.2.2.Frequency Distribution of Daily2m Air TemperatureTo examine the features of daily air temperature in response to the LULCC,the frequency of the dailyair temperature anomalies in various temperature bins was computed(Figures S4and S5).In India,the frequency distribution of T min is shifted to warmer conditions by roughly2°C in spring and winter and less than1°C in summer and autumn,suggesting the LULCC leads to more warm nights and less cold nights throughout the year.In contrast,the frequency of the daily T max shows either no clear change or a slight shift to the cooler conditions throughout the year.The change in the frequency of T min is related to the changes in the GHF and SH.The frequency of the nighttime GHF shows a clear shift to negative values in all seasons, indicating that the LULCC induces more strong GHF events and less weak GHF events at night,i.e.,favoring a shift in T min toward warmer conditions(not shown).The frequency of the nighttime SH exhibits a positive shift,which is also favorable for the increase in the warmer T min events(not shown).In eastern China,the change in the frequency distribution of the surface air temperature is generally much weaker than that in India(Figures S4and S5).The frequency distribution of T max(T min)shifts to colder (warmer)conditions throughout the year,indicating that the LULCC leads to more cold days and warm nights (Figure S5).The change in the frequency distribution of T max is clearer than that of T min in eastern China,in contrast to that in India.The cold shift in T max is stronger in summer and winter than in spring and autumn in eastern China.The frequency distributions of the GHF and SH are similar to those in India,which result in a shift in T min to the warmer conditions(not shown).However,the warm shift in T min is weaker in eastern China than in India because the LULCC leads to a larger increase in the land surface albedo in eastern China than in India(Table S2).The higher land surface albedo leads to lower daytime land surface temperatures, which partly negates the increase in the GHF and the nighttime land surface temperature.Meanwhile,the enhanced land surface albedo is favorable for the cold shift in the T max distribution.3.2.3.Precipitation and CirculationLULCC leads to a decrease in precipitation over northern India throughout the year with a maximum decrease of1mm dÀ1in August(Figure S6).In terms of the percentage change in precipitation,the maximum decrease(30%)occurs over northern India in spring.However,the changes in precipitation do not reach the field significance level of0.05.The LULCC causes an air temperature increase of0.2–0.4°C from the surface to 850hPa and a decrease of0.2–0.4°C between700hPa and200hPa over India(not shown).The difference between the CurVeg and PotVeg experiments shows a clear anticyclonic circulation anomaly at850hPa over India in spring(Figure5b);the circulation anomaly is associated with a tropospheric anomalous subsidence, which suppresses precipitation(Figures6a and S6c).For the vertical circulation and precipitation,similar responses to the reduced vegetation are also found in autumn by Notaro et al.[2011].The anticyclonic and subsidence anomalies are likely related to the LULCC-induced increase in the surface albedo(Table S2)and。
环境减灾小卫星 (HJ-1B)单窗算法反演地表温度
环境减灾小卫星 (HJ-1B)单窗算法反演地表温度摘要:地表温度是地球环境中的一个重要参数。
针对近年来发射的HJ-1B星的光学和热红外波段,本研究在基于影像的COST模型大气校正基础上,以宁夏为研究区,采用无需大气水汽含量参数的单窗算法反演地表温度,并采用同步的MODIS温度产品进行对比验证,结果表明该法具有<1 K的可信精度。
同时对该法的关键参数地表比辐射率进行了敏感性分析,发现该法对比辐射率不大敏感,其在中等程度的变化时,其误差<0.5 K。
从而说明该法反演地表温度的可靠性,也表明了环境减灾星具有较高精度的探测地表温度的能力。
关键词:大气校正;比辐射率;敏感性分析.中图分类号:TP79 文献标志码:AUSING A MONO-WINDOW ALGORITHM FOR LANDSURFACE TEMPERATURE RETRIEV AL FROM CHINESE SATELLITE FOR ENVIRONMENT AND NATURAL DISASTERMONITORING (HJ-1B) DATAZHAO Shao-Hua1,2, QIN Qi-Ming1, YAO Yun-Jun1,3, LIN You1, JIANG Hong-Bo1,CUI Rong-Bo1 1: Institute of Remote Sensing and GIS, Peking University, Beijing, 100871 2: Environmental Satellite Center, Ministry of Environmental Protection, Beijing, 100029.3: College of Global Change and Earth System Science, Beijing Normal University. Beijing,100875.Abstract:Land surface temperature (LST) is a key parameter in earth environment. Aiming to the latest optical and thermal bands of HJ-1B satellite, the LST retrieval over Ningxia plain is implemented using a mono-window algorithm without atmospheric water vapor content input, based on the COST model for atmospheric correction. Considering the difficulty of obtaining simultaneous ground measured data, the MODIS LST product is adopted as a standard to test the approach. The comparison and validation indicate that this method has good reliability with accuracy of less than 1 K. In addition, the sensitivity analysis is performed for land surface emissivity, and the result shows this variable is not sensitive to LST, because the LST error is less than 0.5 K when it varies at medium level. This study proves that the satellite data has higher availability for detecting LST.Key words: Atmospheric correction; Emissivity; Sensitivity analysis.引言环境与灾害监测预报小卫星A、B星是我国继气象、海洋、国土资源卫星之后一个全新的民用卫星。
- 1、下载文档前请自行甄别文档内容的完整性,平台不提供额外的编辑、内容补充、找答案等附加服务。
- 2、"仅部分预览"的文档,不可在线预览部分如存在完整性等问题,可反馈申请退款(可完整预览的文档不适用该条件!)。
- 3、如文档侵犯您的权益,请联系客服反馈,我们会尽快为您处理(人工客服工作时间:9:00-18:30)。
images contain NDVI images as well as reflectances and radiometric temperatures, from which land surface temperature (LST) can be retrieved (Sobrino & Raissouni, 2000).
Abstract
We used land surface temperature (LST) algorithms and NDVI values to estimate changes in vegetation in the European continent between 1982 and 1999 from the Pathfinder AVHRR Land (PAL) dataset. These two parameters are monitored through HANTS (Harmonic ANalysis of Time Series) software, which allows the simultaneous observation of mean value, first harmonic amplitude and phase behaviors in the same image. These results for each complete year of data show the effect of volcanic aerosols and orbital drift on PAL data. Comparison of time series of HANTS cloud-free time series with the original time series for various land cover proves that this software is useful for LST analysis, although primarily designed for NDVI applications. Comparison of yearly averages of HANTS LST over the whole Europe with air temperature confirms the validity of the results. Maps of the evolution for both parameters between periods 1982/1986 and 1995/1999 have been elaborated: NDVI data show the well confirmed trend of increase over Europe (up to 0.1 in NDVI), Southern Europe seeing a decrease in NDVI (−0.02). LST averages stay stable or slightly decrease (up to −1.5 K) over the whole continent, except for southern areas for which the increasபைடு நூலகம் is up to 2.5 K. These results evidence that arid and semi-arid areas of Southern Europe have become more arid, the rest of Europe seeing an increase in its wood land proportion, while seasonal amplitude in Northern Europe has decreased. © 2006 Elsevier Inc. All rights reserved.
Yves Julien a, José A. Sobrino a,⁎, Wout Verhoef b
a Global Change Unit, University of Valencia, Spain b National Aerospace Laboratory (NLR), Netherlands Received 16 December 2005; received in revised form 23 March 2006; accepted 25 March 2006
Keywords: NDVI; LST; Europe; Pathfinder AVHRR Land dataset; HANTS
1. Introduction
NDVI data collected by AVHRR sensor, aboard NOAA satellites, have been widely used to study vegetation answer to global warning (Bogaert et al., 2002; Myneni et al., 1997; Tucker et al., 2001; Zhou et al., 2003; Zhou et al., 2001), principally through GIMMS (Global Inventory Mapping and Monitoring Studies) dataset. The preference of GIMMS dataset over Pathfinder AVHRR Land (PAL) database is due on one hand to the correction of volcano aerosols (Vermote & El Saleous, 1994) emitted by El Chichón from March to April 1982 and Mount Pinatubo in June 1991, and on the other hand to the correction of the dependence to solar zenith angles (Pinzon et al., 2004). Nevertheless, the authors used PAL images for this work, since GIMMS dataset is limited to NDVI data, while PAL
Remote Sensing of Environment 103 (2006) 43 – 55
/locate/rse
Changes in land surface temperatures and NDVI values over Europe between 1982 and 1999
The PAL dataset used in this present work is composed of 10day composite images. NDVI values during each 10-day period are used for the compositing technique, called Maximum Value Composition (MVC). This technique consists in selecting the highest value of NDVI during each 10-day period for each pixel, which removes most of the cloudy pixels (Holben, 1986). PAL dataset is corrected from atmospheric effects using a Rayleigh correction following the work of Gordon et al. (1988), including a correction for ozone absorption, following McPeters et al. (1993). No geometrical correction was applied to PAL dataset, for the reason that illumination and viewing angle data are not available at continental scale.
44
Y. Julien et al. / Remote Sensing of Environment 103 (2006) 43–55
NDVI values for most of Eurasia between 1981 and 1999, while North America showed a more fragmented pattern of change. This work also pointed out increases in the length of the growing season over Eurasia (18 ± 4 days) as well as North America (12 ± 5 days). Bogaert et al. (2002) evidenced the greening trend over Eurasia as persistent and spatially extensive and connected, while long-term greening trend over North America was more fragmented spatially, with a mixture of short- and long-term greening trends. Zhou et al. (2003) related statistically these changes mainly to climate, except during winter, for which low significances were obtained. These results confirm also the work of Myneni et al. (1997), which linked this increase in vegetation (between 45 and 70°N) with variations in the seasonal cycle of atmospheric CO2. Delbart et al. (2005) pointed out that over boreal regions, methods to determine the length of growing season from NDVI values were inaccurate, and that the use of normalized difference water index (NDWI) should be preferred. As regards European continent, Maselli (2004) evidenced NDVI decreases in a protected coastal area in Italy, especially for the coniferous forest in summer and early fall, which were correlated to winter rainfall decreases.