2012 CDP Report Summary_English
CDP指标的含义

CDP 指标的含义
CDP 指标对广大的投资者来说是一个比较陌生的老指标。
它没有引起投资者的注意主要是在现在市场上的技术分析软件中,没有在静态和动态技术栏中设定,而是在各股的分时走势或 K 线图状态中的分笔或成交明细中隐藏,只有在各股中处于上述状态下,连续按 "+"或 "-" 键才能显现。
同时, 市场上的技术丛书中也无介绍, 从而造成无人问津的境界。
实际上 CDP 技术指标在一个牛皮盘局中是一个较好的高抛低吸的短线操作工具。
该指标与其他技术指标不同之处是没有曲线图表,只有AH 、 NH 、 CDP 、 NL 、 AL 五个数据,其运用法则为:NL 和 NH 是进行短线进出的最佳点位 , 即:投资者想当日卖出时, 把价格定在该股票 CDP 指标中的 NH 值上。
若投资者想低价买入该股票,一般把买入价设在 NL 值上均会成功。
而对波段操作者而言 AH 值和 AL 值是引导进出场的条件。
凡是当天股价向上突破 AH 值时,股价次日还涨,而股价跌破 AL 值时,则股价次日将续跌。
从沪深两市实践中证明每当一个连续下跌中的股票, 若某日该股突破 AH 值时,有 80%的概率是反转信号,若一个连续上涨的股票,某日股价下跌破 AL ,则升势宣告结束 ,因此,该组数据所提供的反转信号要比其它技术指标超前一些。
而 CDP 值只说明股价现阶段的强弱情况, 当股价高于该股 CDP 值时, 现阶段市场偏强。
反之,偏弱。
该技术指标不仅运用简单,并且买卖点位明确,准确率也非常高。
雅虎2012年第二季度财务报告

雅虎2012年第二季度财务报告雅虎2012财年第二季度财报。
报告显示,雅虎第二季度营收为12.18亿美元,较去年同期的12.29亿美元下滑1%;雅虎第二季度净利润为2.27亿美元,较去年同期的2.37亿美元下滑4%。
主要业绩:-雅虎第二季度营收为12.18亿美元,较去年同期的12.29亿美元下滑1%;-雅虎第二季度显示业务营收为5.35亿美元,比去年同期的5.24亿美元增长2%;-雅虎第二季度显示业务营收(不计入流量获取成本)为4.73亿美元,比去年同期的4.67亿美元增长1%;-雅虎第二季度搜索业务营收为4.61亿美元,比去年同期的4.67亿美元下滑1%;-雅虎第二季度搜索业务营收(不计入流量获取成本)为3.85亿美元,比去年同期的3.71亿美元增长4%;-雅虎第二季度其他营收为2.22亿美元,去年同期为2.39亿美元;-雅虎第二季度不计流量获得成本(TAC)营收为10.81亿美元,与去年同期的10.76亿美元基本持平;-雅虎第二季度运营利润为5500万美元,比去年同期的1.91亿美元下滑71%;-雅虎第二季度运营活动产生的现金流为2.75亿美元,比去年同期的3.31亿美元下滑17%。
在截至6月30日的6个月时间里,雅虎运营活动产生的现金流为5.72亿美元,比去年同期的5.36亿美元增长7%;-雅虎第二季度自由现金流为9300万美元,比去年同期的9600万美元下滑25%。
在截至6月30日的6个月时间里,雅虎自由现金流为2.89亿美元,比去年同期的1.52亿美元增长90%;-第二季度归属于雅虎的净利润为2.27亿美元,每股摊薄收益0.18美元。
2011财年第二季度,归属于雅虎的净利润为2.37亿美元,每股摊薄收益0.18美元。
财务分析:雅虎第二季度营收为12.18亿美元,较去年同期的12.29亿美元下滑1%。
雅虎美洲部门第二季度营收为8.22亿美元,去年同期为8.08亿美元。
雅虎EMEA(欧洲、中东和非洲)部门第二季度营收为1.28亿美元,去年同期为1.63亿美元。
思科2012年第二季度财务报告

思科2012年第二季度财务报告思科公司2012年1月28日的2012财年第二季度业绩报告。
报告显示,第二季度净销售额为115亿美元,根据通用会计准则(GAAP)计算的净收入为22亿美元,合每股0.40美元,非GAAP净收入为26亿美元,合每股0.47美元。
“我们本季度业绩表现强劲,实现了创纪录的营收和每股收益,”思科董事会主席兼首席执行官约翰•钱伯斯表示。
“我们的三年计划执行情况非常好,实现了利润增长快于营收增长。
公司运营将继续以产生良好业绩为重点——我们提前一个季度实现了减少十亿美元开支的目标,我们的持续创新也帮助客户解决了关键的业务需求。
你们将会继续看到一个专注的、锐意进取的思科,它将帮助我们的客户利用智能化网络来进行业务转型。
”思科增加季度现金红利思科还宣布,其董事会在2012年2月7日宣布发放每普通股0.08美元的季度红利,比前一季度的红利增长0.02美元。
该红利将在2012年4月25日向所有在2012年4月5日交易日结束之前完成股票登记的持股人支付。
未来红利的发放情况将由董事会来批准。
“我们一如既往地履行我们对股东的承诺,即利用业务中获得的现金来推动股东收益的提升,并结合股票回购、红利发放、并购及研发等来进行,”思科首席财务官Frank Calderoni 说。
“这个季度,随着我们业绩的强势增长,我们很高兴宣布增加我们的红利发放。
今后,我们将继续努力为我们的投资者提供最大的投资回报。
”其他重要业绩数据•2012财年第二季度的运营现金流为31亿美元。
相比之下,2012财年第一季度的运营现金流为23亿美元,2011财年第二季度的运营现金流为26 亿美元。
•截至2012财年第二季度末,公司持有的现金、现金等价物和投资为467亿美元,相比之下,2012财年第一季度末为444亿美元,2011财年末为446亿美元。
•在2012财年第二季度,按照股票回购计划,思科以4.66亿美元的总价回购了2600万股普通股,平均每股回购价格为17.84美元。
波士顿2012全球财富报告

Global Overview
The evolution of private wealth varied considerably by region in 2011, highlighting the difference in how the year’s economic turbulence affected the developed and developing worlds. North America, Western Europe, and Japan all lost private wealth, while the rapidly developing markets in Asia-Pacific and Latin America sustained the double-digit growth that they have experienced in recent years. The Middle East and Africa continued to grow but at a more moderate rate than in previous years, owing particularly to political instability in the region. North America remained the wealthiest region globally, followed by Western Europe and the AsiaPacific (ex Japan) region. Overall, global growth in private wealth is clearly being driven by rapidly developing economies in the “new world,” not by the “old world” of traditional, mature ones. (See
2024年述职报告英语翻译范文

2024年述职报告英语翻译范文2024年述职报告(____字)尊敬的领导:我谨以此报告向您汇报本年度工作情况和成绩,并对接下来的工作提出建议和计划。
在过去的一年里,我全力以赴,努力实现组织的目标,取得了较为显著的成绩。
一、工作简介在过去的一年中,我担任财务部门主管,负责财务规划、预算管理、税务申报、资金筹措和风险管理等方面的工作。
在这一年里,我不仅全面完成了各项工作任务,还通过开展改进措施,提高了工作效率和质量。
二、取得的成绩1. 财务规划和预算管理:准确预测和计划公司财务状况,制定并执行合理的预算,为企业的发展提供了可靠的财务支持。
2. 税务申报:积极配合税务部门,及时准确地完成税务申报工作,确保公司合规运营,并为公司节约了大量税务成本。
3. 资金筹措:与银行和投资者保持良好的合作关系,及时筹集到公司需要的资金,为公司的项目推进和发展提供了坚实的基础。
4. 风险管理:建立健全的风险管理制度,积极预测和应对各类风险,保护公司财务安全,确保公司的正常运营。
三、团队合作我对团队合作的重要性有着清晰的认识,并一直尽力促进团队的协作和共同进步。
在过去的一年中,我与团队成员密切合作,共同解决了许多重要的问题。
我激励团队成员发挥他们的才能,并为他们提供必要的培训和支持。
在团队的努力下,我们成功完成了各项工作任务,为公司的发展做出了重要贡献。
四、存在的问题与改进措施虽然取得了一定的成绩,但我也清楚存在一些问题需要改进:1. 工作效率有待提高:在紧张繁重的工作中,我有时会感到时间不够充裕,工作效率有所下降。
为了提高工作效率,我计划进一步优化工作流程,合理安排工作时间,并积极寻求技术支持。
2. 沟通和协调能力有待提高:在团队合作中,我明显感到自己的沟通和协调能力有待提高。
为了解决这个问题,我打算加强沟通技巧的学习,并参与一些培训和团队合作活动,提高自己的协调能力。
3. 技术知识更新不及时:随着时代的发展,财务领域的知识更新日新月异。
2012政府工作报告中英文(1)

十一届全国人大五次会议5日上午9时在北京人民大会堂开幕,国务院总理温家宝向大会作政府工作报告。
以下为报告实录:各位代表:现在,我代表国务院,向大会报告政府工作,请各位代表审议,并请全国政协委员提出意见。
一、2011年工作回顾过去的一年,面对复杂多变的国际政治经济环境和艰巨繁重的国内改革发展任务,全国各族人民在中国共产党领导下,同心同德,团结奋进,改革开放和社会主义现代化建设取得新的重大成就。
国内生产总值47.2万亿元,比上年增长9.2%;公共财政收入10.37万亿元,增长24.8%;粮食产量1.14万亿斤,再创历史新高;城镇新增就业1221万人,城镇居民人均可支配收入和农村居民人均纯收入实际增长8.4%和11.4%。
我们巩固和扩大了应对国际金融危机冲击成果,实现了“十二五”时期良好开局。
一年来,我们主要做了以下工作:(一)加强和改善宏观调控,遏制物价过快上涨,实现经济平稳较快发展。
我们实施积极的财政政策和稳健的货币政策,坚持正确处理保持经济平稳较快发展、调整经济结构和管理通胀预期的关系,更加注重把握好政策实施的重点、力度和节奏,努力做到调控审慎灵活、适时适度,不断提高政策的针对性、灵活性和前瞻性。
在全球通胀预期不断增强,国际市场大宗商品价格高位波动,国内要素成本明显上升,部分Fellow Deputies,On behalf of the State Council, I now present to you my report on the work of the government for your deliberation and approval and for comments and suggestions from the members of the National Committee of the Chinese People's Political Consultative Conference (CPPCC).I. Review of Work in 2011Last year, China faced a complex and volatile political and economic environment abroad and arduous and challenging reform and development tasks at home. Working hard with one heart and one mind under the leadership of the Communist Party of China (CPC), the Chinese people of all ethnic groups made significant achievements in reform, opening up, and socialist modernization.China's GDP reached 47.2 trillion yuan, an increase of 9.2% over the previous year; government revenue was 10.37 trillion yuan, an increase of 24.8%; and the country's grain output reached a record high of 571.21 million tons. A total of 12.21 million new urban jobs were created. The per capita disposable income of urban residents and the per capita net income of rural residents rose in real terms by 8.4% and 11.4%, respectively. We consolidated and built upon our achievements in responding to the global financial crisis, and got the Twelfth Five-Year Plan period off to a good start.We accomplished the following in our work last year.农产品供给偏紧的严峻形势下,我们把稳定物价总水平作为宏观调控的首要任务,坚持综合施策,合理运用货币政策工具,调节货币信贷增速,大力发展生产,保障供给,搞活流通,加强监管,居民消费价格指数、工业生产者出厂价格指数涨幅从8月份起逐月回落,扭转了一度过快上涨势头。
思科2012年第三季度财务报告
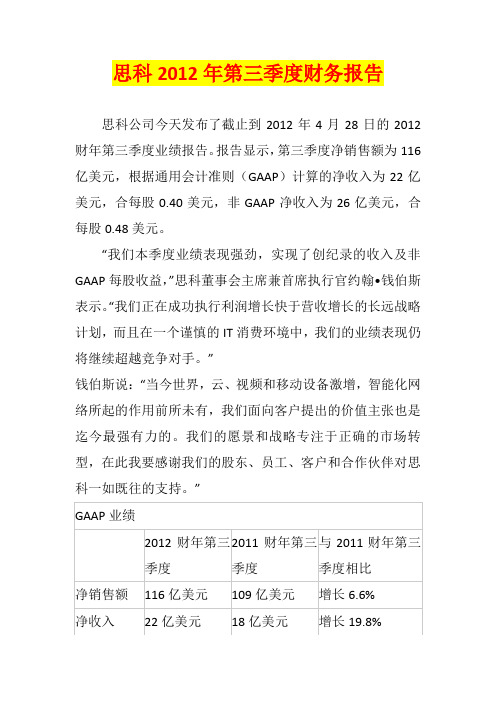
思科2012年第三季度财务报告思科公司今天发布了截止到2012年4月28日的2012财年第三季度业绩报告。
报告显示,第三季度净销售额为116亿美元,根据通用会计准则(GAAP)计算的净收入为22亿美元,合每股0.40美元,非GAAP净收入为26亿美元,合每股0.48美元。
“我们本季度业绩表现强劲,实现了创纪录的收入及非GAAP每股收益,”思科董事会主席兼首席执行官约翰•钱伯斯表示。
“我们正在成功执行利润增长快于营收增长的长远战略计划,而且在一个谨慎的IT消费环境中,我们的业绩表现仍将继续超越竞争对手。
”钱伯斯说:“当今世界,云、视频和移动设备激增,智能化网络所起的作用前所未有,我们面向客户提出的价值主张也是迄今最强有力的。
我们的愿景和战略专注于正确的市场转型,在此我要感谢我们的股东、员工、客户和合作伙伴对思科一如既往的支持。
”2012财年前9个月的净销售额为344亿美元,而2011财年前9个月的净销售额为320亿美元。
2012财年前9个月的净收入按GAAP标准计算为61亿美元,合每股1.13美元;相比之下,2011财年前9个月的净收入按GAAP标准计算为53亿美元,合每股0.94美元。
2012财年前9个月的非GAAP 净收入为75亿美元,合每股1.38美元;相比之下2011财年前9个月的非GAAP净收入为68亿美元,合每股1.22美元。
其他重要业绩数据2012财年第三季度的运营现金流为30亿美元;相比之下,2012财年第二季度的运营现金流为31亿美元,2011财年第三季度的运营现金流为30 亿美元。
截至2012财年第三季度末,公司持有的现金、现金等价物和投资为484亿美元;相比之下,2012财年第二季度末为467亿美元,2011财年末为446亿美元。
在2012财年第三季度,按照股票回购计划,思科以5.5亿美元的总价回购了2700万股普通股,平均每股回购价格为20.28美元。
截至2012年4月28日,从开始实施股票回购计划以来,思科总共以约743亿美元的总价回购和收回了36亿股普通股,平均每股回购价格为20.47美元。
财务报表分析(英文版)答案
Chapter 8Return On Invested Capital And Profitability AnalysisReturn on invested capital is important in our analysis of financial statements. Financial statement analysis involves our assessing both risk and return. The prior three chapters focused primarily on risk, whereas this chapter extends our analysis to return. Return on invested capital refers to a company's earnings relative to both the level and source of financing. It is a measure of a company's success in using financing to generate profits, and is an excellent measure of operating performance. This chapter describes return on invested capital and its relevance to financial statement analysis. We also explain variations in measurement of return on invested capital and their interpretation. We also disaggregate return on invested capital into important components for additional insights into company performance. The role of financial leverage and its importance for returns analysis is examined. This chapter demonstrates each of these analysis techniques using financial statement data.•Importance of Return on Invested CapitalMeasuring Managerial EffectivenessMeasuring ProfitabilityMeasuring for Planning and Control •Components of Return on Invested CapitalDefining Invested CapitalAdjustments to Invested Capital and IncomeComputing Return on Invested Capital•Analyzing Return on Net Operating AssetsDisaggregating Return on Net Operating AssetsRelation between Profit Margin and Asset TurnoverProfit Margin AnalysisAsset Turnover Analysis•Analyzing Return on Common EquityDisaggregating Return on Common EquityFinancial Leverage and Return on Common EquityAssessing Growth in Common Equity•Describe the usefulness of return measures in financial statement analysis. •Explain return on invested capital and variations in its computation.•Analyze return on net operating assets and its relevance in our analysis. •Describe disaggregation of return on net operating assets and the importance of its components.•Describe the relation between profit margin and turnover.•Analyze return on common shareholders' equity and its role in our analysis. •Describe disaggregation of return on common shareholders' equity and the relevance of its components.•Explain financial leverage and how to assess a company's success in trading on the equity across financing sources.1. The return that is achieved in any one period on the invested capital of a companyconsists of the returns (and losses) realized by its various segments and divisions. In turn, these returns are made up of the results achieved by individual product lines and projects. A well-managed company exercises rigorous control over the returns achieved by each of its profit centers, and it rewards the managers on the basis of such results. Specifically, when evaluating new investments in assets or projects, management will compute the estimated returns it expects to achieve and use these estimates as a basis for its decision to invest or not.2. Profit generation is the first and foremost purpose of a company. The effectiveness ofoperating performance determines the ability of the company to survive financially, to attract suppliers of funds, and to reward them adequately. Return on invested capital is the prime measure of company performance. The analyst uses it as an indicator of managerial effectiveness, and/or a measure of the company's ability to earn a satisfactory return on investment.3. If the investment base is defined as comprising net operating assets, then netoperating profit (e.g., before interest) after tax (NOPAT) is the relevant income figure to use. The exclusion of interest from income deductions is due to its being regarded asa payment for the use of money from the suppliers of debt capital (in the same waythat dividends are regarded as a payment to suppliers of equity capital). NOPAT is the appropriate amount to measure against net operating assets as both are considered to be operating.4. First, the motivation for excluding nonproductive assets from invested capital isbased on the idea that management is not responsible for earning a return on non-operating invested capital. Second, the exclusion of intangible assets from the investment base is often due to skepticism regarding their value or their contribution to the earning power of the company. Under GAAP, intangibles are carried at cost.However, if their cost exceeds their future utility, they are written down (or there will be an uncertainty exception regarding their carrying value in the auditor's opinion).The exclusion of intangible assets from the asset base must be based on more substantial evidence than a mere lack of understanding of what these assets represent or an unsupported suspicion regarding their value. This implies that intangible assets should generally not be excluded from invested capital.5. The basic formula for computing the return on investment is net income divided bytotal invested capital. Whenever we modify the definition of the investment base by, say, omitting certain items (liabilities, idle assets, intangibles, etc.) we must also adjust the corresponding income figure to make it consistent with the modified asset base.6. The relation of net income to sales is a measure of operating performance (profitmargin). The relation of sales to total assets is a measure of asset utilization or turnover—a means of determining how effectively (in terms of sales generation) the assets are utilized. Both of these measures, profit margin as well as asset utilization,determine the return realized on a given investment base. Sales are an important factor in both of these performance measures.7. Profit margin, although important, is only one aspect of the return on invested capital.The other is asset turnover. Consequently, while Company B's profit margin is high, its asset turnover may have been sufficiently depressed so as to drag down the overall return on invested capital, leading to the shareholder's complaint.8. The asset turnover of Company X is 3. The profit margin of Company Y is 0.5%. Sinceboth companies are in the same industry, it is clear that Company X must concentrate on improving its asset turnover. On the other hand, Company Y must concentrate on improving its profit margin. More specific strategies depend on the product and industry.9. The sales to total assets (asset turnover) component of the return on invested capitalmeasure reflects the overall rate of asset utilization. It does not reflect the rate of utilization of individual asset categories that enter into the overall asset turnover. To better evaluate the reasons for the level of asset turnover or the reasons for changes in that level, it is helpful to compute the rate of individual asset turnovers that make up the overall turnover rate.10. The evaluation of return on invested capital involves many factors. Theinclusion/exclusion of extraordinary gains and losses, the use/nonuse of trends, the effect of acquisitions accounted for as poolings and their chance of recurrence, the effect of discontinued operations, and the possibility of averaging net income are justa few of many such factors. Moreover, the analyst must take into account the effectsof price-level changes on return calculations. It also is important that the analyst bear in mind that return on invested capital is most commonly based on book values from financial statements rather than on market values. And finally, many assets either do not appear in the financial statements or are significantly understated. Examples of such assets are intangibles such as patents, trademarks, research and development activities, advertising and training, and intellectual capital.11. The equity growth rate is calculated as follows:[Net income – Preferred dividends – Common dividend payout] / Average common equity.This is the growth rate due to the retention of earnings and assumes a constant dividend payout over time. It indicates the possibilities of earnings growth without resort to external financing. The resulting increase in equity can be expected to earn the rate of return that the company earns on its assets and, thus, further contribute to growth in earnings.12. a. The return on net operating assets and the return on common stockholders' equitydiffer by the capital investment base (and its corresponding effects on net income).RNOA reflects the return on the net operating assets of the company whereas ROCE reflects the perspective of common shareholders.b. ROCE can be disaggregated into the following components to facilitate analysis:ROCE = RNOA + Leverage x Spread. RNOA measures the return on net operating assets, a measure of operating performance. The second component (Leverage x Spread) measures the effects of financial leverage. ROCE is increased by adding financial leverage so long as RNOA>weighted average cost of capital. That is, if the firm can earn a return on operating assets that is greater than the cost of the capital used to finance the purchase of those assets, then shareholders are better off adding debt to increase operating assets.13. a. ROCE can be disaggregated as follows:equitycommon Av erage Sales Sales div idends Preferred - income Net ⨯ This shows that “equity turnover” (sales to average common equity) is one of the two components of the return on common shareholders' equity. Assuming a stable profit margin, the equity turnover can be used to determine the level and trend of ROCE. Specifically, an increase in equity turnover will produce an increase in ROCE if the profit margin is stable or declines less than the increase in equity turnover. For example, a common objective of discount stores is to lower prices by lowering profit margins, but to offset this by increasing equity turnover by more than the decrease in profit margin.b. Equity turnover can be rewritten as follows:equitycommon Av erage assets operating Net assets operating Net Sales ⨯ The first factor reflects how well net operating assets are being utilized. If the ratio is increasing, this can signal either a technological advantage or under-capacity and the need for expansion. The second factor reflects the use of leverage. Leverage will be higher for those firms that have financed more of their assets through debt. By considering these factors that comprise equity turnover, it is apparent that EPS cannot grow indefinitely from an increase in these factors. This is because these factors cannot grow indefinitely. Even if there is a technological advantage in production, the sales to net operating assets ratio cannot increase indefinitely. This is because sooner or later the firm must expand its net operating asset base to meet rising sales or else not meet sales and lose a share of the market. Also, financing new assets with debt can increase the net operating assets to common equity ratio. However, this can only be pursued to a point —at which time the equity base must expand (which decreases the ratio).14. When convertible debt sells at a substantial premium above par and is clearly held byinvestors for its conversion feature, there is justification for treating it as the equivalent of equity capital. This is particularly true when the company can choose at any time to force conversion of the debt by calling it in.Exercise 8-1 (35 minutes)a. First alternative:NOPAT = $6,000,000 * 10% = $600,000Net income = $600,000 – [$1,000,000*12%](1-.40) = $528,000Second alternative:NOPAT = $6,000,000 * 10% = $600,000Net income = $600,000 – [$2,000,000*12%](1-.40) = $456,000b. First alternative:ROCE = $528,000 / $5,000,000 = 10.56%Second alternative:ROCE = $456,000 / $4,000,000 = 11.40%c. First alternative:Assets-to-Equity = $6,000,000 / $5,000,000 = 1.2Second alternative:Assets-to-Equity = $6,000,000 / $4,000,000 = 1.5d. First, let’s compute return on assets (R NOA):First alternative: $600,000 / $6,000,000 = 10%Second alternative: $600,000 / $6,000,000 = 10%Second, notice that the interest rate is 12% on the debt (bonds). More importantly, the after-tax interest rate is 7.2% (12% x (1-0.40)), which is less than RNOA. Hence, the company earns more on its assets than it pays for debt on an after-tax basis. That is, it can successfully trade on the equity—use bondholders’ funds to earn additional profits.Finally, since the second alternative uses more debt, as reflected in the assets-to-equity ratio in c, the second alternative is probably preferred. The shareholders would take on additional risk with the second alternative, but the expected returns are greater as evidenced from computations in b.Exercise 8-2 (40 minutes)a. NOPAT = Net income = $10,000,000 x 10% = $1,000,000b. First alternative:NOPAT = $1,000,000 + $6,000,000*10% = $1,600,000Net income = $1,600,000 – ($2,000,000 ⨯ 5% x [1-.40]) = $1,540,000Second alternative:NOPAT = $1,000,000 + $6,000,000*10% = $1,600,000Net income = $1,600,000 – ($6,000,000 ⨯ 6% x [1-.40]) = $1,384,000c. First alternative: ROCE = $1,540,000 / ($10,000,000 + $4,000,000) = 11%Second alternative: ROCE = $1,384,000 / ($10,000,000 + $0) = 13.84%d. ROCE is higher under the second alternative due to successful use ofleverage—that is, successfully trading on the equity. [Note: Asset-to-Equity is1.14=$16 mil./$14 mil. (1.60=$16 mil./$10 mil.) under the first (second)alternative.] The company should pursue the second alternative in the interest of shareholders (assuming projected returns are consistent with current performance levels).a. RNOA = 2 x 5% = 10%b. ROCE = 10% + 1.786 x 4.4% = 17.86%c. RNOA 10.00%Leverage advantage 7.86%Return on equity 17.86%Exercise 8-4 (30 minutes)a. Computation and Interpretation of ROCE:Year 5 Year 9Pre-tax profit margin .......................................................... 0.112 0.109 Asset turnover .................................................................... 0.46 0.44 Assets-to-equity ................................................................. 3.25 3.40 After-tax income retention * .............................................. 0.570 0.556 ROCE (product of above) .................................................. 9.54% 9.07% * 1-Tax rate.ROCE declines from Year 5 to Year 9 because: (1) pre-tax margin decreases by approximately 3%, (2) asset turnover declines by roughly 4.3%, and (3) the tax rate increases by about 3.8%. The combination of these factors drives the decline in ROCE—this is despite the slight improvement in the assets-to-equity ratio.b. The main reason EPS increases is that shareholders had a large amount ofassets and equity working for them. Namely, the company grew while return on assets and return on equity remained fairly stable. In addition, the amount of preferred stock declined, as did the amount of preferred dividends. With this decline in the cost of carrying preferred stock, earnings available to common stock increased.(CFA Adapted)a. RNOA = 3 x 7% = 21%b. ROCE = RNOA + LEV x Spread = 21% + (1.667 x 8.4%) = 35%c. Net leverage advantage to common equityReturn on net operating assets .................................. 21%Leverage advantage .................................................... 14%Return on common equity (rounding difference) ..... 35%Exercise 8-6 (30 minutes)a. At the present level of debt, ROCE = $157,500 / $1,125,000 = 14%.In the absence of leverage, the noncurrent liabilities would be substituted with equity. Accordingly, there would be no interest expense with all-equityROCE without leverage = $184,500 / $1,800,000 = 10.25%.14% with leverage but only 10.25% without leverage.b. NOPAT = $157,500 + [$675,000 x 8% x (1-.50)] = $184,500RNOA = $184,500 / ($2,000,000-$200,000) = 10.25%c. The company is utilizing borrowed funds in its capital structure. Since theROCE is greater than RNOA, the use of financial leverage is beneficial to stockholders. Specifically, the after cost of debt is 4% and the financial leverage (NFO/Equity) is $675,000 / $1,125,000 = 60%. Therefore,ROCE = RNOA + LEV x Spread = 10.25% + 0.60 x (10.25% - 4%) = 14%, as before. The favorable effect of financial leverage is given by the term [0.60 x (10.25% - 4%)] = 3.75%.1. c2. a3. cExercise 8-8 (20 minutes)(Assessments of profit margin and asset turnover are relative to industry norms.)a. Higher profit margin and lower asset turnover.b. Higher asset turnover and lower profit margin.c. Higher profit margin and similar/lower asset turnover.d. Higher asset turnover and similar/lower profit margin.e. Higher asset turnover and lower/similar profit margin.f. Higher asset turnover and similar/higher profit margin.g. Higher asset turnover and lower profit margin.Exercise 8-9 (20 minutes)The memorandum to Reliable Auto Sales President would include the following points:•Both Reliable and Legend Auto Sales are perpetually investing $100,000 in automobile inventory.•Legend Auto Sales is able to generate more profit than Reliable because it is turning over its inventory (10 cars) more often. Specifically, Legend is turning its inventory over 10 times per year while Reliable is turning its inventory over only 5 times per year. Hence, given the same investment in automobile inventory, Legend is twice as profitable as Reliable.•Encourage Reliable to sacrifice some return on each sale to increase the inventory turnover. By slightly reducing price, relative to that charged by Legend, Reliable predictably will find that overall profitability increases. This is because while profit per sale declines, the number of units sold and, therefore, inventory turnover will increase. These factors predictably yield increased return on assets.Computation of Asset (PP&E) Turnover [computed as Sales / PP&E (net)]: Northern: $12,000 / $20,000 = 0.60Southern: $6,000 / $20,000 = 0.30This implies that Northern generates $0.60 in sales per year for each $1 investment in PP&E. In contrast, Southern generates $0.30 in sales per year for each $1 investment in PP&E. This shows that Northern is able to generate twice the return for each $1 invested in PP&E. Assuming equal profit margins, Northern will report a higher return on assets because of the volume of sales that the company is able to generate with its investment in PP&E (at least in the short run).Exercise 8-11 (15 minutes)Low volume operations mean that fixed costs, which in the case of automakers are substantial, must be absorbed by a low number of units produced. Since the lower of cost or market rule implies that inventory cannot be priced higher than expected sales price less costs of disposal plus a normal profit margin, much of that excess cost must be charged to the period incurred. In this case, that means the fourth quarter financial statements absorb much of this cost. This is probably the most likely accounting-based reason for the fourth quarter losses described in the news release.Problem 8-1 (30 minutes)a. 1. Quaker Oats does not reveal its computation of this return. Accordingly, wemake some simple computations and assumptions: (i) For simplicity, focus on one share, (ii) The dividend is $1.56 for Year 11, (iii) The average stock price is $55 and the price increase for Year 11 is $14—based on the beginning price of $48 and the ending price of $62. Using this information, we compute return to a share of stock as follows:= [Dividend per share + Price increase per share] / Average price per share = [$1.56 + $14] / $55= 28.3%However, if we use the beginning price of $48 per share, we get closer to the company's 34% return:= [$1.56 + $14] / $48= 32.4%2. The return on common equity is based on the relation between net incomeand the book value of the equity capital. In contrast, Quaker Oats’ “return t o shareholders” uses dividends plus market value change in relation to the market price per share (cost of investment to shareholders.)b. The company must have derived the 3.6% from price, market, and otherfactors that are not disclosed. Conceptually, this 3.6% should reflect the added risk of an investment in Quaker Oats’ stock vis-à-vis a risk-free security such as a U.S. Treasury bond.c. Quaker does not reveal its computations. It may disclose a variety of interestrates on long-term debt that it carries in the notes to financial statements.Based on data available to it, but not to the financial statement reader, it probably computed a weighted-average interest rate from which it deducted the tax benefit in arriving at the 6.4% cost of debt.a. Computation of Return on Invested Capital Measures:As a first step, we construct the company’s income statement.Sales (500,000 units @ $10). ................................................ $5,000,000 Fixed costs ....................................................................... 1,500,000 Variable costs (500,000 units @ $4). ............................. 2,000,000 Labor costs (20 employees x $35,000). ......................... 700,000 Income before taxes .......................................................... 800,000 Taxes (50% rate) ................................................................. 400,000 Net income .......................................................................... $ 400,000(1) RNOA = [$400,000 + ($2,000,000 x 7.5%)(1-0.50)] / ($8,000,000-$2,00,000)= $475,000 / $6,000,000 = 7.92%(2) ROCE = [$400,000 - ($1,000,000 x 6%)] / $3,000,000 = 11.33%Fixed costs ($1,500,000 x 1.06) ......................................................... 1,590,000 Variable costs ($550,000 units @ $4) .............................................. 2,200,000 Income before labor costs and taxes ............................................. $1,710,000 To obtain a 10% return on long-term debt and equity capital, Zear will need a numerator of $600,000 given an invested capital base of $6,000,000. The required operating income to yield this $600,000 amount is computed as: Net income + Interest expense x (1 - 0.50) = $600,000Net income + ($2,000,000 x 7.5%) x (1-0.50) = $600,000Net income = $525,000Assuming taxes at a 50% rate, Zear needs pre-tax income of $1,050,000, computed as:Income before labor and taxes ............ $1,710,000Labor costs ........................................... ?Pre-tax income ...................................... $1,050,000This implies:Labor costs = $660,000 orAverage wage per worker = $660,000 / 22 employees = $30,000 per employee Since the current salary level is $35,000, Zear cannot achieve its target return level and give a salary raise to its employees.(CFA Adapted)a. ROCE = $1,650 / $3,860 = 42.7%b. NOPAT = ($2,550 + $10) x (1-0.35) = $1,664NOA = $7,250-$3,290 = $3,960RNOA (using year-end NOA balance) = $1,664 / $3,960 = 42%The effect of financial leverage, thus, is only 0.7% as NFO/NFE are insignificant. Most of Merck’s ROCE in this year is derived from operating results.Pre-tax income to sales 0.36Net income to sales 0.23Sales/current assets 1.47Sales / fixed assets 2.97Sales / total assets 0.98Total liabilities / equity 0.88L-T liabilities / equity 0.03a. 1. RNOA = NOPATAvg. NOANOPAT = [$186,000 + $2,000 - $120,000 - $37,000 + $1,000] x 50% = $16,000 Note: we include income from equity investments under the assumptions that these are operating rather than financial investments. We also include the cumulative effect as operating in the absence of information to the contrary. Minority interest and discontinued operations are nonoperating (minority interest is therefore, treated as equity in the ROCE computation).NOA Year 6 = $138,000 - $29,000 - $7000 - $3,600 = $98,400 NOA Year 5 = $105,000 - $23,000 - $2,000 - $2,000 = $78,000RNOA = $16,000 / ([$98,400 + $78,000]/2) = 18.14%2. ROCE = Net income - Preferred dividendsAverage common equityROCE = ($10,000 –$0) /[($55,400* + $47,800*)/2] = 19.38% *Note: minority interest is treated as equity. If Minority interest is ignored, the ROCE is 19.8%b. NFO = NOA - EquityYear 6: $43,000; Year 5: $30,200LEV = Avg. NFO / Ave Equity = ([$43,000 + $30,200] / 2) / ([$55,400* + $47,800*] /2)= 0.71NFE = NOPAT – Net incomeYear 6: $6,000NFR = NFE / Avg. NFO = $6,000 / ([$43,000 + $30,200] / 2) = 16.4%Spread = RNOA – NFR = 18.14% - 16.4% = 1.74%ROCE = RNOA + LEV x Spread = 18.14 + 0.71 x 1.74% = 19.38%94% (18.14%/19.38%) of Zeta’s ROCE is derived for m operating activities. The company is effectively using leverage, however, as indicated by the positive spread, but the leverage does not contribute significantly to Zeta’s return on equity and may not be worth the added risk.a. ROCE = [Net income –preferred dividends] / stockholders’ equity**end of year in this problemROCE Year 5: [$14 – $0] / $125 = 11.2%ROCE Year 9: [$34 - $0] / $220 = 15.5%RNOA Year 5 = ($35 x 0.50) / ($52 + $123) = 10.0%RNOA Year 9 = ($68 x 0.50) / ($63 + $157) = 15.5%ROCE = RNOA + Leverage x SpreadYear 5: 10.0% + 1.2% = 11.2%Year 9: 15.5% + 0 = 15.5%b. Texas Talcom’s ROCE has increased form years 5 to 9. The source is thisincrease, however, has been an increase in RNOA as the leverage effect is zero in Year 9 since its long-term debt has been retired. Given the RNOA increase, additional leverage might be explored as a way to increase shareholder returns.Selling price per unit ...................... $6.00 $5.00 $50.00 $50.00 Unit cost ........................................... $5.00 $4.00 $32.50 $30.00Analysis of Variation in Product A SalesIncreased quantity at Yr 6 prices (3,000 x $5) ........................ $ 15,000 Price increase at Yr 6 quantity (7,000 x $1) ........................... 7,000 Quantity increase x price increase (3,000 x $1) .................... 3,000 Analysis of Variation in Product A Cost of SalesIncreased quantity at Yr 6 cost (3,000 x $4) ........................... (12,000) Increased cost at Yr 6 quantity (7,000 x $1) ........................... (7,000) Cost increase x quantity increase (3,000 x $1) ...................... (3,000) Net Variation (Increase) in Gross Margin for Product A ............. $ 3,000Analysis of Variation in Product B SalesDecreased quantity at Yr 6 prices (300 x $50) ....................... $ (15,000) Analysis of Variation in Product B Cost of Sales:Decreased quantity at Yr 6 cost (300 x $30) .......................... 9,000 Increased cost at Yr 6 quantity (900 x $2.50) ......................... (2,250) Cost increase x quantity decrease (300 x $2.50) . (750)Net Variation (Decrease) in Gross Margin for Product B ............ $ (7,500)Summary of Net Variation in Margins for Products A and BNet increase from product A ......................................................... $ 3,000 Net decrease from product B ........................................................ (7,500) Net Decrease in Gross Margin ...................................................... $ (4,500)a.SPYRES MANUFACTURING COMPANYComparative Common-Size Income StatementsYear Ended December 31 IncreaseYear 9 Year 8(Decrease)Net sales ............................. 100.0% 100.0% 20.0% Cost of goods sold ............ 81.7 86.0 14.0 Gross margin on sales ...... 18.3 14.0 57.1 Operating expenses .......... 16.8 10.2 98.0 Income before taxes .......... 1.5 3.8 (52.6) Income taxes ...................... 0.4 1.0 (52.0) Net income ......................... 1.1 2.8 (52.9)b. Performance in Year 9 is poor when compared with Year 8. One bright spot isthe percentage of Cost of Goods Sold to Sales, which decreased in Year 9.However, Operating Expenses climbed sharply. This sharp climb in operating expenses is unexpected since there is usually a larger fixed cost component comprising these costs compared with that for Cost of Goods Sold.Management should further check operating expenses. If operating expenses had remained at the Year 8 level of 10.2%, income would have been up favorably for Year 9. Operating expenses may have included a future-directed component such as advertising or training costs. Also, management would want to follow up on the change in gross margin. The sharp improvement in gross margin may have been due to factors such as the liquidation LIFO inventory layers or, alternatively, to something more fundamental with the activities of the firm.。
- 1、下载文档前请自行甄别文档内容的完整性,平台不提供额外的编辑、内容补充、找答案等附加服务。
- 2、"仅部分预览"的文档,不可在线预览部分如存在完整性等问题,可反馈申请退款(可完整预览的文档不适用该条件!)。
- 3、如文档侵犯您的权益,请联系客服反馈,我们会尽快为您处理(人工客服工作时间:9:00-18:30)。
1
organizations. 1.2 Local Carbon Trading System The carbon trading pilot areas have taken actions. The construction of carbon emission trading platform has been planned in five cities and two provinces, which is Beijing, Shanghai, Tianjin, Chongqing, Hubei province, Guangdong province and Shenzhen. 1.3 Key Industries’ Low Carbon Development and Solutions With the guidance of national policies and the deployment of carbon trading system from pilot areas, key industries have taken initiatives to implement low carbon development models. 1.3.1 The banks tried carbon finance but the whole level is low
Industry In order to realize the low carbon utilization of coals and reducing the CO2 emissions of the coal conversion process, China Shenhua group built China’s first industrial demonstration projects of CCS( Carbon Capture and Storage). China National Offshore Oil Corporation fully implemented the commitment of industrial structure adjustment, low carbon energy development, emphasis on international cooperation, meeting the requirements of regulations, optimizing
Report Writer TÜV-NORD China
Carbon Disclosure Project China info@ +86 010 5869 9549
100 enterprises were invited to participate in the survey of CDP 2012. 23 enterprises answered the questionnaire which is 12 more than that of 2011. Besides, 1 enterprise provided the information about what they have done to cope with the climate change.
It is the first time that the greenhouse gas emission reduction target has been included in the annual index system of the national economic and social development. Besides policy support, Chinese government is looking for the effective way to control the total amount of GHG emission through market mechanism, and developed series effective economic incentive policies to promote the establishment of carbon emission trading market in China. Currently, China has developed a model to cope with climate change, which is guided by the national policies, coordinated by several departments and supported by alternative solutions. In this way, the central government has allocated targets to the region, energy intensive industries and the enterprises efficiently, so as to fully arouse the enthusiasm of various departments and
In China, the biggest three tele-communication operators China Mobile, China Telecom and China Unicom have taken series actions for energy conservation and emissions reduction, such as building green networks and base stations, trying cloud computing, establishing energy conservation and emissions reduction management system and improving it gradually, so as to realize the low carbon development of the whole industry. 1.3.3 The High Capacity and Low Energy Consumption of Energy
Due to the lack of policies and effective incentive mechanism, the proportion of green credits is still low. Besides, there are just a few banks trying to develop the green financial products, among which financing for energy efficiency products occupies the largest proportion. 1.3.2 The ICT industry laid a tone of low carbon development
2 CDP Questionnaire Analysis
In 2012, among all the 100 Chinese enterprises that were invited to participate in the CDP questionnaire survey, 23 of them answered the questionnaire, 1 enterprise provided information. The above enterprises that replied the questionnaire of CDP were distributed in 7 sectors, which were mainly concentrated in the energy (6), financials (8) and telecommunication services (3). The questionnaire involves three parts, which are climate change management, risks and opportunities as well as emissions reduction.
successfully accomplished During this period, the Chinese government tried to control the greenhouse gas emissions through many different ways, such as the industrial and energy structure adjustment, energy conservation, energy efficiency improvement, carbon sinks increase and so on. It has achieved some significant results especially the methods of stepwise allocation and assessment of energy intensity indicators. 1.1.2 Opportunities and Challenges of the 12th Five-Year Plan
2ቤተ መጻሕፍቲ ባይዱ
the allocation of resources, practicing energy conservation and emissions reduction, regulating the measurement and statistics, advocating carbon sink actions, strengthening the consciousness cultivation and improving cognitive abilities. China Petrochemical Corporation has developed low carbon energy actively and optimized and improved the energy structure. It has formed the most complete Industrial chain of low-carbon energy business that contains technology research and development, industrial production and product sales. It aims to form large-scale industry of low carbon energy, become useful addition of primary business and contribute to the sustainable development of the company by 2020.