2017老挝水电资源最新发展报告
老挝水电业现状及其跨境电力购买协议
老挝水电业现状及其跨境电力购买协议X.奉姆索法;王爱生【摘要】在最大程度利用资源和加快地方经济发展方面,很多亚洲国家的水电行业在边境贸易中发挥了重大作用.在这方面,老挝有着丰富的经验,多年来一直向泰国出口电力.回顾了与老挝电力贸易的相关法律和合同事务;介绍了双边贸易中的双方协议、电力购买协议和工程照付不议资格等方面的详细编制过程,以及在签订协议过程中应当注意的一些细节问题.【期刊名称】《水利水电快报》【年(卷),期】2013(034)012【总页数】3页(P4-6)【关键词】水电资源开发规划;水电业现状;电力购买;老挝【作者】X.奉姆索法;王爱生【作者单位】;【正文语种】中文【中图分类】TV211.14目前,老挝有6座水电站向泰国供电,这些水电站均由私营企业运营,属于独立发电企业(IPP)。
此外,目前有10座水电站正在建设中,另外还有20座拟建水电站正在进行技术可行性研究,其目标均为向邻国供电。
这些水电项目建设资金的来源都是通过融资,融资参与者包括私人股权投资者、金融机构、安全提供者(security provider)、承包商和供应商等。
必须满足所有参与融资者的要求,以及考虑融资各方的融资性质和义务,才能签订所有的项目协议。
该地区既没有现货市场也没有高效运行的输电网络,老挝的每座水电站都是作为商业水电站向泰国电网供电。
根据其发电容量,老挝各水电站的电力购买计划和运行特性也不相同。
实际上,在运行期间,这些老挝境内的水电站已经成了泰国电力系统的一部分。
电力购买协议(PPA)是项目的核心协议之一,需要满足银行向项目提供贷款的要求,而且必须依赖预计的未来现金流。
银行可接受的PPA,是项目能够再次抵押债务的融资协议。
在具体问题具体分析的基础上,与其他项目文件一起,由贷款银行评估。
图1为各方提出和达成的主要项目协议的网络图。
1 电力购买协议1.1 协议各方图1 各方达成的项目协议网络图示意PPA协议的各方是电力购买商,在老挝,是由泰国发电局(EGAT)和项目公司依据老挝法律成立的“特殊目的公司(SPC)”。
老挝计划扩大水电开发面临经济挑战

部 三方人 员 组成 ~ 个 委 员 会 来解 决 这 一 问题 。E L也 已着 d
手 逐步 提高 国内的 收费 标准 。
对 消费 者 , d E L抱 怨他 们 购 买便 宜 但 质 劣 的 电器 设 备 , 尤其 是购 买那 些 与 E L系统 不 匹配 的 国外 电器设 备 。 d
站 自用
老挝 政府 、 界银 行 和 泰 国电 力管理 局之 间关 于该 工 程 世 的 协 商 接 近 尾 声 。 该 工 程 将 按 P ) 方 式 实 施 。 开 发 商 KX T
— —
2 经 济 挑 战
老 挝 国 内 扩 大 计 划 部 分 受 阻 , 要 是 由 于 老 挝 电 力 公 司 主 ( L廉 价 出售 电能 因而 缺乏 现 款 造 成 的 。据 最 近 报道 , 副 ) 发 电成 本 为 0 0 美 元 /W ・ , 平 均 售 价 仅 为 0 0 6 元 / W ・ .7 k h而 .2 美 k
NT C联营 体 由法 国 电力公 司 ( D ) 电力 生 产 股份 有 E E F 、
限公 司 ( GP 和 意大 利 一泰 国开 发公 司组成 。联营 体 占该 E C) 工程 7 %的股份 ( DF占 3 % ; GP 占 2 % , 大利 ~泰 5 E 5 E C 5 意
h 。配 电费 用 高 是 客 观 条 件 决 定 的 , 为 人 口密 度 太 低 ( 9 因 1
维普资讯
20 0 2年 7月
水 利 水 电 快 报 E WRHI
第 2 3卷 第 l 3期
文 章 编 号 :1 0 —0 1 2 0 ) 1—0 60 0 60 8 (0 2 0 30 0 —2
老 挝 计 划 扩 大 水 电 开 发 面 临 经 济 挑 战
老挝水电工程BOT项目融资研究的开题报告

老挝水电工程BOT项目融资研究的开题报告一、研究背景近年来,随着人类社会的发展和经济的增长,能源需求不断增长,对能源资源的利用也更加迫切。
而水力资源的开发具有清洁、可再生、稳定等优点,因此得到了越来越多国家和地区的关注。
在这种背景下,BOT(建设、运营、转让)模式作为一种新型的融资模式被广泛采用。
BOT模式是指由私人投资方开展基础设施建设项目,建设完成后由该投资方附带运营该项目并收取相关利润,一定时期后再将项目转让给政府或其他合法主体。
BOT模式适用于所有基础设施建设项目,能够实现资金来源的多样化,有效提高项目的资金效益,实现资源的协调配置,提高项目建设的效率和成效。
老挝拥有丰富的水力资源,是东南亚水力资源开发最为悠久的国家之一。
老挝隆布河、湄公河、红河等河流资源丰富,水电开发十分可能,且水电发电不仅能满足国内需求,还能向周边国家输出电力,具有良好的经济效益。
因此,老挝政府一直致力于推动水力能源的开发和利用,并将其作为国家支柱产业之一。
本研究以老挝水电工程BOT项目融资研究为切入点,就BOT模式在老挝水力能源开发中的应用进行深入探究,旨在为老挝水利能源开发提供新的思路。
二、研究内容和目标本研究主要以老挝水电工程BOT项目的融资为研究对象,旨在对BOT模式在老挝水利能源利用与开发中的应用和推广进行深入探究,借鉴其他国家在这方面的经验和教训,同时考虑到老挝国情和实际,提出可行的融资方案和策略。
研究目标:1. 掌握老挝水电工程BOT项目的现状和发展趋势;2. 分析老挝水电工程BOT项目的优势和不足;3. 探究老挝水电工程BOT项目的融资模式和策略;4. 提出老挝水电工程BOT项目融资的可行性和效益。
三、研究方法本研究主要采用文献综述法、实证分析法和专家访谈法相结合的方式进行。
1. 文献综述法:收集和分析老挝水力利用和BOT模式相关的文献资料,全面地了解老挝水电工程BOT项目的现状、优势和不足。
2. 实证分析法:根据收集的数据,运用经济学和财务学等相关学科的知识,对老挝水电工程BOT项目进行实证分析,评估BOT模式在此项目中的适用性和实际效益。
“一带一路”下老挝输电项目财务基准收益率研究——基于国家风险的视角

一、引言自“一带一路”倡议提出以来,成效惠及世界,基础设施建设是共建“一带一路”的基础[1]。
南方电网公司充分发挥中国南方五省区位及地缘优势,实现了与越南、老挝、缅甸电网互联,缓解了越南、老挝、缅甸北部的电力紧缺,对当地社会经济发展起到了积极促进作用[2]。
除加强与周边国家、地区电网互联互通外,南方电网公司也在寻求更深入的合作。
2018年,南方电网公司与老挝政府、老挝国家电力公司共同签署《关于开发建设老挝国家输电网可行性研究谅解备忘录》[3],标志着中老电力合作迈出新步伐。
但与中国经济互补性强,合作潜力很大。
相较于境内项目,对老挝输电项目的投资必然暴露在特定的国家风险之下,而项目财务基准收益率体现了投资者对收益的最低要求,在测定时必须体现国家风险的大小。
本文借助资产定价模型和加权平均资本成本方法构建了财务基准收益率测算模型,并以对老挝琅南塔地区输电项目的投资为例,深入分析了国家风险对基准收益率的影响,以为电网企业的投资决策提供依据。
二、国家风险下的财务基准收益率(一)项目财务基准收益率的涵义财务基准收益率是企业可接受的最低投资收益率水平,反映了投资者对所占用资金的机会成本与时间价值的判断,同时也是供投资者做出决策的依据。
国家发展改革委、住建部于2006年发布《关于印发建设项目经济评价方法与参数的通知》(发改投资〔2006〕1325号)[4],公布了包含输变电行业在内的项目融资前税前财务基准收益率和资本金税后财务基准收益率。
而对于境外输电项目尚无财务基准收益率可依,且必须根据投资环境进行测定。
国际上将项目的平均资本成本视为投资项目的最低收益率,通常采用资本资产定价模型(CAPM )和加权平均资本成本(WACC )相结合的方法进行测定。
(二)国家风险的内涵国家风险是指东道国特定的国家层面事件通过直接或间接的方式,导致国际经济活动偏离预期结果造成的损失和可能性[5]。
不同的国家在经济发展周期、政治体系、社会经济结构等方面各不相同,由此体现的国家风险也不相同。
老挝经济前景

老挝经济前景老挝位于东南亚地区,是一个内陆国家,拥有丰富的自然资源和潜在的经济发展机会。
虽然老挝的经济相对较小,但它在过去几十年里取得了稳定的增长,有望在未来继续保持良好的经济前景。
首先,老挝拥有丰富的自然资源,尤其是水力资源。
该国拥有许多大型河流,如湄公河和红河,这些河流为发展水力发电提供了极大的机会。
老挝目前已经建成了一些大型水电站,如纳姆颂水电站和塞敏河水电站,这些水电站不仅为国内提供了廉价电力,还能出口到邻国,为经济增长提供了动力。
未来,老挝还可以继续开发其丰富的水力资源,提高发电量,并进一步促进经济发展。
其次,老挝在旅游业方面具有巨大的潜力。
老挝拥有独特的风景和文化遗产,如琅勃拉邦古城、朗勃拉邦佛塔和巴米耶寺等。
此外,老挝还拥有丰富的自然资源,如瀑布、森林和湖泊,这些都为旅游业的发展提供了优势。
近年来,老挝政府已经采取了一系列措施来吸引外国游客,如简化签证手续和改善旅游基础设施。
这些努力已经取得了成效,老挝的旅游业正在迅速增长,为经济增长做出了贡献。
随着中国和东南亚国家中产阶级的增长,越来越多的游客将选择老挝作为旅游目的地,这将继续推动老挝旅游业的发展。
此外,老挝还受益于其地理位置。
作为中国、泰国和越南之间的交通枢纽,老挝有着得天独厚的地理位置优势。
近年来,老挝已经积极参与“一带一路”倡议,并努力改善国内基础设施,以吸引更多的外国投资。
老挝政府还通过减税和放宽外资限制等一系列措施,来鼓励外国企业在国内设立业务。
这些努力都为老挝吸引更多的外国投资,推动经济增长提供了机会。
然而,老挝面临着一些挑战。
首先,老挝的基础设施仍然相对落后,缺乏现代化的交通网络和通信设施。
其次,尽管旅游业发展迅速,但老挝的旅游基础设施仍然不够完善,无法满足日益增长的游客需求。
此外,老挝还面临环境保护的问题,特别是在水力发电的开发过程中,可能对当地生态系统造成潜在的影响。
综上所述,老挝的经济前景仍然充满潜力。
拥有丰富的自然资源、发展迅速的旅游业和地理位置优势,老挝有望在未来继续保持良好的经济增长。
老挝电力发展规划-现状

Part IPresent StatusGeneration Facilities1.1 ExistingThe generation Source Development in Lao PDR has been continuously developed together with the increasing demand of electricity in the period 2005-2009, the total installed capacity as of December 2005 was 670.8 MW (excluding off-grid system), of which 308.7 MW is owned by EDL while 362.1 MW is owned by Independent Power Producers for exporting power to neighboring countries, IPP(e)1. The growth rate of the installed capacity in the period 2008-2009 was 172%. The historical trend of the installed capacity of Hydropower plants are shown in Figure 1.1-1 below.Figure 1.1-1: Historical trend of the installed capacity.At present, the existing transmission system in side the country was not yet linked together. The total installed capacity as of December 2009 was 1,826.8 MW, all from Hydropower plants. The dramatically increase with the capacity of 1,156 MW in 2009 mainly from Xeset 2 (76 MW) and Nam Theun 2 (1,080 MW) hydropower plants. Of which 20.9% of capacity is owned by EDL and 78.9% are IPP(e). The existing hydropower plants of EDL and IPP(e) are listed in the Table 1.1-1, Appendix 1 and Figure 1.1-2 below.1Theun Hinboun HPP (210MW) and Houay Ho HPP (152.1 MW) and Nam Theun 2 HPP (1080MW)Figure 1.1-2: The existing installed capacity of hydropower plants as of December 2009.Figure 1.1-3: The existing hydropower plants in Lao PDR.1.2 Transmission Line and Substation FacilitiesAt Present, the high voltage transmission system (115 kV) was already linked between Central andNorthern areas in 2009 while Central and Southern link is under construction and expected to becompleted during 2010-2011. Details of the existing transmission system in Lao PDR are shown inFigure 1.2-1, Appendix 1, and Figure 1.2-2 below.Nam Ngum 1 hydropower plantXeset 2 hydropower plant Xeset 1 hydropower plantFigure 1.2-3: The existing transmission system and substations in Lao PDR.1.2.1 Northern AreaThe existing 115kV transmission line in the Northern area is interconnected with China system by single circuit of 115kV transmission line from Namo substation, Oudomxay province (Lao PDR) – Meung La substation (China) in 2009, Refer to Power Purchase Agreement (PPA) signed between EDL and China, EDL was allowed to imports power at this point with maximum 30MW. The power distribution in this area is delivered through various 115/22kV substations such as: Luang Namtha 1, Oudomxai, Luang Prabang 1, Pakmong, Sayabuly and some parts is delivered through imports power from Provincial Electricity Authority of Thailand (PEA) via the 22kV distribution line. As of December 2009, the existing 115/22kV substations in this area consist of 6 locations with the total installed capacity of 107 MVA (as seen in the Table 1.2-1, Appendix 1). The total length of the 115kV transmission lines is totally 594.5 cct-km (as seen in Table 1.2-2, Appendix 1).1.2.2 Central AreaThe high voltage transmission systems in this area are connected with three (3) major hydropowerplants namely Nam Ngum 1 (155 MW), Nam Leuk (60 MW) and Nam Mang 3 (40 MW). These plants are supplied electric energy mainly to Central area and some parts of Northern area. The power distribution in the Vientiane Capital is delivered through various 115/22kV substations (Phonetong, Naxaythong, Tha Ngon, Khoksa ad, and Thanaleng), Vientiane province is deliveredthrough 115/22kV substations (Phonsoung, Thalat, Bandon, Nonhai, Nam Ngum1, Nam Leuk, Nam Mang 3 and Vangvieng), Bolikhamxai province is delivered through 115/22kV Pakxansubstation, and Xiengkhuang is delivered through 115/22kV Phonsavan substation. As ofSubstation Control Room 115kV Transmission LineDecember 2009 the 115/22kV substations in this area consist of 14 locations with the total installed capacity of 446.5 MVA (as seen in the Table 1.2-1, Appendix 1) and the total length of 115kV transmission line is totally 799.9 km, 898.6 cct-km (as seen in Table 1.2-2, Appendix 1).The 115kV transmission system in this area is also interconnected to EGAT’s system for the purposes of exchange power each other (import/export). There are two interconnection points namely: 1) from Phontong substation (Lao PDR) to Nongkai substation (EGAT, Thailand) by double (2) circuits of 115kV transmission lines and Single (1) circuit of 115kV transmission line from Thanaleng substation (Lao PDR) to Nongkai substation (EGAT, Thailand) and 2) from Pakxan substation (Lao PDR) to Bungkan substation (EGAT, Thailand) by Double (2) circuits (Strung one circuit) of 115kV transmission line. The details are shown in the Table 1.4-1, Appendix 1.1.2.3 Southern AreaThe 115 kV transmission systems in this area will be linked with Central system during 2010-2011, the project is under construction. The connection will start from Pakxan substation (Bolikhamxay province)-Thakhek (Khammouane province)-Pakbo substation (Savanakhet province) by double (2) circuits of 115kV transmission lines. Moreover, the Southern area system is also interconnected to EGAT’s system for the purpose of exchange power each other (import/export) namely: 1) Double circuit of 115kV transmission line from Thakhek substation (Lao PDR) to Nakhonphanom substation (EGAT, Thailand), 2) Double circuit (Strung one circuit) of 115kV transmission line from Pakbo substation (Lao PDR) to Mukdahan substation (EGAT, Thailand), and 3) Single circuit of 115kV transmission line from Bangyo substation (Lao PDR) to Sirinthon hydropower plant (EGAT, Thailand).Besides the interconnection with EGAT’s system, the 115 kV transmission line in Khammouane province was also expanded to supply power to the large consumers such as: from Thakhek substation – Sepon (mine) substation, from Thakhek – Cement Factory (Mahaxay) and from Nam Theun 2 (75MW) – Mahaxay substation.Power supply to the urban, districts and rural area of Saravan, Sekong, Attapeu and Champasak provinces come from three (3) major hydropower plants namely: 1) Xeset 1 (45MW), 2) Xeset 2 (76MW) and 3) Selabam (5MW). Currently, the 115/22kV substations in this area encompass 10 locations with the total installed capacity of 359 MVA (as seen in the Table 1.2-1, Appendix 1).The total length of 115kV transmission lines is totally 666.5 km, 989.6 cct-km (as seen in Table 1.2-2, Appendix 1). The power distribution in this area is delivered through various substation such as: Khammouan province is delivered through 115/22kV substations (Thakhek and Mahaxai), Savanakhet province is delivered through 115/22kV substations (Pakbo and Kengkok), Saravan province is delivered through 115/22kV Xeset 1 power stations, Champasack province is delivered through 115/22kV substations (Bangyo, Jiengxai, Pakxong, Ban Na and Ban Hat) and Attapeu province is delivered through 115/22kV Saphaothong substation.1.3 Distribution FacilitiesCurrently, EDL’s medium voltage (MV) distribution system is principally of 12.7kV, 22kV, 25kV, 34.5kV and 35kV. Those medium voltage Feeders are extended to urban and rural areas from 115/34.5/22kV substations. The low voltage (LV) distribution systems are generally of 400/220V, 3 phase and 4 wires.SFigure 1.3-1: The existing medium and low voltage systems.Refer to the statistics of medium voltage network since 2003 up to 2009, the growth rate was in the range of 6-15% (as seen in Table 1.3-1, Appendix 1) and shown in Figure 1.3-2 below.Medium Voltage Distribution SystemMedium Voltage Distribution System -Low Voltage System Medium Voltage Distribution System Medium Voltage Distribution System -Medium Voltage Distribution SystemFigure 1.3-2: Historical trend of medium voltage system.Refer to the statistics of low voltage network since 2003 up to 2009, the growth rate was in the range of 4-12% (as seen in Table 1.3-1, Appendix 1) and shown in Figure 1.3-3 below.Figure 1.3-3: Historical trend of low voltage system.The growth rate of installed capacity of distribution transformers in horizon 2003-2009 was in the range of 9-15% (as seen in Table 1.3-2, Appendix 1) and shown in Figure 1.3-4 below.Figure 1.3-4: Historical trend of installed capacity of distribution transformers.1.4 International Connecting LinesBesides, 115 kV interconnection lines with neighboring countries as mentioned-above, EDL’s distribution system (22kV, 35kV) was also interconnected with neighboring countries too for the purpose of supply power to the bordering areas and to the place where is no network existed. Details of international connecting lines are as follows:#International Connecting lines with PEA: Muong Houayxay (Bokeo province), Muong Khop, Muong Ngeun, Muong Xienghon, and Muong Kenthao (Xayabuly province).#International Connecting lines with Electricity of Vietnam (EVN): Muong Sopbao (Huaphanh province), Dansavan (Savannakhet province), Muong Samouay (Saravan province), Muong Dakcheung (Sekong province) and Danphoukeua (Attapeu province).#International Connecting lines with Electricite Du Combodge (EDC): Ban Hat Substattion (Lao PDR) to Stung Treng substation (Cambodia).#International Connecting lines with China Southern Grid (CSG): Muong Sing and Botendenkham (Luang Namtha province).Details of the existing interconnecting lines with neighboring countries Including IPP(e)’s lines as of December 2009 are summarized in Table 1.4-1, Appendix 1.1.5 Past Energy Consumption RecordHistorical trend of energy consumption of each area in horizon 2001-2009 are tabulated in Table 1.5-1, Appendix 1, and shown in Figure 1.5-1 below.Figure 1.5-1: Historical trend of energy consumption.Remark:−The data in horizon 2005-2009 was including Sepon Gold/Copper mine and Mahaxay Cement Factory consumption.Figure 1.5-1 above and Table 1.5-1, Appendix 1 are indicated that the growth rate of energy demand for whole country in horizon 2001-2009 was continuously increased with an average growth rate was 4% (2002-2003), while big growth was in period 2005-2006 with 39% (Data 2005 is including of Sepon Gold/Copper mine and Mahaxay Cement factory demand), an average growth rate of energy demand in Northern, Central and Southern areas were 24.3%, 12.2% and 19.7% respectively. The average growth rate of energy demand for whole country was 15.2%, the main reason is that electricity requirement from the rural electrification expansion projects, industrial, Commercial loads.1.6 Past Peak Load RecordThe past peak load record of each area in period 2001-2009 are listed in Table 1.5-1, Appendix 1, and shown in Figure 1.6-1 below.Figure 1.6-1: Historical trend of peak loadRemark:−The data in horizon 2005-2009 was including Sepon Gold/Copper mine and Mahaxay Cement Factory consumption.Figure 1.6-1 above and Table 1.5-1, Appendix 1 are indicated that the growth rate of peak Load for whole country in horizon 2001-2009 was continuously increased with an average growth rate of 7% (2001 to 2002), while 23% was in period 2008-2009. An average growth rate of peak Load in Northern, Central and Southern areas were 24.9%, 14.2% and 9.3% respectively. The average growth rate of peak load for whole country was 13.3%, the main reason please refer to the item 1.5.1.7 Energy Consumption by Consumer TypesThe past energy consumption by consumer type is shown in the Table 1.5-2, Appendix 1. The energy consumption by consumer type was classified into seven (7) categories: Industry, Agriculture, Enterprises, Entertainment, Government Office, Residential and Embassies. Share of the energy consumption of each category in the whole country is shown in the Table 1.7-1. In order to evaluate the Socio-Economic development in the country which related with to energy consumption, the energy consumption by consumer types were re-classified into four (4) categories: Residential, Industry, Agriculture and Service (Enterprises, Entertainment, Government Office, and Embassies). The details are shown in the Table 1.5-3, Appendix 1, and Figure 1.7-1 and 1.7-2 below.-100,000,000200,000,000300,000,000400,000,000500,000,000600,000,000700,000,000800,000,000900,000,000200120022003200420052006200720082009k W hResidential ServiceFigure 1.7-1: Historical trend of energy consumption by consumer types.Figure 1.7-1 indicated that the past energy consumption by consumer types in period 2001-2009 for whole country, the Residential and Agriculture categories were increased normally while Industrial and Service categories were dramatically increased in period 2006-2009 (for Industrial category) and 2007-2009 (for Service category) and the growth rate of these categories will continuously increase. With the increasing of energy consumption for these categories, it can be explained that the social economic development in the country is being improved.Figure 1.7-2: Share of energy consumption by consumer types.Figure 1.7-2 is indicated that the share of energy consumption by consumer types in period 2001-2009 for the whole country. The share of the Residential and Agriculture categories were decreased while share of the Industry and Service categories were continuously increased. That means the country is going toward the industrialized country step by step.The numbers of customers by category for whole country are shown in the Table 1.7-1 and numbers of customers by Residential and non-residential categories are shown in the Table 1.7-2, Appendix 1.100,000200,000300,000400,000500,000600,000700,000800,000200120022003200420052006200720082009Figure 1.7-3: Total number of consumers by Residential and non-Residential categories.Figure 1.7-3 indicated that the total numbers of consumers by Residential and Non-Residential categories have been increased year by year to fulfill the government target on the rural electrification and socio-economic development plans.1.8 Gross Power Generation and Power Export/ImportThe gross power generation, power export/import of the country during 2001-2009 is tabulated in Table 1.8-1. The average growth rate of generation, import and export in the period 2001-2009 were 1-27%, 3-61% and 3-51% respectively. Almost 100% of total energy is generated by hydropower plants namely: Nam Ngum 1 (155MW), Nam Mang 3 (40MW), Nam Leuk (60MW), Xeset 1 (45MW), Xeset 2 (76MW), small hydropower plants and other sources. The details are shown in Table 1.8-1, Appendix 1.2004006008001,0001,2001,4001,6001,8002,000200120022003200420052006200720082009G W h /Y e a rImport Export GenerationFigure 1.8-1: Production, Import and Export in the country.Figure 1.8-1 indicated that the average generation in period 2001-2009 was approximately 1,560 GWh p.a. while trend of Export energy was reduced and the Import energy from neighboring countries was increased 182 GWh (2001), 819 GWh (2009). That means the demand of electricity in the country is high requirement while supply requirement was imbalance.。
老挝矿产资源分布及中国企业在老挝的投资现状
本文引用自飘扬《老挝矿产资源分布及中国企业在老挝的投资现状》近年来,有色金属矿产地质调查中心联合中色矿业集团有限公司和北京东南亚资源科技有限公司,对老挝国的矿产分布情况和矿业投资环境作了较详细的考察和研究,并搜集了较多的矿产地质资料和信息。
我们认为,老挝国的矿产资源分布非常广泛而丰富,勘查与开发程度极低,很多地区的金属矿产具有非常巨大的找矿前景和开发价值,如铜、金、铝土矿、铁、锰、铅锌、钨和锡等。
外国投资已经开始涌入老挝,预计几年内老挝的矿业就会得到极大的发展。
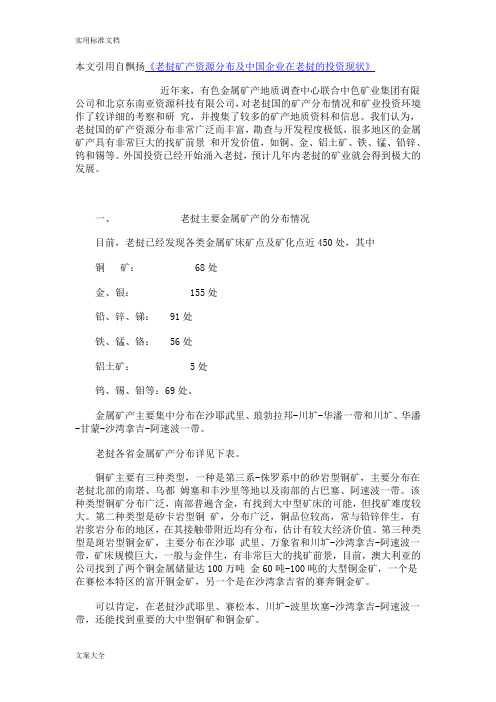
一、老挝主要金属矿产的分布情况目前,老挝已经发现各类金属矿床矿点及矿化点近450处,其中铜矿: 68处金、银: 155处铅、锌、锑: 91处铁、锰、铬: 56处铝土矿: 5处钨、锡、钼等:69处。
金属矿产主要集中分布在沙耶武里、琅勃拉邦-川圹-华潘一带和川圹、华潘-甘蒙-沙湾拿吉-阿速波一带。
老挝各省金属矿产分布详见下表。
铜矿主要有三种类型,一种是第三系-侏罗系中的砂岩型铜矿,主要分布在老挝北部的南塔、乌都姆塞和丰沙里等地以及南部的占巴塞、阿速波一带。
该种类型铜矿分布广泛,南部普遍含金,有找到大中型矿床的可能,但找矿难度较大。
第二种类型是矽卡岩型铜矿,分布广泛,铜品位较高,常与铅锌伴生,有岩浆岩分布的地区,在其接触带附近均有分布,估计有较大经济价值。
第三种类型是斑岩型铜金矿,主要分布在沙耶武里、万象省和川圹-沙湾拿吉-阿速波一带,矿床规模巨大,一般与金伴生,有非常巨大的找矿前景,目前,澳大利亚的公司找到了两个铜金属储量达100万吨金60吨-100吨的大型铜金矿,一个是在赛松本特区的富开铜金矿,另一个是在沙湾拿吉省的赛奔铜金矿。
可以肯定,在老挝沙武耶里、赛松本、川圹-波里坎塞-沙湾拿吉-阿速波一带,还能找到重要的大中型铜矿和铜金矿。
金矿在老挝分布非常广泛,大小河流的冲击层中普遍有砂金产出。
金矿类型主要有四种,即冲积型砂金矿、斑岩型与铜伴生的金矿,石英脉型金矿和卡林型老挝金属矿产分布一览表单位:处微细粒金矿。
水电十局老挝公司_企业报告(业主版)

目录
企业基本信息 .................................................................................................................................1 一、采购需求 .................................................................................................................................1
1.3 项目规模
1.3.1 规模结构 近 1 年水电十局老挝公司的项目规模主要分布于小于 10 万区间,占项目总数的 0.0%。500 万以上大 额项目 0 个。 近 1 年(2022-03~2023-02):
本报告于 2023 年 02 月 18 日 生成
2/10
1.4 行业分布
近 1 年水电十局老挝公司的招标采购项目较为主要分布于黑色金属冶炼及压延产品 非金属矿物材料 防洪除涝设施管理行业,项目数量分别达到 11 个、3 个、1 个。其中黑色金属冶炼及压延产品 非金 属矿物材料 防洪除涝设施管理项目金额较高,分别达到 0.00 万元、0.00 万元、0.00 万元。 近 1 年(2022-03~2023-02):
【物资类】中国电建水电十局老 挝公司南俄 3 项目其它钢材采购 项目成交公示
荣兴进出口贸易与 国际物流有限公司
\
【物资类】中国电建水电十局老
TOP9
挝公司南俄 4 水电站(C3、C4 标) 保 力 商 贸 进 出 口 独 项目Ⅱ级钢筋(335/510 级)采 资有限公司
- 1、下载文档前请自行甄别文档内容的完整性,平台不提供额外的编辑、内容补充、找答案等附加服务。
- 2、"仅部分预览"的文档,不可在线预览部分如存在完整性等问题,可反馈申请退款(可完整预览的文档不适用该条件!)。
- 3、如文档侵犯您的权益,请联系客服反馈,我们会尽快为您处理(人工客服工作时间:9:00-18:30)。
2017老挝水电资源最新发展报告
根据老挝能源与矿业部的报告,目前,老挝有46家
发电厂,生产能力为6,757兆瓦(MW),发电量约为
35,608吉瓦时(GWh)。其中43个为水电站,1个煤
电厂和2个生物发电厂(将甘蔗废物转化为电力)。另
有51个水电站项目正在建设,装机容量约为6,302兆瓦,
预计到2020年全部建成并投入商业运营,每年生产约
30,899吉瓦时的电力。
能源与矿业部的规划和统计部门最近报告称,在建
的51家工厂中,7家将于今年开始运营,11家将于明年
完工,还有14家将于2019年完工,另外19家将于2020
年完工。
51个电厂位于15个省份,分别是:川圹、赛松本、
万象、阿速坡、乌多姆赛、占巴塞、琅南塔、华潘、沙
拉湾、波里坎塞、沙耶武里、甘蒙、琅勃拉邦、丰沙里
和波乔省。
报告指出,其中有7个发电站的生产能力将达到
395.9兆瓦,每年发电量约1,464.29吉瓦时。他们分别
是Nam Chae、南东方(Nam Dongfang)、南孔2、
Xekaman Sanxay、Nam Phay、Nam Nga2和xekatam
- xenamnoy2水电站。其中一些工厂已经完成建设,正
在检查或测试中,其余电厂也基本完成。
将于明年完工的11座水电站每年将有大约363MW
的生产能力,发电量约为1,787.24吉瓦时。目前,南森
(Nam Som)电厂建设已完成了96%以上,Nam Tha1
和Nam Hinboun水电站均完成约90%,Nam Peun1
和Nam Mon也几乎完成了80%。
另外有14家公司的年发电能力约为2,538.49兆瓦,
每年发电量约为14226.09吉瓦时。有19家公司的年发
电能力约为3,004.4兆瓦,每年发电量约为13541.31吉
瓦时。
报告指出,老挝电力生产商去年的发电量超过了
100亿千瓦时,价值超过15.4亿美元。该部门希望今年
的发电量能达到284亿千瓦时,价值超过17.6亿美元。
预计明年发电量将达到293.9亿千瓦时,价值超过18亿
美元。
目前,电力主要是出口到邻国,如中国、泰国和越
南,其余的用于当地使用。还可通过区域电力网络向买
家提供电力,如新加坡。
去年,共发电价值超过15.4亿美元,其中11亿美
元的电力用于出口。今年将生产电力17.6亿美元,其中
约13亿美元的出口额。老挝的目标是,到2025年总的
生产能力约为12万兆瓦。湄公河及其支流丰富的资源给
老挝提供了超过2.5万兆瓦的电力。
截至2017年6月,全国共有1,090,571户家庭接
入电网,占全国家庭的94.18%。政府预计到2020年这
个数字将上升到95%以上。