第6章 品牌组合MBA
MBA核心课程之市场营销案例集及参考答案

MBA核心课程之市场营销案例集及答案第一章市场营销的基本原理案例一不断创新的惠普公司案例二绅宝汽车的“牛排”战略案例三百事可乐——可口可乐之战第二章企业的战略规划和营销管理过程案例一“居安思危”的联华超市第三章营销环境分析案例一万家乐为何“乐”不下去了案例二石英技术誉满全球第六章市场调研案例一美国塑料公司所窥视的市场案例二道格拉斯公司的新产品第七章市场预测案例一三次失测苦汁自饮案例二康师傅方便面的成功之道第八章市场细分化、目标化和定位案例一“状元红”瓶酒二进大上海案例二美勒啤酒公司的市场细分策略第九章产品策略案例一推陈出新的施乐复印机公司案例二顾客需要购买哪种电话机——美国电报电话公司案例三建筑玩具的市场争夺战附思考题答案第一章市场营销的基本原理本章是市场营销学的引言部分,学习本章应明确市场营销学的性质、对象和方法,准确把握市场和市场营销的有关概念,正确认识市场营销管理的实质与任务,全面理解市场营销管理哲学的演变以及市场营销管理的新发展。
通过本章的学习对市场营销学有一个总体的概念,认识到本课程学习的重要性和必要性,为以后的学习打下基础。
案例一不断创新的惠普公司45年多来,惠普公司一直上是硅谷高科技主要的制造商之一。
该公司以其优绝的工程技术闻名于世,它在早期便成功地研制出了电子试验装置,这一成功使它成为集高技术于一身的飞速发展的公司。
1968年,惠普研制成了第一台小型计算机。
1972年推出的惠普3000型计算机始终是整个时期中电脑工业的畅销产品。
80年代中期,计算机成为惠普公司最大的销售产品,占公司销售额和税前利润的一半以上。
惠普公司以技术为先导,历来强调各部门高度自治,如由一部分销售人员出售试验仪器、另一部分销售人员出售计算机。
在整个过程中,惠普失去了协调分析仪器、试验仪器和计算机销售工作的宝贵机会。
然而在1984年7月,惠普公司改进了它的组织结构,以便集中权力、更好地销售产品。
公司任命了新的主管人员,形成了新的合作营销部门,并将计算机销售和仪器销售这两支队伍二合为一。
mba教学课件营销创建品牌资产

23568
9-34
21 795
8%
德国
SOURCE: The 100 Top Brands. BusinessWeek. August 6, 2007: p. 59
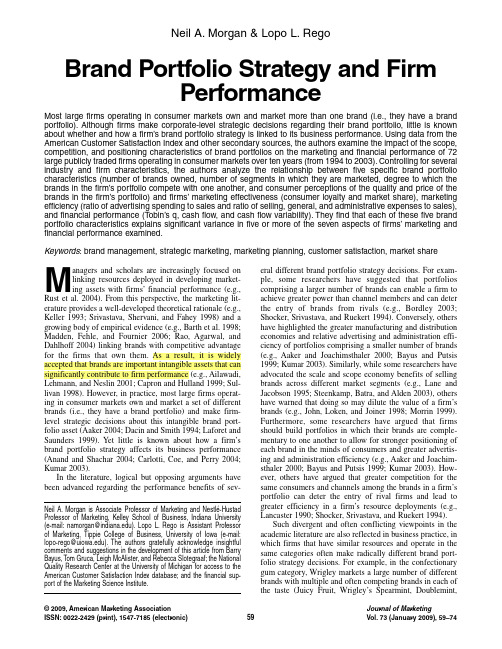
Interbrand品牌评价方法
市场细分
财务 分析
需求 驱动 力
竞争 基准
无形 资产 收入
品牌 化的 作用
品牌 力量
品牌 收入
个性化 整合
内部化
9-24
内部品牌化
• 选择恰当的时机 • 将外部营销和内部营销相联系 • 让品牌在员工中活起来
9-25
联合品牌和成分品牌
9-26
品牌延伸
优势
• 提高成功的机会 • 建立顾客正面的期望 • 零售商支持 • 加大当前品牌的知名度 • 广告、包装和分销的规模
品牌价值(未来品牌收入的净限制)
9-35
品牌资产模型
• 品牌资产评估模型 • 艾柯模型
• BRANDZ模型 • 品牌共鸣模型
9-36
品牌资产评估的关键要素
差异 能量 相关 尊敬 知识
9-37
品牌动态金字塔
纽带 利益 性能 相关 出现
9-38
强关系 弱关系
艾柯模型
品牌身份 延伸身份要素
核心身份要素 品牌精髓
国家
65 324
67 000
- 3%
美国
58 709
56 926
3%
美国
57 091
56 201
2%
美国
51 569
48 709
5%
美国
30 954
32 319
- 4%
美国
32 070
品牌营销与管理第六课

• (二)品牌识别模型内容
产品 识别
个人 识别
品牌 识别
符号 识别
组织 识别
戴维阿克品牌识别模型内容
• 1、产品识别 • 产品范围、属性、品质/价值、用途、使用 者、原产国 • 2、符号识别 • 品牌名称、标志、口号、音乐、代言人、 外观及传奇等 • 如:IBM蓝巨人标志代表深奥高精尖端科技、 麦当劳音乐给人一种欢乐感觉
• 4、以人们的日常用语命名 • 小雨点(灵芝饮料)、光明(牛奶)、好劲道(方便面)、 好娃娃(儿童饮料) • 5、以吉祥语命名 • 金六福(白酒)、福星(白酒)、福满多(方便面)、富 康(汽车) • 6、以文化名人命名 • 阿净嫂(防霉剂)、诗仙太白(白酒) • 7、以当前炒热的词语,媒体上经常出现的名词命名 • 奇瑞QQ • 8、借付谐音搭便车 • 千百惠(化妆品)、麦包包(包类网站)
第六章 品牌识别与品牌符号
掌握 戴维.阿克品牌识别模型 品牌口号类型 品牌视觉系统 理解
•卡普菲勒品牌识别棱镜模型
•品牌命名基本原则与程序
第一节 品牌识别模型
一、戴维.阿克品牌识别模型 (一)品牌识别模型的结构 美国品牌专家戴维.阿克在1996年提出品牌识别模型,主要 包括由内而外三层结构:核心层的品牌精髓、中间层的品牌 核心识别以及外层的品牌延伸识别
• (二)电通蜂窝模型 • 基于消费者认知层次分析的品牌策略模型,也是潜 在顾客的品牌认知模型,有权威基础、符号、情感 利益、功能性利益、品牌个性、理想顾客形象
权威 基础 品 牌 核 心 价 品牌 值 个性
符号
功能性 利益
理想 顾客 形象
情感 利益
• • • • • •
(三)达彼斯品牌轮盘 1、有形资产 品牌属性:物理与功能属性 品牌利益:消费者使用效果 2、无形资产 品牌价值:消费者使用后感受与对他人影 响 • 品牌个性:品牌人格化属性
品牌组合策略的内容与含义

品牌组合策略的内容与含义
品牌组合策略是指企业在市场上同时使用多个品牌,通过这些品牌之间的协调和互补来实现整体营销目标的一种策略。
品牌组合策略可分为以下几种类型:
1. 同一品牌多产品策略:同一品牌下推出多款不同系列或不同规格的产品。
例如,可口可乐公司旗下有可口可乐、雪碧、芬达等多款产品。
2. 多品牌战略:一个企业拥有多个独立品牌,在不同领域竞争。
例如,宝洁公司旗下拥有许多品牌,如潘婷、海飞丝、汰渍等。
3. 子品牌战略:企业在原有品牌基础上推出新的子品牌,以满足不同的市场需求。
例如,宝马推出了MINI作为其子品牌。
4. 品牌扩展策略:企业在已有品牌的基础上,推出新的产品线或服务,以扩大品牌的影响力和市场份额。
例如,苹果公司从最初的电脑制造商发展成为手机、平板电脑等多元化产品线。
品牌组合策略的内容包括:
1. 品牌命名:企业需要为每个品牌设计一个独特的名称,以便消费者识别和记忆。
2. 品牌定位:每个品牌需要有明确的定位,明确其目标市场和受众群体。
3. 品牌形象:每个品牌需要有独特的视觉和语言风格,以区分其他品牌和吸引受众。
4. 品牌协调:企业需要协调不同品牌之间的关系,使它们之间
互相支持和协作,而不是竞争和冲突。
品牌组合策略的含义在于,通过使用多个品牌来扩大企业的市场份额,提高品牌认知度和忠诚度,从而实现整体营销目标。
适当的品牌组合可以帮助企业更好地满足不同受众的需求,提高市场覆盖率和销售额。
品牌组合核心内容PPT课件

• 品牌使用策略 • 品牌组合决策
一 品牌使用策略
• 单一品牌策略 • 个别品牌策略 • 类别品牌策略家族品牌策略 • 联合品牌策略 • 成分品牌策略 • 多层品牌策略 • 主副品牌策略
1单一品牌品牌corporate brand
• 在所有产品上使用同一个品牌 • TCL • Red Bull • Dell
品牌组合的基本决策问题
• 多少品牌层级 品牌 类别品牌 子品牌 托收 品牌
• 每一层级的品牌与多少产品 • 希望每一层级品牌的知名度和形象怎样 • 在同一产品上不同层级品牌要素如何结合
1 层级数量:简化&清晰
确定出层级结构的分层数 精简法则:分层要尽量少 清晰法则:所有品牌要素间的逻辑和关系必
• 品牌层次 • 家族品牌层次 • 个体品牌层次 • 遵循的原则
– 相关性:建立的抽象联想所涉及到的单品要 尽可能多
– 差异性:单品和品牌要实现差别化
品牌组合中的品牌角色
侧面部队
现金牛
低端入门品牌
高端威望品牌
4 同一产品上不同层级品牌要素如何结合
General Mills
显著性原则
有效的品牌层级结构…
维珍Virgin
• 维珍Virgin的创始人利用这一品牌进入音乐 旅游 时装 铁路运输 软饮料 宾馆 航空等完 全不同的领域;并取得了令大众惊讶 令这种 做法的批评家们迷惑的成就
单一品牌策略英国Virgin
Travel and Transport
Virgin atlantic维珍大西洋航 空 Virgin Bikes Virgin Cars Virgin Trains Virgin Net
须明显 清晰
耐克的品牌层级
品牌组合管理
©2009,American Marketing Association ISSN:0022-2429 (print),1547-7185 (electronic)Journal of MarketingVol.73 (January 2009),59–74Neil A.Morgan & Lopo L.RegoBrand Portfolio Strategy and FirmPerformanceMost large firms operating in consumer markets own and market more than one brand (i.e., they have a brand portfolio).Although firms make corporate-level strategic decisions regarding their brand portfolio, little is known about whether and how a firm’s brand portfolio strategy is linked to its business ing data from the American Customer Satisfaction Index and other secondary sources, the authors examine the impact of the scope, competition, and positioning characteristics of brand portfolios on the marketing and financial performance of 72 large publicly traded firms operating in consumer markets over ten years (from 1994 to 2003).Controlling for several industry and firm characteristics, the authors analyze the relationship between five specific brand portfolio characteristics (number of brands owned, number of segments in which they are marketed, degree to which the brands in the firm’s portfolio compete with one another, and consumer perceptions of the quality and price of the brands in the firm’s portfolio) and firms’marketing effectiveness (consumer loyalty and market share), marketing efficiency (ratio of advertising spending to sales and ratio of selling, general, and administrative expenses to sales), and financial performance (Tobin’s q, cash flow, and cash flow variability).They find that each of these five brand portfolio characteristics explains significant variance in five or more of the seven aspects of firms’marketing and financial performance examined.Keywords:brand management, strategic marketing, marketing planning, customer satisfaction, market shareNeil A.Morgan is Associate Professor of Marketing and Nestlé-Hustad Professor of Marketing, Kelley School of Business, Indiana University (e-mail:namorgan@).Lopo L.Rego is Assistant Professor of Marketing, Tippie College of Business, University of Iowa (e-mail: lopo-rego@).The authors gratefully acknowledge insightful comments and suggestions in the development of this article from Barry Bayus, Tom Gruca, Leigh McAlister, and Rebecca Slotegraaf;the National Quality Research Center at the University of Michigan for access to the American Customer Satisfaction Index database;and the financial sup-port of the Marketing Science Institute.eral different brand portfolio strategy decisions. For exam-ple, some researchers have suggested that portfolios comprising a larger number of brands can enable a firm to achieve greater power than channel members and can deter the entry of brands from rivals (e.g., Bordley 2003; Shocker, Srivastava, and Ruekert 1994). Conversely, others have highlighted the greater manufacturing and distribution economies and relative advertising and administration effi-ciency of portfolios comprising a smaller number of brands (e.g., Aaker and Joachimsthaler 2000; Bayus and Putsis 1999; Kumar 2003). Similarly, while some researchers have advocated the scale and scope economy benefits of selling brands across different market segments (e.g., Lane and Jacobson 1995; Steenkamp, Batra, and Alden 2003), others have warned that doing so may dilute the value of a firm’s brands (e.g., John, Loken, and Joiner 1998; Morrin 1999). Furthermore, some researchers have argued that firms should build portfolios in which their brands are comple-mentary to one another to allow for stronger positioning of each brand in the minds of consumers and greater advertis-ing and administration efficiency (e.g., Aaker and Joachim-sthaler 2000; Bayus and Putsis 1999; Kumar 2003). How-ever, others have argued that greater competition for the same consumers and channels among the brands in a firm’s portfolio can deter the entry of rival firms and lead to greater efficiency in a firm’s resource deployments (e.g., Lancaster 1990; Shocker, Srivastava, and Ruekert 1994).Such divergent and often conflicting viewpoints in the academic literature are also reflected in business practice, in which firms that have similar resources and operate in the same categories often make radically different brand port-folio strategy decisions. For example, in the confectionary gum category, Wrigley markets a large number of different brands with multiple and often competing brands in each of the taste (Juicy Fruit, Wrigley’s Spearmint, Doublemint,M anagers and scholars are increasingly focused on linking resources deployed in developing market-ing assets with firms’financial performance (e.g., Rust et al. 2004). From this perspective, the marketing lit-erature provides a well-developed theoretical rationale (e.g., Keller 1993; Srivastava, Shervani, and Fahey 1998) and a growing body of empirical evidence (e.g., Barth et al. 1998; Madden, Fehle, and Fournier 2006; Rao, Agarwal, and Dahlhoff 2004) linking brands with competitive advantagefor the firms that own them. As a result, it is widely accepted that brands are important intangible assets that can significantly contribute to firm performance (e.g., Ailawadi, Lehmann, and Neslin 2001; Capron and Hulland 1999; Sul-livan 1998). However, in practice, most large firms operat-ing in consumer markets own and market a set of different brands (i.e., they have a brand portfolio) and make firm-level strategic decisions about this intangible brand port-folio asset (Aaker 2004; Dacin and Smith 1994; Laforet and Saunders 1999). Yet little is known about how a firm’s brand portfolio strategy affects its business performance (Anand and Shachar 2004; Carlotti, Coe, and Perry 2004; Kumar 2003).In the literature, logical but opposing arguments have been advanced regarding the performance benefits of sev-59E xtra), breath-freshening (Winterfresh, Big Red, E clipse), oral care (Orbit, Freedent), and wellness (Alpine, Airwaves) segments. Its major competitor, Cadbury, markets only four brands (Bubbas, Hollywood, Dentyne, and Trident), each of which is aimed at different segments. Similarly, in the lodging industry, Ramada markets a single brand across multiple value and midmarket segments, while Marriot addresses the whole market, using a portfolio of ten major brands, several of which compete with one another (e.g., in the suites segment, Residence Inn, Springhill Suites, and TownePlace Suites).Remarkably, despite these opposing theoretical view-points in the literature and evident divergence in “theories in use” among firms, there is little or no empirical evidence to guide managers’brand portfolio strategy decisions (Hill, Ettenson, and Tyson 2005). Given the importance of brands to strategic marketing theory explanations of firm perfor-mance and the significant resources that firms expend on brand building, acquisition, and management, this is an important gap in marketing knowledge.We address this knowledge gap by empirically examin-ing the relationship between the brand portfolio strategy characteristics of 72 large firms operating in consumer mar-kets and their marketing and financial performance over the 1994–2003 period. Collectively, these firms generate annual sales revenues of more than $1 trillion from marketing approximately 1300 brands across 16 industries. We begin by examining the literature pertaining to important dimen-sions of firms’brand portfolio strategy, identifying the major theoretical arguments associated with each brand strategy dimension, and providing relevant examples of current busi-ness practice. Next, we describe our research design in rela-tion to the data set assembled and the analysis approach adopted. We then present and discuss the results of our analyses. Finally, we consider the theoretical and manage-rial implications of our results, note some limitations of our study, and highlight avenues for further research.Dimensions of Brand PortfolioStrategyThe literature indicates that three key aspects of a firm’s brand portfolio strategy are (1) scope, which pertains to the number of brands the firm owns and markets and the num-ber of market segments in which it competes with these brands; (2) competition, which pertains to the extent to which brands within the firm’s portfolio compete with one another by being positioned similarly and appealing to the same consumers; and (3) positioning, which pertains to the quality and price perceptions of the firm’s brands among consumers (e.g., Aaker 2004; Chintagunta 1994; Porter 1980). Together, these three characteristics provide a rich picture of a firm’s brand portfolio strategy. For example, Gap Inc. currently markets eight brands (Old Navy, Gap, BabyGap, GapBody, GapKids, Banana Republic, Piper-lime, and Forth & Towne) across six North American Indus-try Classification System market segments in the retail apparel industry (men’s clothing stores, women’s clothing stores, family clothing stores, clothing accessories stores, shoe stores, and electronic shopping); has a relatively lim-ited amount of competition between its brands (some com-petition between Old Navy and Gap, but little or no compe-tition between the remaining brands); and maintains a medium quality–medium price overall positioning profile among consumers (lower price–lower quality positioning for Old Navy; medium price–medium quality for Gap, BabyGap, GapBody, GapKids, and Piperlime; and slightly higher price–higher quality for Banana Republic and Forth & Towne).Next, we consider each of these dimensions of brand portfolio strategy in greater detail. We discuss each dimen-sion separately in accordance with the literature on which we draw. Thus, most of the literature-based arguments have been framed in unidimensional ceteris paribus terms, even though brand portfolio strategy is widely viewed as a com-plex multidimensional phenomenon. Because both the theo-retical literature and “theories in use” evident in business practice offer support for opposing arguments for most of the key dimensions of brand portfolio strategy we identify, we elaborate on these arguments but do not offer formal hypotheses. Rather, we adopt an exploratory approach and treat the performance outcomes associated with each brand portfolio strategy characteristic as an empirical question. Brand Portfolio ScopeNumber of brands. The literature indicates several bene-fits associated with brand portfolios that comprise a large rather than small number of brands. In particular, it has been suggested that owning a larger number of brands enables a firm to attract and retain the best brand managers and enjoy synergies in the development and sharing of spe-cialized brand management capabilities, such as brand equity tracking, market research, and media buying (e.g., Aaker and Joachimsthaler 2000; Kapferer 1994); to build greater market share by better satisfying heterogeneous consumer needs (e.g., Kekre and Srinivasan 1990; Lan-caster 1990); to enjoy greater power than media owners and channel members (e.g., Capron and Hulland 1999; Putsis 1997); and to deter new market entrants (e.g., Bordley 2003; Lancaster 1990). Conversely, the literature also sug-gests that larger brand portfolios are inefficient because they lower manufacturing and distribution economies (e.g., Finskud et al. 1997; Hill, Ettinson, and Tyson 2005; Laforet and Saunders 1999) and dilute marketing expenditure (e.g., Ehrenberg, Goodhardt, and Barwise 1990; Hill and Lederer 2001; Kumar 2003). In addition, brand proliferation has been identified as a potential cause of weakened brand loy-alty and increased price competition across many markets (Bawa, Landwehr, and Krishna 1989; Quelch and Kenny 1994), suggesting more potential costs associated with larger brand portfolios.Mirroring these competing viewpoints in the literature, divergent brand portfolio strategies with respect to the num-ber of brands owned by firms may also be observed in prac-tice. In consumer packaged goods over the past five years, for example, seeking to enhance its profitability, Unilever has implemented a strategy of pruning its brand portfolio from 1200 to 400, and H.J. Heinz has also embarked on a portfolio rationalization strategy. During the same period, however, Nestlé has grown its brand portfolio aggressively60/ Journal of Marketing,January 2009through its acquisition of Ralston Purina, Chef America, Dreyer’s, Gerber, and Novartis Medical Nutrition. Simi-larly, increasing the number of brands in its portfolio to enhance the company’s power relative to retailers and media owners has been proffered as the logic for Procter & Gamble’s recent acquisition of Gillette.Number of market segments. The number of different segments in which a firm markets its brands indicates the scope of its product-market coverage within an industry. Studies of firm diversification suggest that strong marketing links, such as common brands, among the different seg-ments in which a firm operates may deliver economies-of-scope benefits in the firm’s expenditures to create and main-tain its brand portfolio (e.g., Grant and Jammine 1988; Palich, Cardinal, and Miller 2000). Conversely, the market-ing literature indicates that extending a brand across multi-ple market segments can weaken the brand, depending on consumer perceptions of the “fit” among the different product-market segments (e.g., Aaker and Keller 1990; Bro-niarczyk and Alba 1994). Therefore, in marketing its brands across multiple segments, a firm runs the risk that it will dilute their strength, making them less valuable (e.g., John, Loken, and Joiner 1998; Morrin 1999). Because most large firms own multiple brands, to avoid this dilution risk, a firm may choose to market different brands in each market seg-ment in which it operates. However, the marketing literature suggests that lowering the risk of entering new markets is an important benefit of owning a brand that a firm can leverage (e.g., Kapferer 1994). Therefore, failing to lever-age a brand across more than one segment is likely to both raise the risks associated with a firm’s decision to enter additional segments and limit the economies of scope avail-able from a multisegment market coverage decision.Reflecting these different viewpoints in the literature, in practice, we also note diverse brand portfolio strategy deci-sions in terms of the number of segments in which firms market their brands. For example, Sara Lee recently reduced the number of product-market segments in which it markets its food brands by disposing its coffee-related brands. At the same time, however, J.M. Smucker has recently expanded the number of categories in which its existing brands compete and has entered several additional new segments through its recently acquired Jif, Crisco, and Pillsbury brands. Similarly, in the apparel industry, Fruit of the Loom markets its brands to the midmarket adult and children’s segment across a small number of product cate-gories (underwear, T-shirts, sweatshirts), while VF Corpora-tion markets its brands to a far greater number of consumer segments at different price points, selling a much wider range of products in the jeanswear, outdoorwear, sports-wear, shoes, and intimate apparel categories. Intraportfolio CompetitionThe literature offers different viewpoints regarding the per-formance effects of intraportfolio competition (i.e., the extent to which brands within the firm’s portfolio are posi-tioned similarly to one another and compete for the same consumers’spending). On the one hand, the literature sug-gests several performance downsides, including lower price premiums from channel members and consumers (e.g.,Aaker and Joachimsthaler 2000), lower “bang for the buck”in advertising expenditures as a result of demand cannibali-zation among the firm’s brands (e.g., Kapferer 1994; Park, Jaworski, and MacInnis 1986), and lower administrative efficiency as a result of duplication of effort (e.g., Laforet and Saunders 1994). However, the literature also indicates several benefits from intraportfolio competition, including competition for channel resources and consumer spending creating an “internal market,” leading to greater efficiency and better resource allocations (Low and Fullerton 1994; Shocker, Srivastava, and Ruekert 1994); creating a barrier to entry for potential rivals (e.g., Scherer and Ross 1990; Schmalensee 1978); and mitigating the negative effects of variety-seeking consumers’brand-switching behavior on the firm’s performance (e.g., Feinberg, Kahn, and McAlister 1992).In practice, there also appear to be different “theories in use” with regard to the costs and benefits of intraportfolio competition. For example, Unilever, the second-largest player in the global home care category, markets two laun-dry detergent brands in the United States: Wisk, targeted at performance-oriented consumers and positioned as the most efficacious laundry detergent, and All, positioned as a value brand and targeted at price-sensitive consumers. Mean-while, Procter & Gamble markets seven laundry detergent brands (Bold, Dreft, E ra, Gain, Ivory Snow, Cheer, and Tide), some of which compete with one another for con-sumer spending and retail support. Similarly, in the blended scotch whiskey and gin categories, the largest player, Dia-geo, markets multiple brands that appeal to similar con-sumers of blended scotch (e.g., Bells, Black & White, Haig, J&B) and gin (Gordon’s, Gilbey’s, Tanqueray), while the second-largest supplier, Pernod Ricard, markets only two major blended scotch brands (Chivas Regal and Ballan-tine’s), which are priced to appeal to different segments, and only one gin brand (Beefeater).Brand Portfolio PositioningPerceived quality. Perceived quality pertains to the strength of positive quality associations for the brands in the firm’s portfolio in the minds of consumers (e.g., Gale 1992; Smith and Park 1992). Much of the value of a brand is related to its ability to reduce consumer risk, and brands that are perceived as high quality deliver greater consumer risk-reduction value (Aaker and Keller 1990; Smith and Park 1992) and superior financial returns to their owners (e.g., Aaker and Jacobson 1994). High-quality brands also enjoy greater price premiums (e.g., Sivakumar and Raj 1997), and the perceived quality of multiple products bearing the same brand name affects the overall value of the brand (e.g., Randall, Ulrich, and Reibstein 1998). As a result, marketing actions, such as price promotions, provide greater returns for high-quality than low-quality brands (e.g., Allenby and Rossi 1991; Blattberg and Wisniewski 1989; Kamakura and Russell 1989), and high-quality brands suffer less negative demand impact from price increases (Sivakumar and Raj 1997) and require less advertising expenditure and fewer price reductions (Agrawal 1996).Perceived price. Perceived price pertains to consumer perceptions of the price of the brands in the firm’s portfolioBrand Portfolio Strategy and Firm Performance / 61(e.g., Dacin and Smith 1994; Gale 1994). Consumer price perceptions are widely believed to be fundamental determi-nants of consumer brand choice and postpurchase attitudes and behavior (e.g., Dodds, Monroe, and Grewal 1991; Zeit-haml 1988). The extent to which consumers perceive the brands in the firm’s portfolio as being lower in price, ceteris paribus, should result in greater customer satisfaction and loyalty (e.g., Chaudhuri and Holbrook 2001; Gale 1994) and thus lead to enhanced sales and market share, which in turn may lead to economies of scale and superior financial performance (e.g., Aaker 1991; Woodruff 1997).Therefore, the literature suggests the potential perfor-mance benefits of achieving a brand portfolio positioning in which consumers perceive the firm’s brands as being both high quality and low price, and there are examples of firms’brands that have achieved such a position (e.g., Target, Southwest Airlines). However, achieving both positions simultaneously for all the brands in a firm’s portfolio may also be difficult and relatively rare in practice. For example, consumers often use price as a quality cue, making it diffi-cult to achieve perceptions of both high quality and low price (e.g., Kirmani and Rao 2000). In addition, achieving strong quality perceptions among consumers is often expen-sive because it may involve using higher-quality raw mate-rials or better-trained service operatives, superior manufac-turing or operations technologies, and greater marketing communication expenditures (e.g., Rust, Zahorik, and Kein-ingham 1995). Such additional costs can make it difficult to sell the firm’s brands at prices that consumers will perceive as low cost.These trade-offs are widely reflected in business prac-tice, with many examples of firms in the same category adopting different brand strategy portfolio positions. For example, in the wine and spirits category, LVMH markets a collection of high-quality, high-price brands (Moët & Chan-don, Hennessy, Cloudy Bay, and Château d’Yquem), while Constellation Brands markets a portfolio of medium- and lower-quality brands that are sold at much lower price points (e.g., Banrock Station, Paul Masson, J. Roget, Fleischmann’s). Similarly, in the hotel industry, Choice Hotel’s brand portfolio (Sleep Inn, E cono Lodge, Quality Inn, Clarion, Comfort Inn, Comfort Suites, Rodeway Inn, MainStay Suites) has a different quality and price position-ing than that of Starwood (Four Points, Sheraton, St. Regis, Westin, W).Research DesignDataTo explore empirically the performance impact of brand portfolio strategy, we used the firms in the American Cus-tomer Satisfaction Index (ACSI) as our sampling frame. The ACSI collects annual data from more than 65,000 U.S. consumers of the products and services of more than 200 Fortune500 companies (in 40 different industries whose sales account for approximately 42% of U.S. gross domes-tic product) to measure consumers’evaluations of their con-sumption experiences (for details, see Fornell et al. 1996). This is an appropriate sampling frame for two main reasons. First, the ACSI collects data on several consumer brand per-ceptions that are required to operationalize the constructs of interest in our study. Second, most ACSI firms are publicly traded, which enables us to collect performance data from secondary sources. As detailed subsequently, we also col-lected data on both brand portfolio characteristics and sev-eral industry- and firm-level control variables from other secondary sources, including Hoover’s and COMPUSTAT. Table 1provides descriptive statistics for each of the variables in our data set.TABLE 1Descriptive Statistics (N= 447)Variable M SD SE Minimum Mdn Maximum Firm PerformanceT obin’s q 1.620 1.121.053.097 1.3178.829 Cash flow2,6554,746224–1,15088633,764 Cash flow variability 3.340.782.037.000 3.3497.415 Advertising spending-to-sales ratio.036.041.002.000.025.216 SG&A-to-sales ratio.233.084.004.038.236.486 Customer loyalty70.6147.726.36554.50070.46690.301 Relative market share.261.218.010.009.172.905 Brand Portfolio StrategyNumber of brands18.03120.640.976 1.00012.00079.000 Number of segments 4.935 6.053.286 1.000 2.00035.000 Intraportfolio competition18.03214.016.663.00014.78669.803 Relative perceived quality83.298 6.616.31356.88884.56393.827 Relative perceived price60.189 2.829.13451.57860.59668.024 Firm and Industry CovariatesSize (total assets)28,19057,0352,6983728,070370,782 HHI (market concentration).353.168.008.155.284.828 Services dummy.134.341.016.000.000 1.000 Long interpurchase dummy.398.490.023.000.000 1.000 Notes:SG&A= selling, general, and administrative expenses, and HHI= Hirschman–Herfindahl index.62/ Journal of Marketing,January 2009Brand Portfolio Strategy and Firm Performance / 631All own-factor loadings are greater than .82, with cross-loadings all below .26, and a second-order factor analysis explains 53% of the variance in the two first-order factors.Brand portfolio strategy measures . Brand portfolio scope comprises two variables. First, we collected data on the number of brands owned by each firm in our data set from Hoover’s, which provides company information based on 10-K Securities and E xchange Commission filings. To ensure data consistency, we only counted the brands owned by each firm that are marketed in the industries for which the ACSI collects data. As Table 1 shows, the mean number of brands owned by the firms in these industries in our data set was greater than 18, with a median of 12. Second, for each industry for which we had ACSI data for a firm in our data set, we collected data on the number of segments (number of separate North American Industry Classification System operating codes) in which the firm marketed its brands from the Hoover’s database and validated this using COMPUSTAT data (correlation >.9). The mean number of market segments in which the firms competed was close to 5, with a median of 2.Intraportfolio competition pertains to the extent to which a firm markets multiple brands that compete with one another for consumer spending. We operationalized this measure as the interaction of two latent factors, the first of which captures the extent to which the firm markets multi-ple brands that appeal to demographically similar con-sumers in the same market segment and the second of which indicates the extent to which consumers perceive the brands in the firm’s portfolio as being positioned similarly.The intuition is that when a firm markets multiple brands that appeal to similar consumers and are perceived by these consumers as being positioned similarly, higher intraportfo-lio competition is likely to occur.The first factor captures the extent to which the firm markets multiple brands to the same consumers using two indicants: (1) the number of brands marketed by the firm per market segment in which the firm competes (number of brands/number of segments served) and (2) a demographic dissimilarity score for the consumers of the firm’s brands computed using consumer-level ACSI data on sex, age,income level, education, household size, and ing ACSI data, the second factor captures the similarity of the positioning of the brands in the firm’s portfolio as the standard deviations of the perceived quality and perceived price reported by consumers for the brands the firm owns.Together, these two factors explain 82% of the variance in the four indicants and are clearly separable.1We scaled both factors to range from 0 to 10 and computed their interaction term to use as our measure of intraportfolio competition. To assess the face validity of our measure, we selected six pairs of firms operating in six different markets in which the rela-tive degree of intraportfolio competition of each firm is well known and significantly different within each pair. In each case, our measure correctly indicated these known differ-ences (see Appendix A).Finally, we assessed brand portfolio positioning using two variables from the ACSI: perceived quality and per-ceived price. The perceived quality of the brands in the2The relative closeness of the perceived price scores comparedwith those of intraportfolio competition in Appendix A is to be expected because our ACSI sampling frame primarily includes mass-market suppliers, which limits more extreme price differences.3For every ACSI industry sector, data are collected for the largest (by sales revenue) firms, which collectively accounts for at least 70% of the total sales in that industry. Therefore, the marketfirm’s portfolio is a latent variable estimated using con-sumer responses to three questions as indicators; overall quality, reliability, and customization. This variable is scaled to range from 0 (low) to 100 (high); the mean level of perceived quality of the brand portfolios of the firms in our sample is greater than 83. We computed the perceived price of the brands in the firm’s portfolio by regressing per-ceived quality onto the ACSI’s consumer perceived value measure (a latent variable estimated from consumer responses to questions about quality given price and about price given quality) and estimating the residuals. These residuals represent the variance in customer perceived value that is not explained by perceived quality. Because per-ceived value is defined and measured in terms of customers’perceptions of the product/service quality obtained for the price paid (e.g., Zeithaml 1988), these residuals are an appropriate indicator of perceived price. We then rescaled the perceived price variable and inverted it to range from 0(lower perceived price) to 100 (higher perceived price); in our sample, the average level is approximately 60. To assess the face validity of our measure, we selected five pairs of firms operating in five different markets in which the rela-tive price of the brands in each firm’s portfolio is well known and is different within each pair. In each case, our measure correctly indicated these known differences (see Appendix A).2In addition, the relative ordering of firms in the other industries in our data set on the perceived price variable aligned well with expectations based on known price information.Marketing performance measures . We examine the effi-ciency of firms’marketing resource utilization using two indictors: the ratio of advertising spending to sales (COM-PUSTAT items No. 45:No. 12) and the ratio of selling, gen-eral, and administrative (SG&A) spending to sales (COM-PUSTAT items Nos. 189–45:No. 12). As Table 1 shows, the mean relative advertising expenditure among the firms in our sample was approximately 3.6% of sales revenue, and the mean SG&A expenditure was 23.3% of sales revenue.To indicate the effectiveness of the firm’s marketing efforts, we use two variables. First, we obtained consumer loyalty to the brands in the firm’s brand portfolio from the ACSI database. This is a latent variable comprising con-sumer responses to one repurchase likelihood question (“How likely are you to repurchase this brand/company?”)and one price sensitivity question (“How much could the price for this brand/company be raised and you would still purchase it?”). This measure is scaled between 0 (less loyal)and 100 (more loyal); in our sample, the average is greater than 70. Second, using ACSI industry definitions, we computed industry-level aggregate sales and divided this by each individual firm’s sales in the industry to obtain relative market shares for the companies in our data set.3We。
MBA第三部分-PPT文稿

品牌名称举例
1、人名:菲利浦、松下、张小泉、李宁 2、地名:青岛啤酒、北京吉普 3、动物名:雕牌、白象、小天鹅 4、花草树木名:水仙、牡丹、杉杉、椰树 5、数字或数字与文字的组合:三枪、三洋、999、
555、21金维它 6、ቤተ መጻሕፍቲ ባይዱ宝”字:大宝、健力宝、护舒宝 、宝马
18
品牌名称举例
7、产品的组成成分:草珊瑚、两面针 8、引起美好联想的词:神奇、雅芳、奔腾、希望、
朱丽叶原则:朱丽叶曾说“名字算什么?即使我们 不称之为玫瑰,它照样会芬芳。”
确定品牌名称时,遵循乔伊那原则还是朱丽叶原则 并不最重要,而是要看广告被用来作为品牌的营销 传播手段的力度。
26
二、品牌和产品的关系
1、偿若某一品牌基于功能与其他品牌区别开 来,那么为该品牌选择的名称最好能体现产品的特 点。
28
四、在语言使用时可能出现的情况 1、品牌名称是否与司法保护有关。 2、名称是否会在语言里带有忌讳的涵义 。
——金利来
29
第三节 品牌名称设计的六个标准
1、可记忆 2、有意义性 3、可爱性 4、可转换型 5、可适应性 6、可保护性
——朗涛设计顾问公司专家提出
30
一般来说,能提高品牌认知的品牌名称通常: 简明朴实并易于读写:简洁好理解与记忆,易 于发音好传播。 Bic笔 可口可乐Coke拼读要符合语 言规则。 亲切熟悉而富有含义:品牌名称含义可以具体 或抽象。由于人物、地点、鸟类、动物及其他非生 物的名称已经在记忆中存在,以这些名字作为品牌 名称,消费者就不需要过多地学习和理解。克莱斯 勒“年轻、青年、有活力”、苹果电脑。 与众不同且独一无二:施乐、埃克森
——樱花胶卷:20世纪50年代,樱花公司在胶 卷市场占有率超过了50%,然而,后来富士的市场 份额越来越大,以至最终击败樱花公司,成为霸主。 根据调查,樱花公司失败的原因并不是产品质量问 题,而是产品名称。在日文里,“樱花”一词代表 软性的、模糊的、桃色的形象,樱花公司因此受到 其樱花牌胶卷名称的拖累。相反,“富士”一词则 同日本的圣山“富士山”联系在一起。
品牌组合战略管理

2021/6/16
23
3、品牌化的差异点的表现形式
(1)品牌化的特性
(2)品牌化的成分
(3)品牌化的服务
(4)品牌化的活动
七、品牌组合战略运营与品牌的活力点
1、创造和保持品牌活力的两种主要的策略
(1)在现有的品牌运营中,增加一些品牌活力
的内容。
2021/6/16
24
(2)通过品牌组合战略的运营,利用“品牌化 的活力点”给主品牌或子品牌注入活力。
6、保护伞品牌(umbrella brand)角色 : 就是在同一品牌之下定义一系列产品。例如,微 软公司 有Microsoft 0ffice Word、Microsoft office Excel 等产品。
2021/6/16
10
7、驱动角色(driver role):就是反映一个 品牌促使购买者做出购买决策的程度和说明使用 的经历。
2021/6/16
11
(三)品牌范围
品牌范围就是规定品牌组合中每个品牌所跨 越的领域。
(四)品牌组合的角色
1、战略性品牌(strategic brand):就是对 组织战略具有重要意义的品牌。
一般而言,战略性品牌有3种类型: (1)现有实力型品牌或大品牌(current power brand or megabrand):就是指目前为公 司带来重大销售额和利润的战略性品牌。
27
九、品牌组合战略的运营与品牌延伸
1、品牌延伸的涵义
品牌延伸就是指将现有品牌扩张至其他产品 族中去。进一步讲,就是将已经建立起品牌地位 的现有品牌,扩张到现有产品类别和新产品类别 当中,以达到以更少的营销成本占领更大市场份 额的基本目的。
2、品牌延伸的目的
(1)降低新产品导入市场的风险与成本。
- 1、下载文档前请自行甄别文档内容的完整性,平台不提供额外的编辑、内容补充、找答案等附加服务。
- 2、"仅部分预览"的文档,不可在线预览部分如存在完整性等问题,可反馈申请退款(可完整预览的文档不适用该条件!)。
- 3、如文档侵犯您的权益,请联系客服反馈,我们会尽快为您处理(人工客服工作时间:9:00-18:30)。
主讲 刘世雄 博士 副教授
第6章 品牌组合
品牌组合 品牌联合 贴牌生产 自有品牌
思考
品牌延伸与品牌组合有何区别?
品牌-产品矩阵
产品
1
2
…
N
A
品牌延伸
B
品
品牌
牌
组
…
合
M
品牌组合战略巨著
在这本万众瞩目的书中,本书的 作者——即《创建强势品牌》一书 的作者——世界著名的品牌专家戴 维·阿克教授向管理者们展示了如 何建立一种品牌组合战略,使之能 够支持整体的企业战略并创造相关 性、差异性、活力、平衡和清晰度。 借助对一些世界级品牌的案例研究, 如戴尔、迪斯尼、微软,索尼,多 芬、英特尔、花旗集团以及PowerBar,阿克向我们介绍了那些强有 力的、有凝聚力的品牌战略如何协 助管理者们使品牌组合中的主品牌、 子品牌、担保品牌、联合品牌和品 牌延伸变得令人困惑或臃肿时,如 何使之条理化。
向高端或低端扩展,推出新品牌(凌志、Acura、Infiniti;谷粒谷 力;)
减轻负担
每一个品牌都有一个承载产品信息的边界(派克;百胜)
欧莱雅各品牌的市场定位
品牌名称 赫莲娜
兰蔻 碧欧泉
植村秀 薇姿 理肤泉 巴黎卡诗 欧莱雅专业美发 巴黎欧莱雅 羽西 美宝莲 卡尼尔 美奇丝 小护士
市场定位 "超越时代之美";"美容界的科学先驱";提倡美容科学;消费群体的年龄相应偏高,具有 很强的消费能力 护肤、彩妆及香水系列的极品;消费者年龄比赫莲娜年轻一些,具有相当的消费能力 秉承"高尚的生活格调源于简约自然的保养"的护肤理念;面向具有一定消费能力的年轻时 尚消费者 专业彩妆、高档护肤品及专业化妆工具;面向时尚、具有国际视野的高收入年轻女性 提倡健康护肤的理念 皮肤科疾病的辅助性治疗产品 “洗、护、韵”美发理念;专业护发 “与众不同,展现自我”;专业美发 “巴黎欧莱雅,你值得拥有”,提供护肤、彩妆、及染发品;面向大众消费层 秉承“专为亚洲人的皮肤设计”的理念 亲和、时尚、活力、朝气;“美来自内心,美来自美宝莲”;面向大众消费层 以“健康之源美于自然”为宗旨,致力开发天然美容产品,面向大众消费层 “激情美发”;面向20-30岁的年轻、时尚人士,低端市场 “自然精华,健康肌肤”;面向追求自然美的年轻消费者,低端市场
品牌联合战略
品牌联合的定义 品牌联合的类型 品牌联合的作用与风险 品牌联合的管理原则
品牌联合的定义
品牌联合(co-branding)定义为“两个或者两个 以上消费者高度认可的品牌进行商业合作的一种 方式,其中所有参与的品牌名称都被保留”。 该定义有两点值得关注:
(1)联合在一起的品牌都是强势品牌,即所谓的“强 强联合”; (2)参与品牌的名称都要显示出来,而不是作为幕后 支持或影子担保。
含义
各品牌间的逻辑关系 例:广东移动
结构类型
横向结构:P&G 纵向结构:Microsoft-Windows-XP 联合结构:索爱;姗拉娜与Snoopy
6.组合图标
定义
跨品牌和不同环境的品牌视觉展示形式
内容
标识、包装、产品设计、符号、布局、广告语 相同与不同
作用
指示一套品牌中哪个处于相对驱动的位置(车标) 区分相互分开的两种品牌或两个系列(康师傅) 直观说明品牌组合的结构(雀巢)
品牌联合的类型(Interbrand)
接触/认知型品牌联合 (交行数字龙卡) 价值认可型品牌联合(互补型专业品牌;体育活 动;公益事业) 元素组成型品牌联合 (成分品牌化,比亚迪电动 车) 能力互补型品牌联合(劳力士手机 )
品牌联合的作用与风险
品牌联合的作用
深化了品牌内涵,强化了品 牌个性
安踏携手火箭
2007年11月9日,休斯顿火箭队老板莱斯利·亚历山大(左)向安踏体育用 品有限公司董事局主席兼首席执行官丁志忠赠送纪念球衣。 当日,安踏体育 用品有限公司在休斯顿举行的新闻发布会上宣布,安踏与NBA休斯顿火箭队签 署战略联盟协议,并与其旗下明星球员路易斯·斯科拉正式签约。
5.品牌组合结构
雀巢
品牌组合结构的分析方法
1. 凯勒的品牌层级理论
品牌层级的内涵 品牌等级树:横向和纵向维度;展示产品的清晰度
品牌分组:根据共有的、有意义的特征进行逻辑分组,包括 市场细分(Polo Ralph Lauren;Polo)、产品质量、产品设 计(paint collection、home collection)、产品品类、产品技 术(intel)、分销渠道(兰蔻百货商场、欧莱雅超市、薇姿 药房)
品牌关系 图谱
品牌化集 合体
子品牌
被担保品 牌
多品牌集 合
相同的识 别
不同的识 别
主品牌作 为驱动者
共同驱动
强势担保
关联名字
象征性担 保
影子担保
互不关联
各品牌组合战略的具体形式
品牌化集合体
相同的识别:中信 不同的识别:招商局集团
主品牌下的子品牌
主品牌作为驱动者:诺基亚 6300 共同驱动:丰田卡罗拉
思考
先举例,再说明为什么一家公司在同一个产品大 类当中采用多品牌战略。(比如宝洁)
自相残杀?
品牌组合的意义
协同效应
成功的大企业多数都是品牌兵团作战(北京现代;欧莱雅)
资源配置
不是所有的品牌对企业业绩的贡献都是一致的(联合利华的品牌 “瘦身运动” )
应对竞争
品牌组合为主力品牌保驾护航(福满多)
战略发展
品牌组合及品牌组合战略的定义
品牌组合(Brand Portfolio )
按照凯文·凯勒教授的观点,品牌组合是指公司出售的 各个特定产品大类下面所包含的所有品牌的组合。
建立品牌组合的3种策略
品牌开发、品牌并购、品牌联盟
品牌组合战略
品牌组合战略详细说明了品牌组合的结构,以及各品 牌的范围、职能和相互关系,处理多品牌组合以及某 一产品品牌层级的关系。
本田与讴歌
康师傅各地方便面
3.品牌范围
品牌在产品类别、子类别和市场上的跨度和边界
康师傅可用于西服吗?奔驰可以用于方便面吗?
3M 品牌范围是一个动态的概念
考虑未来发展中的范围、先后顺序以及建立哪些价值 联想 娃哈哈 梦特娇
4.品牌组合中的五种角色
战略品牌
对组织战略具有重要意义,必须取得成功 类型:当前的实力型品牌(windows)、未来的实力型品牌(酷睿 双核Core Duo)、关键品牌(可口可乐)
品牌组合战略的框架
定义产品时扮 演的角色
品牌范围
品牌组合
品牌组 合战略
组合结构
组合所扮 演的角色
组合图标
组合目标 协同作用 杠杆作用
相关性 强势品牌 清晰度
1.品牌组合
品牌组合包括一个组织所管理的所有品牌,包括 主品牌、担保品牌、子品牌、描述性品牌、产品 品牌、公司品牌、品牌化的差异点、品牌化的活 力点、品牌联合等。 品牌组合的基本问题是构成问题:增加或减少品 牌,是改变独立品牌还是子品牌 ? 例:通用汽车品牌组合
Polo Ralph Lauren
基于LOGO的Intel品牌组合战略
Aaker品牌关 系图谱
统一
独立
品牌化集合体(A branded house)指同一类别的产品通过统一的品牌维 系在一起,并延伸到新产品上(雀巢)。 子品牌(Subbrands under a master brand)指同一类别的产品冠以统一名 称,即主品牌的同时,根据产品的不同特征附加一个修饰性品牌,从而使 主品牌更独特(海尔帅王子)。 被担保品牌(Endorsed brand)通常指一个产品有两个以上品牌,一个是担 保品牌,一个是被担保品牌。担保品牌通常是企业品牌,为被担保品牌提 供信誉和保障。被担保品牌则相对独立,表明产品的功能、价值和购买对 象(可口可乐对酷儿)。 多品牌集合体(House of brands)指同一类别产品下不同品种不同品牌,各 个品牌相互独立,在各个细分市场施展自己最大的影响力(宝洁)。
被担保品牌
强势担保:雀巢奇巧 关联名字:麦乐鸡、麦辣鸡、 麦香鸡、麦香鱼、麦咖啡 象征性担保:宝洁品客薯片、 联合利华中华牙膏
多品牌集合体
影子担保:保利地产与保利 集团 互不关联:宝洁洗发水
思考
在Aaker的品牌关系图谱中,四种品牌间关系适用 条件是什么? 假如金威啤酒公司想生产一种类似于嘉士伯的高 端啤酒,新啤酒适于采用哪种品牌策略?为什么? (分小组讨论,时间4分钟)
奇瑞多功 能运动休
闲车
奇瑞轿车
ACTECO 发动机
奇瑞V5 奇瑞瑞虎 奇瑞QQ 奇瑞旗云 东方之子 奇瑞A5
奇瑞四大品牌
POLO Ralph Lauren
创始人:Ralph Lauren拉夫 劳伦 产品:男装、女装、运动装、体育用品、牛仔装、皮饰品、配件、香水、家饰品 注册地:美国纽约(1968年) 1939年Ralph Lauren出生于一个并不浪漫的俄国移民家庭,高中完成后,Ralph Lauren在纽约城市大学上了一个商业班,但两年后便放弃了。他在一个手套商处找到 一份工作,然后又到A. Rivetz & Co.卖上了领带。同期,他开始自己设计领带,最后找 到一个支持者,开始了自己的事业。他叫这个公司Polo Fashions。Polo领带都是意大 利多彩的花纹图案,而且比标准的领带宽两倍,当然也比标准的领带贵两倍。这些领 带一上市就象被风吹的蒲公英那样,迅速飞入了百户千家。 1968年,Ralph Lauren进军男装,很快找到了市场切入点。1972年,Ralph Lauren推 出了共24色的Polo恤衫 (Polo mesh shirt),为美国的“优皮士”(Yuppies) 提供了一款 合穿合用的日常服。这Polo恤衫从此成为Polo label的经典衣物(signature piece)。 虽然Polo label旗下拥有多个系列,但是在时装迷的心目中,Polo恤衫 (Polo mesh shirt) 始终最能代表Ralph Lauren这个金漆招牌。纯棉质制造,有恤衫般的衫领,两粒衫钮 的设计,衫袖贴身,左胸位置绣有经典马球标志;前幅短一些,后幅长一些,就这么 把身体的线条恰到好处的表现出来。Ralph Lauren旗下有多个系列,Ralph Lauren, Polo Ralph Lauren, Black Label, Blue Label, Purple Label, Polo Sport, Ralph Lauren Golf, Ralph Lauren Fragrances, Chaps, Polo Sport, Polo Jeans Co.每一个系列一个风 格,Ralph Lauren是高档高级成衣品牌,Polo Jeans Co是牛仔风格系列品牌,Polo Ralph Lauren是经典休闲风格品牌,经典的马球标志的Polo恤衫 (Polo mesh shirt) 就 是这个系列下面的。