Diagram chart 1 表格图形图表示例ppt模板
合集下载
PPT图表素材(全)
涉及要素
方案原则
工作思路
Cycle Diagram
Concept
Add Your Text
Add Your Text
Add Your Text
Add Your Text
Add Your Text
命名活动
成未来之势
用政府之手
调企业之能
取新城之名
激市民之智
聚专家之才
2002.10 Add Your Text2002.10 Add Your Text2002.10 Add Your Text
2003.10 Add Your Text2003.10 Add Your Text2003.10 Add Your Text
Click to edit text styles
Diagram
2003.10 Add Your Text2003.10 Add Your Text2003.10 Add Your Text
2000
2001
2002
2003
Company History
2001.10 Add Your Text2001.10 Add Your Text2001.10 Add Your Text
Add your text
YourSloganhere
25年以下10年以上(含10年)工龄职工。
适用:
不保留事业编制身份,转化为企业编制。
身份:
不保留岗位。
岗位
不再保留原岗位待遇,签订两年待岗合同,两年后上岗享受新实体员工待遇。
待遇:
1、
1、
1
1
1
方案目的
方案依据
Text5
DiagramΒιβλιοθήκη Text1Text2
公司汇报PPT常用图表模板
2000
2000.10 Add Your Text 2000.10 Add Your Text 2000.10 Add Your Text
2000.10 Add Your Text 2000.10 Add Your Text 2000.10 Add Your Text
Diagram
2003
2002
Click to add text
Click to add text
Click to add text
Click to add text
Add Title
Click to add text Click to add text Click to add text Click to add text Click to add text Click to add text Click to add text Click to add text
2000.10 Add Your Text 2000.10 Add Your Text 2000.10 Add Your Text
2001
2000.10 Add Your Text 2000.10 Add Your Text 2000.10 Add Your Text
2000
2000.10 Add Your Text 2000.10 Add Your Text 2000.10 Add Your Text
Diagram
Company History
2003
2000
2000.10 Add Your Text 2000.10 Add Your Text 2000.10 Add Your Text
2001
2002
2003.10 Add Your Text 2003.10 Add Your Text 2003.10 Add Your Text
有史以来最全的图表模板PPT课件
Text2 Text5
Text3 Text4
Diagram
Text1 Text6
Text2 Text5
Text3 Text4
Diagram
Add Your Text
Add Your Text
Add Your Text Add Your Text
Diagram
Add Your Text
Add Your Text
Diagram
Add Your Title
ThemeGallery is a Design Digital Content & Contents mall developed by Guild Design Inc.
Add Your Title
ThemeGallery is a Design Digital Content & Contents mall developed by Guild Design Inc.
Add your text here
Add your text here
Add your text here
Diagram
Text 1
Text 3
Text 2
Add your text here
Add your text here
Add your text here
Diagram
Text1 Text6
2
ThemeGallery is a Design Digital Content & Contents mall developed by Guild Design Inc.
3
ThemeGallery is a Design Digital Content & Contents mall developed by Guild Design Inc.
统计图表ppt.课件

案例五:产品满意度调查表
总结词
通过柱状图和饼图展示产品的满意度调查结 果,包括各评价维度的得分和占比。
详细描述
使用柱状图表示各评价维度的得分情况,使 用饼图展示各评价维度的占比,并添加相应 的文字说明和图表注解。
THANKS
感谢观看
统计图表的设计原则
01
明确目的
根据展示需求选择合 适的图表类型,确保 图表能够准确传达信 息。
02
简洁明了
避免过多的图表元素 和复杂的图表设计, 保持图表的简洁和易 读性。
03
数据可视化
将数据以直观、易懂 的方式呈现,突出关 键信息和数据变化。
04
对比与参照
合理运用对比和参照 ,帮助读者更好地理 解和分析数据。
科学研究
总结词
在科学研究中,统计图表是呈现实验结果和科学发现的常用 手段,有助于推动科学知识的传播和发展。
详细描述
利用曲线图记录实验过程中各项指标的变化趋势;通过表格 呈现详细的实验数据;使用流程图说明实验操作步骤和逻辑 关系等。
商业决策
总结词
在商业决策中,统计图表能够为决策 提供数据支持,帮助企业做出科学、 合理的决策,提高经营效率和盈利能 力。
统计图表PPT课件
目录
• 统计图表概述 • 常用统计图表 • 统计图表的应用场景 • 统计图表制作技巧 • 统计图表案例分析
01
统计图表概述
Chapter
统计图表的定义与作用
定义
统计图表是一种可视化工具,通过图形和表格的形 式展示数据,帮助人们快速理解和分析数据。
作用
统计图表能够清晰地呈现数据的分布、趋势和关系 ,提高数据的可读性和易理解性,有助于做出正确 的决策和判断。
有史以来最全的图表模板PPT课件
Add Your Text
-
14
Diagram
Add Your Text
Add Your Text
Add Your Text
Add Your Text
-
15
Diagram
Add Your Title
ThemeGallery is a Design Digital Content & Contents mall developed by Guild Design Inc.
Add Your Text
Add Your Text
Text1
Text1
-
Text1
Text1
22
Diagram
PowerPoint 2000
Add Your Text
Add Your Text
Text1
Text1
-
Text1
Text1
23
Diagram
1
ThemeGallery is a Design Digital Content & Contents mall developed by Guild Design Inc.
-
16
Diagram
Add Your Title
ThemeGallery is a Design Digital Content & Contents mall developed by Guild Design Inc.
Add Your Title
ThemeGallery is a Design Digital Content & Contents mall developed by Guild Design Inc.
PPT图表大全
text
Click here to add your title
Your text
Your text
Click here to add your text. Click here to add your text.
Click here to add your text. Click here to add your text. Click here to add you text.
Click here to add your text. Click here to add your text. Click here to add your text. Click here to add your text.
Click here to add your title
Click here to add your title
text.
Click here to add your text. Click here to add your text. Click here to add your text. Click here to add your text.
Click here to add your title
Click here to add your title
Your text
Your text
Your text
Click here to add your title
Your text
Your text
01 03
Click here to add your title
01
Your text
Click here to add your title
02
Click here to add your title
Your text
Your text
Click here to add your text. Click here to add your text.
Click here to add your text. Click here to add your text. Click here to add you text.
Click here to add your text. Click here to add your text. Click here to add your text. Click here to add your text.
Click here to add your title
Click here to add your title
text.
Click here to add your text. Click here to add your text. Click here to add your text. Click here to add your text.
Click here to add your title
Click here to add your title
Your text
Your text
Your text
Click here to add your title
Your text
Your text
01 03
Click here to add your title
01
Your text
Click here to add your title
02
简洁PPT柱状图条形图数据图大全
2
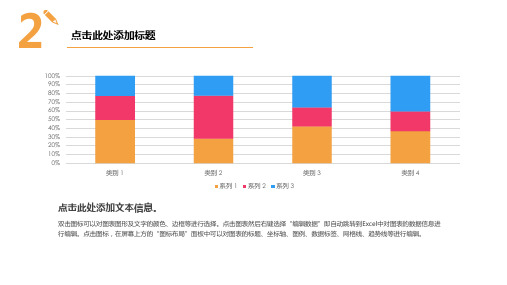
点击此处添加标题
100% 90% 80% 70% 60% 50% 40% 30% 20% 10% 0%
类别 1
类别 2 系列 1
系列 2
类别 3 系列 3
类别 4
点击此处添加文本信息。
双击图标可以对图表图形及文字的颜色、边框等进行选择。点击图表然后右键选择“编辑数据”即自动跳转到Excel中对图表的数据信息进 行编辑。点击图标,在屏幕上方的“图标布局”面板中可以对图表的标题、坐标轴、图例、数据标签、网格线、趋势线等进行编辑。
顶部“开始”面板中可 以对字体、字号、颜 色、行距等进行修改。
顶部“开始”面板中可 以对字体、字号、颜 色、行距等进行修改。
类别 1
类别 2
类别 3
类别 4
标题数字等都可以通过点击和重新输入进行更改,顶部“开始”面板中可以对字体、字号、颜色、 行距等进行修改。建议正文12号字,1.3倍字间距。
顶部“开始”面板中可 以对字体、字号、颜 色、行距等进行修改。
点击此处添加标题
A B C D
顶部“开始”面板中可以对字体、字号、颜色、 行距等进行修改。
顶部“开始”面板中可以对字体、字号、颜色、 行距等进行修改。
顶部“开始”面板中可以对字体、字号、颜色、 行距等进行修改。
顶部“开始”面板中可以对字体、字号、颜色、 行距等进行修改。
点击此处添加标题
A B C D
3
点击此处添加标题
A B C
双击图标可以对图表图形及文字的颜色、边框等进行选择。双击图标可以对图表图形及文字的颜色、边框等 进行选择。双击图标可以对图表图形及文字的颜色、边框等进行选择。
双击图标可以对图表图形及文字的颜色、边框等进行选择。双击图标可以对图表图形及文字的颜色、边框等 进行选择。双击图标可以对图表图形及文字的颜色、边框等进行选择。
PPT常用精美图表模板

with your own text
Read More
8 7 6 5 4 3 2 1 0
2014 2015 2016 2017 2018
YOUR TEXT
This is a placeholder text. This text can be replaced
with your own text
Read More
60%
30%
15
70%
Quickly repurpose top-line innovation before global communities. Efficiently benchmark progressive resources without competitive vortals. Globally exploit installed base niche markets after holistic ROI.
100%
200%
300%
400%
500%
Quickly repurpose top-line innovation before global communities. Efficiently benchmark progressive resources without competitive vortals. Globally exploit installed base niche markets after holistic ROI. Energistically impact open-source human capital without strategic materials.
250
200
150
100
50
Read More
8 7 6 5 4 3 2 1 0
2014 2015 2016 2017 2018
YOUR TEXT
This is a placeholder text. This text can be replaced
with your own text
Read More
60%
30%
15
70%
Quickly repurpose top-line innovation before global communities. Efficiently benchmark progressive resources without competitive vortals. Globally exploit installed base niche markets after holistic ROI.
100%
200%
300%
400%
500%
Quickly repurpose top-line innovation before global communities. Efficiently benchmark progressive resources without competitive vortals. Globally exploit installed base niche markets after holistic ROI. Energistically impact open-source human capital without strategic materials.
250
200
150
100
50