
SIHFR224中文资料
Power MOSFETIRFR224, IRFU224, SiHFR224, SiHFU224Vishay SiliconixFEATURES•Dynamic dV/dt Rating •Repetitive Avalanche Rated•Surface Mount (IRFR224/SiHFR224)•Straight Lead (IRFU224/SiHFU224)•Available in Tape and Reel •Fast Switching •Ease of Paralleling •Lead (Pb)-free AvailableDESCRIPTIONThird generation Power MOSFETs form Vishay provide the designer with the best combination of fast switching,ruggedized device design, low on-resistance and cost-effectiveness.The DPAK is designed for surface mounting using vapor phase, infrared, or wave solderig techniques. The straight lead version (IRFU/SiH FU series) is for through-hole mounting applications. Power dissipation levels up to 1.5 W are possible in typical surface mount applications.Notea.See device orientation.PRODUCT SUMMARYV DS (V)250R DS(on) (Ω)V GS = 10 V 1.1Q g (Max.) (nC)14Q gs (nC) 2.7Q gd (nC)7.8ConfigurationSingleORDERING INFORMATIONPackage DPAK (TO-252)DPAK (TO-252)DPAK (TO-252)IPAK (TO-251)Lead (Pb)-free IRFR224PbF IRFR224TRPbF a IRFR224TRLPbF a IRFU224PbFSiHFR224-E3SiHFR224T-E3a SiHFR224TL-E3a SiHFU224-E3SnPbIRFR224IRFR224TR a IRFR224TRL a IRFU224SiHFR224SiHFR224T aSiHFR224TL aSiHFU224ABSOLUTE MAXIMUM RATINGS T C = 25 °C, unless otherwise notedPARA ETER SY M BOL LI M IT UNIT Drain-Source Voltage V DS250VGate-Source Voltage V GS ± 20 Continuous Drain Current V GS at 10 VT C = 25 °C I D3.8A T C = 100 °C2.4Pulsed Drain Current a I DM 15Linear Derating Factor0.33W/°C Linear Derating Factor (PCB Mount)e 0.020Single Pulse Avalanche Energy b E AS 130mJ Repetitive Avalanche Current a I AR 3.8 A Repetitive Avalanche Energy a E AR 4.2mJ Maximum Power DissipationT C = 25 °C P D42WMaximum Power Dissipation (PCB Mount)e T A = 25 °C2.5Peak Diode Recovery dV/dt cdV/dt 4.8V/ns* Pb containing terminations are not RoHS compliant, exemptions may applyIRFR224, IRFU224, SiHFR224, SiHFU224Vishay SiliconixNotesa.Repetitive rating; pulse width limited by maximum junction temperature (see fig. 11).b.V DD = 50 V; starting T J = 25 °C, L = 14 mH, R G = 25 Ω, I AS = 3.8 A (see fig. 12).c.I SD ≤ 3.8 A, dI/dt ≤ 90 A/µs, V DD ≤ V DS , T J ≤ 150 °C.d. 1.6 mm from case.e.When mounted on 1” square PCB (FR-4 or G-10 material).Notea.When mounted on 1" square PCB ( FR-4 or G-10 material).Operating Junction and Storage Temperature Range T J , T stg- 55 to + 150°CSoldering Recommendations (Peak Temperature)for 10 s260dTHERMAL RESISTANCE RATINGSPARA ETER SYBOL TYP.AX.UNITMaximum Junction-to-Ambient(PCB Mount)a R thJA-50°C/W Maximum Junction-to-Ambient R thJA -110Maximum Junction-to-CaseR thJC-3.0ABSOLUTE MAXIMUM RATINGS T C = 25 °C, unless otherwise notedPARA ETER SY BOL LI IT UNIT M M MIRFR224, IRFU224, SiHFR224, SiHFU224Vishay SiliconixMM MIRFR224, IRFU224, SiHFR224, SiHFU224Vishay SiliconixIRFR224, IRFU224, SiHFR224, SiHFU224Vishay SiliconixFig. 12c - Maximum Avalanche Energy vs. Drain CurrentFig. 13a - Basic Gate Charge WaveformFig. 13b - Gate Charge Test CircuitIRFR224, IRFU224, SiHFR224, SiHFU224Vishay Siliconix Array Fig. 14 - For N-ChannelVishay Siliconix maintains worldwide manufacturing capability. Products may be manufactured at one of several qualified locations. Reliability data for Silicon Technology and Package Reliability represent a composite of all qualified locations. For related documents such as package/tape drawings, part marking, andreliability data, see /ppg?91271.Disclaimer Legal Disclaimer NoticeVishayAll product specifications and data are subject to change without notice.Vishay Intertechnology, Inc., its affiliates, agents, and employees, and all persons acting on its or their behalf (collectively, “Vishay”), disclaim any and all liability for any errors, inaccuracies or incompleteness contained herein or in any other disclosure relating to any product.Vishay disclaims any and all liability arising out of the use or application of any product described herein or of any information provided herein to the maximum extent permitted by law. The product specifications do not expand or otherwise modify Vishay’s terms and conditions of purchase, including but not limited to the warranty expressed therein, which apply to these products.No license, express or implied, by estoppel or otherwise, to any intellectual property rights is granted by this document or by any conduct of Vishay.The products shown herein are not designed for use in medical, life-saving, or life-sustaining applications unless otherwise expressly indicated. Customers using or selling Vishay products not expressly indicated for use in such applications do so entirely at their own risk and agree to fully indemnify Vishay for any damages arising or resulting from such use or sale. Please contact authorized Vishay personnel to obtain written terms and conditions regarding products designed for such applications.Product names and markings noted herein may be trademarks of their respective owners.元器件交易网。
FM24系列中文资料

引脚说明
串行时钟信号引脚(SCL):在 SCL 输入时钟信号的上升 沿将数据送入 EEPROM 器件,并在时钟的下降沿将数 据读出。
串行数据输入/输出引脚(SDA):SDA 引脚可实现双 向串行数据传输。该引脚为开漏输出,可与其它多个 开漏输出器件或开集电极器件线或连接。
器件/页 地址脚(A2,A1,A0):A2、A1 和 A0 引脚 为 FM24C02 的硬件连接的器件地址输入引脚。在一 个总线上最多可寻址八个 2K 器件。(器件寻址详见器 件寻址章节内容) 。
FM24C08
FM24C08A
全地址(4K)
正常读写 正常读写
全地址(8K)
FM24C16 高半区(8K)
存储器结构
FM24C02,2K 串行电可擦除存储器:内部分为 32 页, FM24C08(A),8K 串行电可擦除存储器:内部分为 64
每页 8 字节,以 8 位地址寻址。
页,每页 16 字节,以 10 位地址寻址。
SCL WP VCC GND NC
引脚功能
器件地址输入 串行数据输入输出 串行时钟输入 写保护 电源 地 不连接
FM24C02/04/08(A)/16 两线制串行 EEPROM
版本 2.2
技术手册
3
图 1.结构框图
FM24C02/04/08(A)/16 两线制串行 EEPROM
版本 2.2
技术手册
版本 2.2
技术手册
6
交流参数
推荐参数的适用工作条件:TA = -40°C ~ +85°C,VCC = +2.2V ~ +5.5V,CL = 1 TTL Gate and 100 pF(除非 另有说明)。测试条件参见“注 2”。
HFBR-24E4TC资料

Furthermore, Agilent’s application support group is always ready to assist with any design consideration.
Application Literature
Title
HFBR-0400 Series Reliability Data Application Bulletin 78 Application Note 1038 Application Note 1065 Application Note 1073 Application Note 1086 Application Note 1121 Application Note 1122 Application Note 1123 Application Note 1137 Application Note 1383
Description The HFBR-0400 Series of components is designed to provide cost effective, high performance fiber optic communication links for information systems and industrial applications with link distances of up to 2.7 kilometers. With the HFBR-24x6, the 125 MHz analog receiver, data rates of up to 160 megabaud are attainable. Transmitters and receivers are directly compatible with popular “industry-standard” connectors: ST®, SMA, SC and FC. They are completely specified with multiple fiber sizes; including 50/125 µm, 62.5/125 µm, 100/ 140 µm, and 200 µm. The HFBR-14x4 high power transmitter and HFBR-24x6 125 MHz receiver pair up to provide a duplex solution optimized for 100 Base-SX. 100Base-SX is a Fast Ethernet Standard (100 Mbps) at 850 nm on multimode fiber. Complete evaluation kits are available for ST product offerings; including transmitter, receiver, connectored cable, and technical literature. In addition, ST connectored cables are available for evaluation. Applications • 100Base-SX Fast Ethernet on 850 nm • Media/fiber conversion, switches, routers, hubs and NICs on 100Base-SX • Local Area Networks • Computer to Peripheral Links • Computer Monitor Links • Digital Cross Connect Links • Central Office Switch/PBX Links • Video Links • Modems and Multiplexers • Suitable for Tempest Systems • Industrial Control Links
2SD1824资料

KA224A中文资料
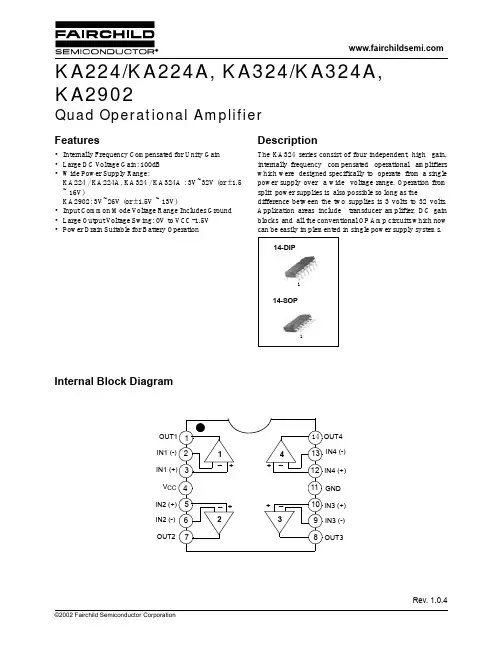
©2002 Fairchild Semiconductor CorporationRev. 1.0.4Features•Internally Frequency Compensated for Unity Gain •Large DC V oltage Gain: 100dB •Wide Power Supply Range:KA224 / KA224A, KA324 / KA324A : 3V~32V (or ±1.5 ~ 16V)KA2902: 3V~26V (or ±1.5V ~ 13V)•Input Common Mode V oltage Range Includes Ground •Large Output V oltage Swing: 0V to V CC -1.5V •Power Drain Suitable for Battery OperationDescriptionThe KA324 series consist of four independent, high gain,internally frequency compensated operational amplifiers which were designed specifically to operate from a single power supply over a wide voltage range. Operation from split power supplies is also possible so long as thedifference between the two supplies is 3 volts to 32 volts.Application areas include transducer amplifier, DC gain blocks and all the conventional OP Amp circuits which now can be easily implemented in single power supply systems.14-SOP14-DIP11Internal Block Diagram12345678910111213141234+_+++___OUT4GNDOUT2OUT1OUT3IN4 (-)IN3 (-)IN4 (+)IN3 (+)IN1 (-)IN1 (+)IN2 (+)IN2 (-)V CC KA224/KA224A, KA324/KA324A, KA2902Quad Operational AmplifierKA224/KA224A, KA324/KA324A, KA29022Schematic Diagram(One Section Only)Absolute Maximum RatingsThermal DataParameterSymbol KA224/KA224A KA324/KA324AKA2902Unit Power Supply Voltage V CC ±16 or 32±16 or 32±13 or 26V Differential Input Voltage V I(DIFF)323226V Input VoltageV I -0.3 to +32-0.3 to +32-0.3 to +26V Output Short Circuit to GND Vcc ≤15V, T A =25°C(One Amp)-Continuous Continuous Continuous -Power Dissipation, T A =25°C 14-DIP 14-SOPP D 131064013106401310640mW Operating Temperature Range T OPR -25 ~ +850 ~ +70-40 ~ +85°C Storage Temperature RangeT STG-65 ~ +150-65 ~ +150-65 ~ +150°CParameterSymbol Value Unit Thermal Resistance Junction-Ambient Max.14-DIP 14-SOPR θja95195°C/WQ8Q7Q6Q5Q4Q3Q2Q1Q9Q10Q11Q12Q14Q15Q16Q18Q19Q20R2Q21C1R1GNDOUTPUTIN(+)IN(-)V CCQ13Q17KA224/KA224A, KA324/KA324A, KA29023Electrical Characteristics(V CC = 5.0V, V EE = GND, T A = 25°C, unless otherwise specified)Note:1. V CC =30V for KA224 / KA224A , KA324 / KA324A , V CC = 26V for KA29022. This parameter, although guaranteed, is not 100% tested in production.Parameter SymbolConditionsKA224KA324KA2902UnitMin.Typ.Max.Min.Typ.Max.Min.Typ.Max.Input Offset Voltage V IO V CM =0V to V CC -1.5V V O(P) = 1.4V, R S = 0Ω(Note1)- 1.5 5.0- 1.57.0- 1.57.0mV Input Offset Current I IO V CM =0V - 2.030- 3.050- 3.050nA Input Bias Current I BIAS V CM =0V -40150-40250-40250nA Input Common Mode Voltage Range V I(R)Note10-V CC -1.50V CC -1.5-0-V CC -1.5V Supply Current I CC R L = ∞,V CC = 30V (KA2902, V CC =26V)- 1.03- 1.03- 1.03mA R L = ∞,V CC = 5V -0.7 1.2-0.7 1.2-0.7 1.2mA Large Signal Voltage Gain G V V CC = 15V, R L =2k ΩV O(P) = 1V to 11V 50100-25100-25100-V/mV Output Voltage SwingV O(H)Note1R L = 2k Ω26--26--22--V R L =10k Ω2728-2728-2324-V V O(L)V CC = 5V, R L =10k Ω-520-520-5100mV Common-ModeRejection Ratio CMRR -7085-6575-5075-dB Power Supply Rejection Ratio PSRR -65100-65100-50100-dB Channel Separation CS f = 1kHz to 20kHz (Note2)-120--120--120-dB Short Circuit to GNDI SCV CC = 15V-4060-4060-4060mA Output CurrentI SOURCE V I(+) = 1V, V I(-) = 0VV CC = 15V, V O(P) =2V2040-2040-2040-mAI SINKV I(+) = 0V, V I(-) = 1V V CC = 15V V O(P) = 2V1013-1013-1013-mAV I(+) = 0V, V I(-) = 1V V CC = 5VV O(R) = 200mV1245-1245----µA Differential Input VoltageV I(DIFF)---V CC--V CC--V CCVKA224/KA224A, KA324/KA324A, KA29024Electrical Characteristics (Continued)(V CC = 5.0V, V EE = GND, unless otherwise specified)The following specification apply over the range of -25°C ≤ T A ≤ +85°C for the KA224; and the 0°C ≤ T A ≤ +70°C for the KA324 ; and the -40°C ≤ T A ≤ +85°C for the KA2902Note:1. V CC =30V for KA224/KA224A , KA324/KA324A , V CC = 26V for KA29022. These parameters, although guaranteed, are not 100% tested in production.Parameter SymbolConditions KA224KA324KA2902UnitMin.Typ.Max.Min.Typ.Max.Min.Typ.Max.Input Offset Voltage V IO V ICM = 0V to V CC -1.5V V O(P) = 1.4V, R S = 0Ω(Note1)--7.0--9.0--10.0mV Input Offset Voltage Drift ∆V IO /∆T R S = 0Ω (Note2)-7.0--7.0--7.0-µV/ °C Input Offset Current I IO V CM = 0V --100--150--200nA Input Offset Current Drift ∆I IO /∆T R S = 0Ω (Note2)-10--10--10-pA/ °C Input Bias Current I BIAS V CM = 0V --300--500--500nA Input Common Mode Voltage Range V I(R)Note10-V CC -2.00-V CC -2.00-V CC -2.0V Large Signal Voltage Gain G V V CC = 15V, R L = 2.0k ΩV O(P) = 1V to 11V 25--15--15--V/mV Output Voltage SwingV O(H)Note1R L = 2k Ω26--26--22--V R L = 10k Ω2728-2728-2324-V V O(L)V CC = 5V, R L = 10k Ω-520-520-5100mV Output CurrentI SOURCEV I(+) = 1V, V I(-) = 0V V CC = 15V, V O(P) = 2V 1020-1020-1020-mA I SINKV I(+) = 0V, V I(-) = 1V V CC = 15V, V O(P) = 2V1013-58-58-mA Differential Input VoltageV I(DIFF)---V CC--V CC--V CCVKA224/KA224A, KA324/KA324A, KA29025Electrical Characteristics (Continued)(V CC = 5.0V, V EE = GND, T A =25°C, unless otherwise specified)Note:1. V CC =30V for KA224 / KA224A , KA324 / KA324A2. This parameter, although guaranteed, is not 100% tested in production.Parameter SymbolConditionsKA224AKA324AUnitMin.Typ.Max.Min.Typ.Max.Input Offset Voltage V IO V CM = 0V to V CC -1.5V V O(P) = 1.4V, R S = 0Ω(Note1)- 1.0 3.0- 1.5 3.0mV Input Offset Current I IO V CM = 0V -215- 3.030nA Input Bias Current I BIAS V CM = 0V -4080-40100nA Input Common-Mode Voltage Range V I(R)Note10-V CC -1.50-V CC -1.5V Supply CurrentI CC V CC = 30V, R L = ∞- 1.53- 1.53mA V CC = 5V, R L = ∞-0.7 1.2-0.7 1.2mA Large Signal Voltage GainG V V CC = 15V, R L = 2k ΩV O(P) = 1V to 11V 50100-25100-V/mV Output Voltage Swing V O(H)Note1R L = 2k Ω26--26--V R L = 10k Ω2728-2728-V V O(L)V CC = 5V, R L = 10k Ω-520-520mV Common-Mode Rejection RatioCMRR -7085-6585-dB Power Supply Rejection RatioPSRR -65100-65100-dB Channel Separation CS f = 1kHz to 20kHz (Note2)-120--120-dB Short Circuit to GNDI SC V CC = 15V-4060-4060mA Output CurrentI SOURCEV I(+) = 1V, V I(-) = 0V V CC = 15V, V O(P) = 2V 2040-2040-mA I SINKV I(+) = 0V, V I(-) = 1V V CC = 15V, V O(P) = 2V 1020-1020-mA V I(+) = 0v, V I(-) = 1VV CC = 5V, V O(P) = 200mV1250-1250-µA Differential Input VoltageV I(DIFF)---V CC--V CCVKA224/KA224A, KA324/KA324A, KA29026Electrical Characteristics (Continued)(V CC = 5.0V, V EE = GND, unless otherwise specified)The following specification apply over the range of -25°C ≤ T A ≤ + 85°C for the KA224A; and the 0°C ≤ T A ≤ +70°C for the KA324ANote:1. V CC =30V for KA224A and KA324A.2. These parameters, although guaranteed, are not 100% tested in production.Parameter Symbol ConditionsKA224AKA324AUnit Min.Typ.Max.Min.Typ.Max.Input Offset Voltage V IO V CM = 0V to V CC -1.5V V O(P) = 1.4V, R S = 0Ω(Note1)-- 4.0-- 5.0mV Input Offset Voltage Drift ∆V IO /∆T R S = 0Ω (Note2)-7.020-7.030µV/°C Input Offset Current I IO V CM = 0V --30--75nA Input Offset Current Drift ∆I IO /∆T R S = 0Ω (Note2)-10200-10300pA/°C Input Bias Current I BIAS V CM = 0V -40100-40200nA Input Common-Mode Voltage RangeV I(R)Note10-V CC -2.00-V CC -2.0V Large Signal Voltage Gain G V V CC = 15V, R L = 2.0k Ω25--15--V/mV Output Voltage SwingV O(H)Note1R L = 2k Ω26--26--V R L = 10k Ω2728-2728-V V O(L)V CC = 5V, R L = 10k Ω-520-520mV Output CurrentI SOURCEV I(+) = 1V, V I(-) = 0V V CC = 15V, V O(P) = 2V 1020-1020-mV I SINKV I(+) = 0V, V I(-) = 1V V CC = 15V, V O(P) = 2V58-58-mA Differential Input VoltageV I(DIFF)---V CC--V CCVKA224/KA224A, KA324/KA324A, KA29027Typical Performance CharacteristicsFigure 1.Input Voltage Range vs Supply VoltageFigure 2.Input Current vs TemperatureFigure 3.Supply Current vs Supply VoltageFigure 4.Voltage Gain vs Supply VoltageFigure 5.Open Loop Frequency Response Figure 6.Common mode Rejection RatioSupply Voltage(v)Temperature T j ( °C)Supply Voltage (V)Supply Voltage (V)Frequency (Hz)Frequency (Hz)KA224/KA224A, KA324/KA324A, KA29028Typical Performance Characteristics (Continued)Figure 7.Voltage Follower Pulse ResponseFigure rge Signal Frequency Response Figure 9.Output Characteristics vs Current SourcingFigure 10.Output Characteristics vs Current Sinking Figure 11.Current Limiting vs TemperatureFigure 8. Voltage Follower Pulse Response(Small Signal)KA224/KA224A, KA324/KA324A, KA2902 Mechanical DimensionsPackageDimensions in millimeters14-DIP9KA224/KA224A, KA324/KA324A, KA2902Mechanical Dimensions (Continued)PackageDimensions in millimeters14-SOP10KA224/KA224A, KA324/KA324A, KA290211Ordering Information Product NumberPackage Operating TemperatureKA32414-DIP 0 ~ +70°C KA324AKA324D14-SOP KA324ADKA22414-DIP -25 ~ +85°C KA224AKA224D14-SOP KA224ADKA290214-DIP -40 ~ +85°C KA2902D 14-SOPKA224/KA224A, KA324/KA324A, KA290211/19/02 0.0m 001Stock#DSxxxxxxxx2002 Fairchild Semiconductor Corporation LIFE SUPPORT POLICYFAIRCHILD’S PRODUCTS ARE NOT AUTHORIZED FOR USE AS CRITICAL COMPONENTS IN LIFE SUPPORT DEVICES OR SYSTEMS WITHOUT THE EXPRESS WRITTEN APPROVAL OF THE PRESIDENT OF FAIRCHILD SEMICONDUCTOR CORPORATION. As used herein:1.Life support devices or systems are devices or systemswhich, (a) are intended for surgical implant into the body,or (b) support or sustain life, and (c) whose failure toperform when properly used in accordance withinstructions for use provided in the labeling, can bereasonably expected to result in a significant injury of theuser.2. A critical component in any component of a life support device or system whose failure to perform can be reasonably expected to cause the failure of the life support device or system, or to affect its safety or DISCLAIMERFAIRCHILD SEMICONDUCTOR RESERVES THE RIGHT TO MAKE CHANGES WITHOUT FURTHER NOTICE TO ANY PRODUCTS HEREIN TO IMPROVE RELIABILITY, FUNCTION OR DESIGN. FAIRCHILD DOES NOT ASSUME ANYLIABILITY ARISING OUT OF THE APPLICATION OR USE OF ANY PRODUCT OR CIRCUIT DESCRIBED HEREIN; NEITHER DOES IT CONVEY ANY LICENSE UNDER ITS PATENT RIGHTS, NOR THE RIGHTS OF OTHERS.。
S82J-6224资料
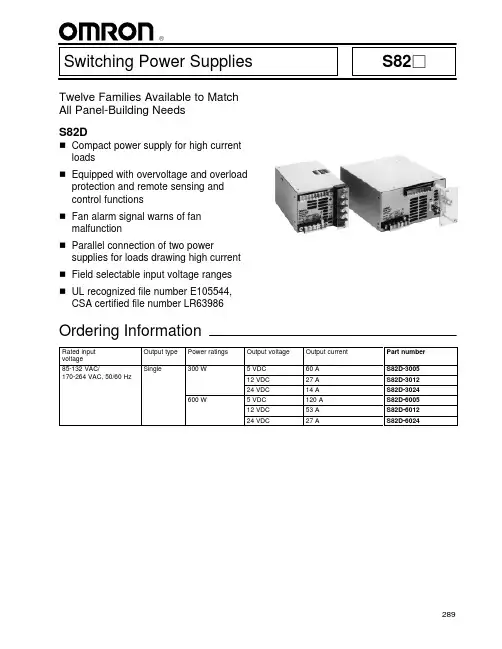
R289Switching Power SuppliesS82jTwelve Families Available to Match All Panel-Building NeedsS82DH Compact power supply for high currentloadsH Equipped with overvoltage and overloadprotection and remote sensing and control functions H Fan alarm signal warns of fan malfunctionH Parallel connection of two powersupplies for loads drawing high currentH Field selectable input voltage rangesH UL recognized file number E105544,CSA certified file number LR63986Ordering Information290S82FH Economical, compact power supply ideal for driving loads such as solenoids and motorsH Equipped with various convenientfunctions such as overvoltage andoverload protection, remote control and remote sensingH Parallel operation possible using two or more power supplies of the same modelH Field selectable input voltage ranges H UL recognized file number E105544,CSA certified file number LR63986Ordering Information291S82GH Change from four power ratings and awide selection of output voltagesH Field selectable input voltage rangesH UL recognized file numbers E105544and E104818, CSA certified file number LR63986H Convenience features includeovervoltage and overload protection,remote control and remote sensingOrdering Information292S82HH Models range from 15 W to 600 W H Power factor correction (PFC) modelsavailableH UL recognized file numbers E105544and E104818, CSA certified file number LR63986Ordering InformationJ POWER SUPPLIES WITHOUT POWER FACTOR CORRECTIONJ POWER SUPPLIES WITH POWER FACTOR CORRECTION293294S82JH Choose open-frame or covered models H Designed for front-mounting, but maybe track-mounted using an adapterHUniversal voltage models available H UL recognized file numbers E105544and E104818, CSA certified filenumbers LR63986 and LR82164 and VDE approvedOrdering InformationJ UNIVERSAL VOLTAGE MODELSJ INDIVIDUAL VOLTAGE MODELS295S82KH Universal voltage range: 100-240 VAC H UL508 listed on all modelsH Class 2 approved on all models below240 W, except dual output types H Undervoltage indicators on all; 100-W type has indicator and output H Finger-safe terminal block with cover according to VDE0106/P100H Power factor correction (PFC) models availableH Approvals: UL recognized file numbersE105544 and E104818, CSA certified file number LR82164, VDE and CEOrdering Information296S82LH Reliable, full-function compact powersupplies offer 7-year warrantyH Equipped with overvoltage and overloadprotection and remote sensing and control functionsH Parallel connection of two 150 W powersupplies lets you handle loads drawing high currentHField selectable input voltage ranges H Approvals: UL recognized file numberE105544, CSA certified file number LR63986Ordering Information297S82RH Economical two-output power suppliesavailable with two different voltageratings in a single unit, or two channels of the same voltage with different output currents H Choose open-frame or covered typemodelsH Designed for surface, bottom and sidemountingH Approvals: UL recognized file numberE105544, CSA certified file number LR82164Ordering InformationJ INDEPENDENT CONTROL TYPE WITH DIFFERENT OUTPUT VOLTAGESJ SECONDARY AUXILIARY CONTROL TYPE, TWO OF THE SAME OUTPUT VOLTAGES298S82SH Miniature DIN –rail mounting powersupplies in 3 W and 7.5 W modelsH Wide input voltage range:10.2 to 27.6 VDC H UL508 approved H DC to DC modelsH Dual voltage types avaialbleHIdeal for applications with limited space HApprovals: UL recognized file number E104818; CSA certified file number LR82164Ordering Information299S8E1H Half the size of Omron ’s other modelsH Choose open-frame or enclosed models H Conforms to 1st group of VCCI for noiseterminal voltage and FCC class AH Approvals: UL recognized file numberE152784, CSA certified file LR82164Ordering InformationS8E3H Three different outputs in one unitH Emission level conforms to FCC class B,VCCI group 2, EN55011 Gr1 class B:EN50081-2H Leakage current of 0.3 mA max.H Open-frame and enclosed typesH Approvals: UL recognized file numberE152784, CSA certified file LR82164Ordering Information300S8PSH Universal input voltage range:100-240 VAC H Power Factor Correction (PFC) on all models H UL508 approval on 100-W and 150-W modelsH Open-frame and enclosed typesHProtection-ON alarm indicators (300-Wand 600-W models)H Approvals: UL recognized file numberE152784, CSA certified file number LR82164, VDE and CEOrdering InformationJ OPEN-FRAME MODELSJ COVERED MODELSJ ENCLOSED MODELSCat. No. GCTC138/00Specifications subject to change without notice.Printed in U.S.A.OMRON ELECTRONICS, INC.One East Commerce Drive Schaumburg, IL 601731-800-55-OMRONOMRON CANADA, INC.885 Milner AvenueScarborough, Ontario M1B 5V8416-286-6465R。
98822中文资料
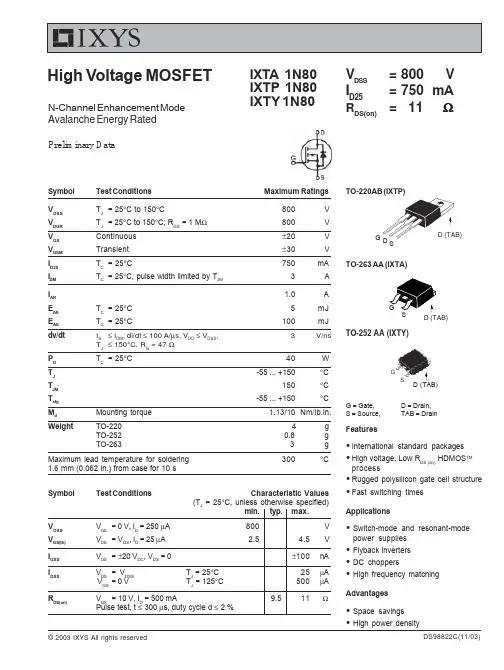
Symbol Test Conditions Maximum RatingsV DSS T J = 25°C to 150°C800V V DGR T J = 25°C to 150°C; R GS = 1 M Ω800V V GS Continuous ±20V V GSM Transient ±30V I D25T C = 25°C750mA I DM T C = 25°C, pulse width limited by T JM3A I AR 1.0A E AR T C = 25°C 5mJ E AS T C = 25°C100mJ dv/dt I S ≤ I DM , di/dt ≤ 100 A/µs, V DD ≤ V DSS ,3V/ns T J ≤ 150°C, R G = 47 ΩP D T C = 25°C40W T J -55 ... +150°C T JM 150°C T stg -55 ... +150°CM d Mounting torque 1.13/10Nm/lb.in.WeightTO-220 4 g TO-252 0.8g TO-263 3gMaximum lead temperature for soldering 300°C1.6 mm (0.062 in.) from case for 10 s High Voltage MOSFETG = Gate, D = Drain,S = Source,TAB = DrainD (TAB)SymbolTest ConditionsCharacteristic Values(T J = 25°C, unless otherwise specified)min.typ.max.V DSS V GS = 0 V, I D = 250 µA 800V V GS(th)V DS = V GS , I D = 25 µA 2.54.5V I GSS V GS = ±20 V DC , V DS = 0±100nA I DSS V DS = V DSS T J = 25°C 25µA V GS = 0 VT J = 125°C500µA R DS(on)V GS = 10 V, I D = 500 mA9.511ΩPulse test, t ≤ 300 µs, duty cycle d ≤ 2 %Features!International standard packages !High voltage, Low R DS (on) HDMOS TMprocess!Rugged polysilicon gate cell structure!Fast switching timesApplications!Switch-mode and resonant-mode power supplies !Flyback inverters!DC choppers!High frequency matchingAdvantages !Space savings !High power densityDS98822C(11/03)TO-220AB (IXTP)© 2003 IXYS All rights reservedGSN-Channel Enhancement Mode Avalanche Energy Rated IXTA 1N80IXTP 1N80IXTY 1N80V DSS =800V I D25=750m A R DS(on)=11ΩPreliminary DataGSIXYS reserves the right to change limits, test conditions, and dimensions.IXYS MOSFETs and IGBTs are covered by one or more of the following U.S. patents:4,835,5924,881,1065,017,5085,049,9615,187,1175,486,7156,306,728B14,850,0724,931,8445,034,7965,063,3075,237,4815,381,025SymbolTest ConditionsCharacteristic Values(T J = 25°C, unless otherwise specified)min.typ.max.g fs V DS = 20 V; I D = 500 mA, pulse test0.70.8S C iss 220pF C oss V GS = 0 V, V DS = 25 V, f = 1 MHz23pF C rss 4pF t d(on)11ns t r V GS = 10 V, V DS = 0.5 • V DSS , I D = 1A 19ns t d(off)R G= 47Ω, (External)40ns t f 28ns Q G(on)8.5nC Q GS V GS = 10 V, V DS = 0.5 • V DSS , I D = 1A2.5nC Q GD 4.5nC R thJC 3.1K/W R thCK(IXTP)0.50K/WSource-Drain Diode Characteristic Values(T J = 25°C, unless otherwise specified)Symbol Test Conditions min.typ.max.I S V GS = 0 V750mA I SM Repetitive; pulse width limited by T JM 3A V SD I F = I S , V GS = 0 V,1.82V Pulse test, t ≤ 300 µs, duty cycle d ≤ 2 %t rrI F = I S , -di/dt = 100 A/µs, V R = 100 V710nsPins: 1 - Gate2 - Drain3 - Source4 - Drain Bottom SideTO-220 AD DimensionsTO-263 AA Outline1.Gate2.Drain3.Source4.DrainBottom Sidelimeter Inches Min.Max.Min.Max.A 4.06 4.83.160.190A1 2.03 2.79.080.110b 0.510.99.020.039b2 1.14 1.40.045.055c 0.460.74.018.029c2 1.14 1.40.045.055D 8.649.65.340.380D17.118.13.280.320E 9.6510.29.380.405E1 6.868.13.270.320e 2.54BSC .100BSC L 14.6115.88.575.625L1 2.29 2.79.090.110L2 1.02 1.40.040.055L3 1.27 1.78.050.070L400.380.015R0.460.74.018.029Dim. MillimeterInches Min.Max.Min.Max.A 2.19 2.380.0860.094A10.89 1.140.0350.045A200.1300.005b 0.640.890.0250.035b10.76 1.140.0300.045b2 5.21 5.460.2050.215c 0.460.580.0180.023c10.460.580.0180.023D 5.97 6.220.2350.245D1 4.32 5.210.1700.205E 6.35 6.730.2500.265E1 4.32 5.210.1700.205e 2.28 BSC 0.090 BSC e1 4.57 BSC 0.180 BSC H 9.4010.420.3700.410L 0.51 1.020.0200.040L10.64 1.020.0250.040L20.89 1.270.0350.050L32.54 2.920.1000.115TO-252 AA Outline。
ERJ-S08F2432V中文资料(panasonic)中文数据手册「EasyDatasheet - 矽搜」
× Resistance Values, or Limiting Element Voltage × Power Rating or max. Overload Voltage listed above
Type
(英制)
ERJS6S (0805) ERJS6Q (0805)
PowerRating电阻
在70℃下 公差
Ambient Temperature (°C)
Type: ERJ S02,S03,S06,S08,S14中 S12中,S1D,S1T(Au类内电极型)
Type: ERJ S6S,S6Q(银钯基内电极型)
Type: ERJ U01, U02, U03, U06, U08, U14, U12,U1D,U1T(银钯基内电极型)
■ 特征
● 高抗硫化通过采用金基内电极来实现(ERJS0 / S1型)
ERJS1T ERJU1T (2512)
额定功率
在70℃下 (W) 0.05 0.1
0.1
0.125
0.25
0.5
0.75
0.75
1.0
限制 因素 电压
(V) 25 50
75
150
200
200
200
200
200
极大 超载 电压
(V) 50 100
150
200
400
400
500
500
500
抵抗性 公差
Example: 222 2.2 k, 1002 10 k
Packaging Methods
Code Packaging C 2 mPrmesspeitdchC,a1r5ri,e0r0T0appcins.g
SI24R2
技术支持:18948743233
www.dn-ic.com
TEL:86-755-82539044
FAX:86-755-82539160
Preliminary
目录
Si24R2
1 简介 .................................................................................................................................................................. 4 2 引脚信息 .......................................................................................................................................................... 5 3 工作模式 .......................................................................................................................................................... 6
Preliminary
Si24R2
超低功耗高性能 2.4GHz GFSK 无线发射芯片
主要特性
工作在 2.4GHz ISM 频段 调制方式:GFSK/FSK 数据速率:2Mbps/1Mbps/250Kbps 超低关断功耗:500nA
快速启动时间: ≤ 130uS 内部集成高 PSRR LDO 宽电源电压范围:1.9-3.6V 宽数字 I/O 电压范围:1.9-5.25V 低成本晶振:16MHz±60ppm 最高发射功率:7dBm 发射电流(2Mbps): 13.5mA(0dBm) 最高 10MHz 四线 SPI 接口 发射数据硬件中断输出 极少外围器件,降低系统应用成本 QFN20 封装或 COB 封装 完全兼容
ACI_224R-2001
ACI 224R-01 supersedes ACI 224R-90 and became effective May 16, 2001.Copyright © 2001, American Concrete Institute.All rights reserved including rights of reproduction and use in any form or by any means, including the making of copies by any photo process, or by electronic or mechanical device, printed, written, or oral, or recording for sound or visual reproduc-tion or for use in any knowledge or retrieval system or device, unless permission in writing is obtained from the copyright proprietors.ACI Committee Reports, Guides, Standard Practices,and Commentaries are intended for guidance in planning,designing, executing, and inspecting construction. This document is intended for the use of individuals who are competent to evaluate the significance and limitations of its content and recommendations and who will accept re-sponsibility for the application of the material it contains.The American Concrete Institute disclaims any and all re-sponsibility for the stated principles. The Institute shall not be liable for any loss or damage arising therefrom.Reference to this document shall not be made in con-tract documents. If items found in this document are de-sired by the Architect/Engineer to be a part of the contract documents, they shall be restated in mandatory language for incorporation by the Architect/Engineer.Control of Cracking in Concrete StructuresACI 224R-01The principal causes of cracking and recommended crack-control proce-dures are presented. The current state of knowledge in microcracking and fracture of concrete is reviewed. The control of cracking due to drying shrinkage and crack control in flexural members, overlays, and mass con-crete construction are covered in detail. Long-term effects on cracking are considered and crack-control procedures used in construction are pre-sented. Information is presented to assist in the development of practical and effective crack-control programs for concrete structures. Extensive ref-erences are provided.Keywords : aggregates; anchorage (structural); bridge decks; cement-aggregate reactions; concrete construction; concrete pavements; concrete slabs; cooling; corrosion; crack propagation; cracking (fracturing); crack width and spacing; drying shrinkage; shrinkage-compensating concrete;heat of hydration; mass concrete; microcracking; polymer-modified concrete;prestressed concrete; reinforced concrete; restraint; shrinkage; temperature;tensile stresses; thermal expansion; volume change.CONTENTSChapter 1—Introduction, p. 224R-2Chapter 2—Crack mechanisms in concrete, p. 224R-22.1—Introduction2.2—Compressive microcracking 2.3—FractureChapter 3—Control of cracking due to drying shrinkage, p. 224R-113.1—Introduction3.2—Cause of cracking due to drying shrinkage 3.3—Drying shrinkage3.4—Factors controlling drying shrinkage of concrete 3.5—Control of shrinkage cracking 3.6—Shrinkage-compensating concreteChapter 4—Control of cracking in flexural members, p. 224R-174.1—Introduction4.2—Crack-control equations for reinforced concrete beams 4.3—Crack control in two-way slabs and plates4.4—Tolerable crack widths versus exposure conditions in reinforced concrete4.5—Flexural cracking in prestressed concrete4.6—Anchorage-zone cracking in prestressed concrete 4.7—Crack control in deep beams 4.8—Tension crackingReported by ACI Committee 224Mohamed Abou-ZeidDavid W. Fowler *Edward G. Nawy *John H. Allen Grant T. Halvorsen Randall W. Poston *James P. Barlow Will Hansen *Royce J. Rhoads Merle E. Brander *M. Nadim Hassoun Andrew Scanlon Kathy Carlson Harvey Haynes *Ernest K. Schrader *David Darwin *Paul Hedli Wimal Suaris *Fouad H. Fouad *Tony C. LiuZenon A. ZielinskiFlorian Barth ChairmanRobert J. Frosch *Secretary*Members of ACI 224 who assisted in revisions to this report.--``````-`-`,,`,,`,`,,`---224R-2ACI COMMITTEE REPORTChapter 5—Long-term effects on cracking,p. 224R-245.1—Introduction5.2—Effects of long-term loading5.3—Environmental effects5.4—Aggregate and other effects5.5—Use of polymers in improving cracking characteristicsChapter 6—Control of cracking in overlays,p. 224R-256.1—Introduction6.2—Fiber-reinforced concrete (FRC) overlays6.3—Latex- and epoxy-modified concrete overlays6.4—Polymer-impregnated concrete (PIC) systems6.5—Epoxy and other polymer concrete overlaysChapter 7—Control of cracking in mass concrete, p. 224R-287.1—Introduction7.2—Methods of crack control7.3—Design7.4—Construction7.5—OperationChapter 8—Control of cracking by proper construction practices, p. 224R-348.1—Introduction8.2—Restraint8.3—Shrinkage8.4—Settlement8.5—Construction8.6—Specifications to minimize drying shrinkage8.7—ConclusionChapter 9—References, p. 224R-399.1—Referenced standards and reports9.2—Cited references9.3—Other referencesCHAPTER 1—INTRODUCTIONCracks in concrete structures can indicate major structural problems and detract from the appearance of monolithic construction. There are many specific causes of cracking. This report presents the principal causes of cracking and a detailed discussion of crack-control procedures. The report consists of eight chapters designed to help the engineer and the contractor in developing crack-control measures.This report is an update of previous committee reports (ACI Committee 224 1972, 1980, 1990). ACI Bibliogra-phy No. 9 supplemented the original ACI 224R (1971). The Committee has also prepared reports on the causes, evaluation, and repair of cracking, ACI 224.1R; cracking of concrete in di-rect tension, ACI 224.2R; and joints in concrete construction, ACI 224.3R.In this revision of the report, Chapter 2 on crack mechanisms has been revised extensively to reflect the interest and attention given to aspects of fracture mechanics of concrete during the 1980s. Chapter 3 on drying shrinkage has been rewritten. Chapter 4 has been revised to include updated information on crack-width predictive equations, cracking in partially prestressed members, anchorage zone cracking, and flexural cracking in deep flexural members. Chapter 6 on concrete overlays has been reorganized and revised in modest detail to account for updated information on fiber reinforcement and on polymer-modified concrete. Chapter 7 on mass concrete has been revised to consider structural consequences more extensively.CHAPTER 2—CRACK MECHANISMS INCONCRETE2.1—IntroductionCracking plays an important role in concrete’s response to load in both tension and compression. The earliest studies of the microscopic behavior of concrete involved the response of concrete to compressive stress. That early work showed that the stress-strain response of concrete is closely associated with the formation of microcracks, that is, cracks that form at coarse-aggregate boundaries (bond cracks) and propagate through the surrounding mortar (mortar cracks) (Hsu, Slate, Sturman, and Winter 1963; Shah and Winter 1966; Slate and Matheus 1967; Shah and Chandra 1970; Shah and Slate 1968; Meyers, Slate, and Winter 1969; Darwin and Slate 1970), as shown in Fig. 2.1.During early microcracking studies, concrete was considered to be made up of two linear, elastic brittle materials; cement paste and aggregate; and microcracks were considered to be the major cause of concrete’s nonlinear stress-strain behavior in compression (Hsu, Slate, Sturman, and Winter 1963; Shah and Winter 1966). This picture began to change in the 1970s. Cement paste is a nonlinear softening material, as is the mortar constituent of concrete. The compressive non-linearity of concrete is highly dependent upon the response of these two materials (Spooner 1972; Spooner and Dougill 1975; Spooner, Pomeroy, and Dougill 1976; Maher and Dar-win 1977; Cook and Chindaprasirt 1980; Maher and Darwin 1982) and less dependent upon bond and mortar microcracking than originally thought. Research indicates, however, that a sig-nificant portion of the nonlinear deformation of cement paste and mortar results from the formation of microcracks that are several orders of magnitude smaller than those observed in the original studies (Attiogbe and Darwin 1987, 1988). These smaller microcracks have a surface density that is two to three orders of magnitude higher than the density of bond and mortar microcracks in concrete at the same compres-sive strain, and their discovery represents a significant step towards understanding the behavior of concrete and its constituent materials in compression.The effect of macroscopic cracks on the performance and failure characteristics of concrete has also received considerable attention. For many years, concrete has been considered a brittle material in tension. Many attempts have been made to use principles of fracture mechanics to model the fracture of concrete containing macroscopic cracks.The field of fracture mechanics was developed by Griffith (1920) to explain the failure of brittle materials. Linear elastic fracture mechanics (LEFM) predicts the rapid propagation of a microcrack through a homogeneous, isotropic, linear-elastic material. The theory uses the stress-intensity factor K that --``````-`-`,,`,,`,`,,`---CONTROL OF CRACKING IN CONCRETE STRUCTURES224R-3represents the stress field ahead of a sharp crack in a struc-tural member which is a function of the crack geometry and stress. K is further designated with subscripts, I, II, and III, depending upon the nature of the deformation at the crack tip. For a crack at which the deformation is perpendicular to the crack plane, K is designated as K I, and failure occurs when K I reaches a critical value K I c, known as the critical stress-intensity factor. K I c is a measure of the fracture tough-ness of the material, which is simply a measure of the resis-tance to crack propagation. Often the region around the crack tip undergoes nonlinear deformation, such as yielding in metals, as the crack grows. This region is referred to as the plastic zone in metals, or more generally as the fracture process zone. To properly measure K I c for a material, the test specimen should be large enough so that the fracture process zone is small compared with the specimen dimensions. For LEFM to be applicable, the value of K I c must be a material property, independent of the specimen geometry (as are other material properties, such as yield strength or compressive strength). Initial attempts to measure K I c in concrete were unsuccessful because K I c depended on the size and geometry of the test specimens (Wittmann 1986). As a result of the heterogeneity inherent in cement paste, mortar, and concrete, these materials exhibit a significant fracture-process zone and the critical load is preceded by a substantial amount of slow crack growth. This precritical crack growth has been studied experimentally by several researchers (John and Shah 1986; Swartz and Go 1984; Bascoul, Kharchi, and Maso 1987; Maji and Shah 1987; Castro-Montero, Shah, and Miller 1990). This research has provided an improved understanding of the fracture process zone and has led to the development of more rational fracture criteria for concrete.This chapter is divided into two sections. The first section on compressive microcracking presents the current knowledge of the response of concrete and its constituent materials under compressive loading and the role played by the various types of microcracks in this process. The second section discusses the applicability of both linear and nonlinear fracture mechanics models to concrete. A more comprehensive treatment of the fracture of concrete can be found in ACI 446.1R.2.2—Compressive microcrackingDuring early microcracking research, a picture devel-oped that closely linked the formation and propagation of microcracks to the load-deformation behavior of concrete. Before loading, volume changes in cement paste cause inter-facial cracks to form at the mortar-coarse aggregate bound-ary (Hsu 1963; Slate and Matheus 1967). Under short-term compressive loads, no additional cracks form until the load reaches about 30% of the compressive strength of the con-crete (Hsu, Slate, Sturman, and Winter 1963). Above this value, additional bond cracks are initiated throughout the matrix. Bond cracking increases until the load reaches about 70% of the compressive strength, at which time the microc-racks begin to propagate through the mortar. Mortar crack-ing continues at an accelerated rate, forming continuous cracks parallel to the direction of compressive load, until the concrete is no longer able to sustain the load. The onset of mortar cracking is related to the sustained, or long-term, compressive strength. Derucher (1978) obtained a somewhat different picture of the microscopic behavior of concrete using the scanning electron microscope (SEM). He subjected dried concrete specimens to eccentric compressive loading within the SEM. He observed that microcracks that existFig. 2.1—Cracking maps and stress-strain curves for concrete loaded in uniaxial compression (Shah and Slate 1968).--``````-`-`,,`,,`,`,,`---224R-4ACI COMMITTEE REPORTbefore loading are in the form of bond cracks, with exten-sions into the surrounding mortar perpendicular to the bond cracks. Under increasing compression, these bond cracks widen but do not propagate at loads as low as 15% of the strength. At about 20% of ultimate, the bond cracks begin to propagate, and at about 30%, they begin to bridge between one another. The bridging is almost complete at 45% of the compressive strength. At 75% of ultimate, mortar cracks start to join one another and continue to do so until failure.In general, microcracking that occurs before loading has little effect on the strength of compressive strength of the concrete.In studies of high-strength concrete, Carrasquillo, Slate,and Nilson (1981) concluded that it was more appropriate to classify cracks as simple (bond or mortar) and combined (bond and mortar) and that the formation of combined cracks consisting of more than one mortar crack signaled unstable crack growth. They observed that the higher the concrete strength, the higher the strain (relative to the strain at peak stress) at which this unstable crack growth is observed.They observed less total cracking in high-strength concrete than normal-strength concrete at all stages of loading.Work by Meyers, Slate, and Winter (1969), Shah and Chandra (1970), and Ngab, Slate, and Nilson (1981) demon-strated that microcracks increase under sustained and cyclic loading. Their work indicated that the total amount of micro-cracking is a function of the total compressive strain in the concrete and is independent of the method in which the strain is applied. Suaris and Fernando (1987) also showed that the failure of concrete under constant amplitude cyclic loading is closely connected with microcrack growth. Sturman, Shah,and Winter (1965) found that the total degree of microcracking is decreased and the total strain capacity in compression is increased when concrete is subjected to a strain gradient.Since the early work established the existence of bond and mortar microcracks, it has been popular to attribute most, if not all, of the nonlinearity of concrete to the formation of these microscopic cracks (Hsu, Slate, Sturman, and Winter 1963; Shah and Winter 1966; Testa and Stubbs 1977; Car-rasquillo, Slate, and Nixon 1981). A cause and effect rela-tionship, however, has never been established (Darwin 1978). Studies by Spooner (1972), Spooner and Dougill (1975), Spooner, Pomeroy, and Dougill (1976), and Maher and Darwin (1982) indicate that the degree of microcracking can be taken as an indication of the level of damage rather than as the controlling factor in the concrete’s behavior.Experimental work by Spooner (1972), Spooner and Dougill (1975), Spooner, Pomeroy, and Dougill (1976), and Martin,Darwin, and Terry (1991) indicates that the nonlinear compres-sive behavior of concrete is strongly influenced by the nonlinear behavior of cement paste. As illustrated in Fig. 2.2, cement paste under compression is not an elastic, brittle material as stated in the past, but a nonlinear material with a relatively high strain capacity. The nonlinear behavior of cement paste can be tied to damage sustained by the paste, even at very low ing a cyclic loading procedure, Spooner (1972), Spoon-er and Dougill (1975), and Spooner, Pomeroy, and Dougill (1976) demonstrated that both paste and concrete undergo mea-surable damage at strains (0.0004) at which an increase in bond and mortar microcracking cannot be detected. The level of damage can be detected at low loads by using an energy method and by a change in the initial modulus of elasticity for each load cycle. The process of damage is continuous up to failure.The physical nature of damage that occurs in cement paste,like that in concrete, appears to be related to cracking. This point was first made by Spooner, Pomeroy, and Dougill (1976) based on volumetric strain measurements and then byFig. 2.2—Stress-strain curves for cement paste, mortar, and concrete; w/c = 0.5 (Martin,Darwin, and Terry 1991).--``````-`-`,,`,,`,`,,`---CONTROL OF CRACKING IN CONCRETE STRUCTURES224R-5Yoshimoto et al. (1972) and Yoshimoto, Ogino, and Kawakami (1976) who reported the formation of “hair-shaped” and “void-shaped” cracks in paste under flexure and compressive loading. The relationship between nonlinear deformation and cracking in cement paste is now firmly es-tablished by the work of Attiogbe and Darwin (1987, 1988). Studies of the stress-strain behavior of concrete under cyclic compressive load (Karsan and Jirsa 1969; Shah and Chandra 1970) indicated the concrete undergoes rapid deterioration once the peak stress exceeds 70% of the short-term compres-sive strength of the concrete. In their study of cyclic creep, Neville and Hirst (1978) found that heat is generated even when specimens are cycled below this level. They attributed the heat to sliding at the interfacial boundary. The work of Neville and Hirst, along with the work of Spooner, suggests that it can be possible that the heat measured is due to some microscopic sliding within the paste.Several studies have attempted to establish the importance of interfacial bond strength on the behavior of concrete in compression. Two studies seemed to indicate a very large effect, thus emphasizing the importance of interfacial strength on concrete behavior in compression (Shah and Chandra 1970; Nepper-Christensen and Nielsen 1969). These studies used relatively thick, soft coatings on coarse aggregate to reduce the bond strength. Because these soft coatings isolated the aggregate from the surrounding mortar, the effect was more like inducing a large number of voids in the concrete matrix.Two other studies (Darwin and Slate 1970; Perry and Gillott 1977) that did not isolate the coarse aggregate from the mortar indicated that interfacial strength plays only a minor role in controlling the compressive stress-strain behavior of concrete. Darwin and Slate (1970) used a thin coating of polystyrene on natural coarse aggregate. They found that a large reduction in interfacial bond strength causes no change in the initial stiffness of concrete under short-term compressive loads and results in about a 10% reduction in the compressive strength, compared with similar concrete made with aggregate with normal interfacial strength (Fig. 2.3). Darwin and Slate also monitored microcracking. In every case, however, the average amount of mortar cracking was slightly greater for specimens made with coated aggregate. This small yet consistent difference may explain the differences in the stress-strain curves. Perry and Gillott (1977) used glass spheres with different degrees of surface roughness as coarse aggregate. Their results also indicate that reducing the inter-facial strength of the aggregate decreases the compressive strength by about 10%.Work by Carino (1977), using polymer-impregnated concrete, corroborated these last two studies. Carino found that polymer impregnation did not increase the inter-facial bond strength but did increase the compressive strength of concrete. He attributed the increase in strength to the polymer’s effect on mortar strength, therefore downgrading the importance of interfacial bond.The importance of mortar in controlling the stress-strain behavior of concrete is illustrated by the finite-element work of Buyukozturk (1970) and Maher and Darwin (1976, 1977). Buyukozturk (1970) used a finite-element representation of a physical model of concrete. The model treated mortar (in compression) and aggregate (in compression and tension) as linear elastic materials while allowing cracks to form in the mortar and at mortar aggregate boundaries. Buyukozturk simulated the overall crack patterns under uniaxial loading. His finite-element model, however, could not duplicate the full nonlinear behavior of the physical model using the for-mation of interfacial bond cracks and mortar cracks as the only nonlinear effects. Maher and Darwin (1976, 1977) have shown that a very close representation of the actual stress-strain behavior can be obtained using a nonlinear representation for the mortar constituent of the physical model.Fig 2.3—Stress-strain curves as influenced by coating aggregates (Darwin and Slate1970).--``````-`-`,,`,,`,`,,`---224R-6ACI COMMITTEE REPORTMaher and Darwin also studied the behavior of the mortar constituent of concrete under monotonic and cyclic com-pression (1982). Degradation in mortar was shown to be a continuous process and a function of both total strain and load history. The study indicated that residual strain as well as the change in the initial modulus of elasticity are good measures of structural change within the material. Accumu-lations of residual strain were obtained for values of maxi-mum strain as low as 0.00027. The work showed that the maximum strain alone does not control the degradation of mortar in compression and that the total strain range (both loading and unloading) adds to the degradation in stiffness and accumulation of residual strain. Their work concludes as was previously observed (Meyers, Slate, and Winter 1969;Shah and Chandra 1970; Ngab, Slate, and Nilson 1981) that bond and mortar microcracking in concrete is a function of the compressive strain in the concrete and is independent of the method in which the strain is applied. Because the maxi-mum strain does not appear to completely control degrada-tion, factors other than bond and mortar cracks can dominate the degradation of concrete during cyclic loading.Martin, Darwin, and Terry (1991) studied the behavior of paste, mortar, and concrete under cyclic and short-term sus-tained compression. They found a great similarity in the be-havior of concrete and its mortar constituent although the bond and mortar microcracking found in concrete were not observed in the mortar specimens. Of the three materials stud-ied, cement paste has the greatest strain capacity and strength,followed by mortar and concrete (Fig. 2.2).To understand the compressive response of the cement paste and mortar constituents of concrete, Attiogbe and Darwin (1987, 1988) used the SEM to study submicro-scopic cracking under uniaxial compression (Fig. 2.4). Ma-terials with water-cement ratios (w/c ) of 0.3, 0.5, and 0.7were subjected to monotonic, cyclic, and short-term sustained loading. Their observations showed that most cracks in cement paste range in width from 0.2 to 0.7 µm (8 to 28 × 10-5in.) and in length from 10 to over 200 µm (4 to over 80 × 10-4 in.).Tests on mortar showed that nonloaded specimens had about 40% of the crack density of the corresponding cement paste specimens. As the applied strain was increased,however, the crack density increased more rapidly in the mortar, eventually surpassing the value obtained in the cement paste. While sand particles can reduce crack density due to volume changes in cement paste, these results indicate that they act as stress raisers when load is applied. This increase in crack density under applied loading may explain the reduction in ultimate strain capacity exhibited in Fig. 2.2(Martin, Darwin, and Terry 1991) for mortar, compared with cement paste at the same w/c .Using analytical procedures, Attiogbe and Darwin (1988)established that a significant portion of the nonlinear strain in cement paste and mortar can be attributed to the microcracks within the cement paste.Overall, the damage to cement paste in compression seems to play a dominant role in controlling the primary stress-strain behavior of concrete under compression. In normal-weight concrete, aggregate particles act as stress risers,increasing the initial stiffness and decreasing the strength of the paste and controlling the compressive strength of the concrete. An understanding of concrete behavior in compres-sion, thus, requires an understanding of both the behavior of ce-ment paste in compression and the interaction of cement paste with aggregate particles.2.3—Fracture2.3.1 Applicability of linear elastic fracture mechanics—The fracture toughness of a brittle material, which is charac-terized by a critical stress-intensity factor K I c can be mea-sured by using a single-edge notched beam subjected to a monotonically increasing load. The load is applied so that a constant rate of crack-mouth-opening displacement (CMOD)is maintained. If the load-CMOD curve is linear, LEFM can be used to calculate K I c based on the measured maximum load and the length of the crack just before failure (ASTM E 399).K I c is used in the design of metal structures to prevent brittle failure where fatigue crack growth is expected to occur. For LEFM to be applicable, however, the value of K I c should be a material property independent of the specimen geometry.When K I c was calculated for concrete, as described previ-ously, significant effects of the size and geometry of the test specimen were observed by many investigators (Kaplan 1961; Naus and Lott 1969; Higgins and Bailey 1976). The data presented in Fig. 2.5 (Higgins and Bailey 1976) shows that K I c increases with the specimen depth. Such results led many to question the applicability of LEFM to concrete.Results obtained from single-edge notched beams were also analyzed by several investigators to determine if concrete dis-plays any notch sensitivity. Notch sensitivity can be expressed as the ratio of net stress at the crack tip to the modulus of rup-ture of an unnotched specimen. Data on the notch sensitivity of hardened cement paste, mortar, and concrete are shown in Fig. 2.6 (Higgins and Bailey 1976; Kesler, Naus, and Lott 1972; Shah and McGarry 1971; Gjørv, Sorenson, and Arneson 1977; Hillemeier and Hilsdorf 1977). The specimens showing no notch sensitivity are likely the result of deficiencies in theFig 2.4—Crack through calcium silicate-hydrate and calcium hydroxide in cement paste (Attiogbe and Darwin 1987).--``````-`-`,,`,,`,`,,`---CONTROL OF CRACKING IN CONCRETE STRUCTURES224R-7test methods, as explained by Gjørv et al. (1977). The results indicate, however, that both mortar and concrete display less notch sensitivity than hardened cement paste. It is widely accepted today that this lower notch sensitivity for the relatively more heterogeneous materials, particularly concrete, is due to the fact that LEFM is inapplicable for laboratory-size specimens of these materials (Gjørv et al. 1977; Wittmann 1986). It is also widely accepted (Linsbauer et al. 1989a, 1989b), however, that LEFM is a valid tool for analyzing large concrete structures, such as dams, where the heteroge-neities and the fracture process zone are small compared with the structure dimensions.2.3.2 Nonlinear fracture models for concrete—The inap-plicability of LEFM to laboratory-size concrete specimens is the result of the heterogeneity inherent in the concrete. This heterogeneity results in a relatively large fracture process zone that results in a substantial amount of crack growth (crack extension) preceding the critical (maximum) load andFig. 2.5—Size effect on stress-intensity factor (based on data from Higgins and Bailey 1976). Fig. 2.6—Effect of relative notch depth on notch sensitivity (based on data from Higgins and Bailey 1976; Kesler, Naus, and Lott 1972; Shah and McGarry 1971; Gjørv, Soren-son, and Arneson 1977; Hillemeier and Hilsdorf 1977).--``````-`-`,,`,,`,`,,`---。
SGSF464中文资料
MIN. 5.35 3.3 2.9 1.88 0.75 1.05 10.8 15.8 20.8 19.1 22.8 40.5 4.85 20.25 3.5 2.1
mm TYP.
4.6
MAX. 5.65 3.8 3.1 2.08
1 1.25 11.2 16.2 21.2 19.9 23.6 42.5 5.25 20.75 3.7 2.3
4/7
元器件交易网
DIM.
A C D E F G H L2 L3 L5 L6 R Ø
SGSF464/SGSIF464
TO-218 (SOT-93) MECHANICAL DATA
MIN. 4.7 1.17
0.5 1.1 10.8 14.7 –
3.95
– 4
mm TYP. 2.5
VBE = 7 V IC = 100 mA
VCE(sat)∗ Collect or-Emitter Saturation Voltage
IC = 6 A
IB = 1.2 A
IC = 3.5 A IB = 0.5 A
VBE(s at)∗ Base-Emitt er Saturation Voltage
© 1996 SGS-THOMSON Microelectronics - Printed in Italy - All Rights Reserved
SGS-THOMSON Microelectronics GROUP OF COMPANIES Australia - Brazil - Canada - China - France - Germany - Hong Kong - Italy - Japan - Korea - Malaysia - Malta - Morocco - The Netherlands -