经济学原理 曼昆课后答案 chapter 4
曼昆《宏观经济学》(第6、7版)习题精编详解(第4章 货币与通货膨胀)
第4章货币与通货膨胀跨考网独家整理最全经济学考研真题,经济学考研课后习题解析资料库,您可以在这里查阅历年经济学考研真题,经济学考研课后习题,经济学考研参考书等内容,更有跨考考研历年辅导的经济学学哥学姐的经济学考研经验,从前辈中获得的经验对初学者来说是宝贵的财富,这或许能帮你少走弯路,躲开一些陷阱。
以下内容为跨考网独家整理,如您还需更多考研资料,可选择经济学一对一在线咨询进行咨询。
一、判断题1.由实际可变因素带来的货币变化的不相关性被称为货币中性,大多数经济学家认同货币中性的观点,将其作为一种对长期而不是短期的经济的好的描述。
()【答案】T【解析】货币中性是指货币对实际变量的无关性。
大多数经济学家都认同,在长期内,货币是中性的。
2.古典理论使我们可以不用涉及货币供给而研究实际变量的决定。
()【答案】T【解析】古典二分法的产生是因为在古典经济理论中,货币供给的变动不影响实际变量,货币是中性的,因此可以不用涉及货币供给而研究实际变量的决定。
3.货币可以将现在的购买力变成未来的购买力,这是货币交换媒介职能的表现。
()【答案】F【解析】货币可以将现在的购买力变成未来的购买力,这是货币作为价值储藏手段的表现。
4.未预期到的通货膨胀如果高于预期的通货膨胀,那么债权人会受益而债务人受损。
()【答案】F【解析】本题所述条件相当于未预期到的通货膨胀高于实际的通货膨胀,则债权人受损而债务人收益,因为偿还的价值比双方预期的低,也就是比实际应该支付的低。
5.如果通货膨胀被完全的预期到了,那么通货膨胀将是没有成本的。
()【答案】F【解析】预期的通货膨胀的成本包括:①由通货膨胀税产生的人们持有的货币量的扭曲;②因高通货膨胀引起企业更经常地改变它们的价格,从而产生菜单成本;③面临菜单成本的企业不会频繁改变价格,导致资源配置上的无效率;④税法的许多条款并没有考虑通货膨胀的效应;⑤通货膨胀给人们的生活带来不方便。
6.当期物价水平不仅受当期货币供给量的影响,而且还与未来货币供给量预期相关。
曼昆经济学原理第四版课后习题中文答案_百度文库
产大量物品与劳务,才能使本国居民享有在国际贸易环境下的高生活水平。
2.假定社会决定减少消费并增加投资。
A.这种变化会如何影响经济增长?答:当社会决定减少消费并增加投资时,会使社会的储蓄增加,更多的资源用于生产资本品,结果,资本存量增加,引起生产率提高和 GDP 增长得更为迅速。
B.哪些社会群体会从这种变化中获益?哪些集团会受到损害?答:拥有资本品的人会从这种变化中获益,如拥有较多的物质资本和人力资本的人。
而那些依靠政府援助的人将从这种变化中受损,因为社会减少了现期物品与劳务的消费。
3.社会选择把多少资源用于消费和把多少资源用于投资。
这些决策中的一部分涉及私人支出;另一些涉及政府支出。
A.说明代表消费的一些私人支出形式,以及代表投资的一些私人支出形式。
国民收入账户把学费作为消费支出的一部分。
按你的看法,把资源用于教育是一种消费的形式,还是一种投资的形式。
答:如家庭购买食物和服装是消费的私人支出形式,而个人购买新住房、企业对厂房和设备的投资是代表投资的私人支出形式。
资源用于教育即可以看作是一种消费的形式,也可以看作是一种投资的形式。
B.说明代表消费的一些政府支出形式,以及代表投资的一些政府支出形式。
按你的看法,我们应该把政府用于医疗计划的支出作为一种消费的形式,还是投资的形式?你能区分青年人的医疗计划和老年人的医疗计划吗?答:社会保险、国防和退伍军人津贴等是代表消费的一些政府支出形式,政府修筑铁路、核电站是代表投资的一些政府支出形式。
政府用于医疗计划的支出是一种对人力资本的投资。
与老年人的医疗计划相比,青年人的医疗计划更接近对人力资本的投资。
4.投资于资本的机会成本是什么?你认为一国有可能对资本“过度投资”吗?人力资本投资的机会成本是什么?你认为一国可能对人力资本“过度投资”吗?解释之。
答:投资于资本的机会成本是牺牲现期的物品和劳务的消费。
一国有可能对资本“过度投资”。
人力资本投资也有机会成本。
当学生上学时.他们放弃了他们本可以赚到的收入。
曼昆经济学原理课后习题答案
曼昆经济学原理课后习题答案曼昆经济学原理课后习题答案经济学原理是一门研究人类经济行为的学科,它帮助我们理解和解释为什么人们做出特定的经济决策以及这些决策如何影响市场和整个经济体。
曼昆的经济学原理是经济学领域中的经典教材,它以其简明扼要的风格和实用的例子而闻名。
在学习这门课程时,我们经常会遇到一些习题,下面我将为大家提供一些曼昆经济学原理课后习题的答案。
1. 为什么经济学家关注稀缺性?经济学家关注稀缺性是因为资源有限而需求无限。
稀缺性意味着我们无法满足所有人的需求和欲望。
因此,经济学家研究如何有效地分配有限的资源,以满足人们的需求。
2. 什么是机会成本?机会成本是指做出某种选择所放弃的最高价值的替代选择。
当我们做出决策时,我们必须考虑放弃其他可能的选择所带来的损失。
例如,如果你决定去看电影而不是去上课,那么你放弃了上课所能获得的知识和学习机会。
3. 供求曲线是如何决定市场价格的?供求曲线是描述市场上商品供给和需求关系的工具。
供给曲线表示厂商愿意以不同价格提供的商品数量,需求曲线表示消费者愿意以不同价格购买的商品数量。
市场价格由供求曲线的交点决定,当供给和需求相等时,市场达到均衡,价格也就确定下来。
4. 为什么需求曲线向下倾斜?需求曲线向下倾斜是因为当价格降低时,消费者愿意购买更多的商品。
这是由于价格下降会增加消费者的购买力,使得他们能够购买更多的商品。
因此,需求曲线呈现出向下倾斜的趋势。
5. 为什么供给曲线向上倾斜?供给曲线向上倾斜是因为当价格上升时,厂商愿意提供更多的商品。
这是由于价格上升会增加厂商的利润,激励他们增加生产。
因此,供给曲线呈现出向上倾斜的趋势。
6. 什么是弹性需求和非弹性需求?弹性需求指的是当价格变动时,需求的变动程度。
如果需求对价格变动非常敏感,那么需求被认为是弹性的。
非弹性需求则指的是需求对价格变动不敏感的情况。
例如,基本生活必需品的需求通常是非弹性的,而奢侈品的需求通常是弹性的。
经济学原理曼昆课后答案chapter4

经济学原理曼昆课后答案c h a p t e r4本页仅作为文档封面,使用时可以删除This document is for reference only-rar21year.MarchProblems and Applications1. a. Cold weather damages the orange crop, reducing the supply of oranges.This can be seen in Figure 4-6 as a shift to the left in the supply curve fororanges. The new equilibrium price is higher than the old equilibriumprice.Figure 4-6b. People often travel to the Caribbean from New England to escape coldweather, so demand for Caribbean hotel rooms is high in the winter. Inthe summer, fewer people travel to the Caribbean, since northern climesare more pleasant. The result, as shown in Figure 4-7, is a shift to the leftin the demand curve. The equilibrium price of Caribbean hotel rooms isthus lower in the summer than in the winter, as the figure shows.Figure 4-7c. When a war breaks out in the Middle East, many markets are affected.Since much oil production takes place there, the war disrupts oil supplies, shifting the supply curve for gasoline to the left, as shown in Figure 4-8.The result is a rise in the equilibrium price of gasoline. With a higherprice for gasoline, the cost of operating a gas-guzzling automobile, like aCadillac, will increase. As a result, the demand for used Cadillacs willdecline, as people in the market for cars won't find Cadillacs as attractive.In addition, some people who already own Cadillacs will try to sell them.The result is that the demand curve for used Cadillacs shifts to the left,while the supply curve shifts to the right, as shown in Figure 4-9. Theresult is a decline in the equilibrium price of used Cadillacs.Figure 4-8Figure 4-92. The statement that "an increase in the demand for notebooks raises the quantityof notebooks demanded, but not the quantity supplied" is false, in general. AsFigure 4-10 shows, the increase in demand for notebooks results in an increased quantity supplied. The only way the statement would be true is if the supplycurve were perfectly inelastic, as shown in Figure 4-11.Figure 4-10Figure 4-113. a. If people decide to have more children (a change in tastes), they'll wantlarger vehicles for hauling their kids around, so the demand for minivanswill increase. Supply won't be affected. The result is a rise in both priceand quantity, as Figure 4-12 shows.Figure 4-12Figure 4-13b. If a strike by steelworkers raises steel prices, the costs of producing aminivan rise (a rise in input prices), so the supply of minivans decreases.Demand won't be affected. The result is a rise in the price of minivansand a decline in the quantity, as Figure 4-13 shows.c. The development of new automated machinery for the production ofminivans is an improvement in technology. The reduction in firms' costsresults in an increase in supply. Demand isn't affected. The result is a decline in the price of minivans and an increase in the quantity, as Figure 4-14shows.Figure 4-14Figure 4-15d. The rise in the price of station wagons affects minivan demand becausestation wagons are substitutes for minivans (that is, there's a rise in theprice of a related good). The result is an increase in demand for minivans.Supply isn't affected. In equilibrium, the price and quantity of minivansboth rise, as Figure 4-12 shows.e. The reduction in peoples' wealth caused by a stock-market crash reducestheir income, leading to a reduction in the demand for minivans, sinceminivans are a normal good. Supply isn’t affected. As a result, both priceand quantity decline, as Figure 4-15 shows.4. Technological advances that reduce the cost of producing computer chipsrepresent a decline in an input price for producing a computer. The result is ashift to the right in the supply of computers, as shown in Figure 4-16. Theequilibrium price falls and the equilibrium quantity rises, as the figure shows.Figure 4-16Figure 4-17Since computer software is a complement to computers, the increasedequilibriumquantity of computers increases the demand for software. As Figure 4-17 shows, the result is a rise in both the equilibrium price and quantity of software.Since typewriters are substitutes for computers, the increased equilibriumquantity of computers reduces the demand for typewriters. As Figure 4-18shows, the result is a decline in both the equilibrium price and quantity oftypewriters.Figure 4-185. a. When a hurricane in South Carolina damages the cotton crop, it raisesinput prices for producing sweatshirts. As a result, the supply ofsweatshirts shifts to the left, as shown in Figure 4-19. The newequilibrium has a higher price and lower quantity of sweatshirts.b. A decline in the price of leather jackets leads more people to buy leatherjackets, reducing the demand for sweatshirts. The result, shown in Figure 4-20, is a decline in both the equilibrium price and quantity of sweatshirts.Figure 4-20c. The effects of colleges requiring students to engage in morningcalisthenics in appropriate attire raises the demand for sweatshirts, asshown in Figure 4-21. The result is an increase in both the equilibriumprice and quantity of sweatshirts.d. The invention of new knitting machines increases the supply ofsweatshirts. As Figure 4-22 shows, the result is a reduction in theequilibrium price and an increase in the equilibrium quantity ofsweatshirts.Figure 4-226. A temporarily high birth rate in the year 2005 leads to opposite effects on theprice of babysitting services in the years 2010 and 2020. In the year 2010, there are more 5-year olds who need sitters, so the demand for babysitting servicesrises, as shown in Figure 4-23. The result is a higher price for babysitting services in 2010. However, in the year 2020, the increased number of 15-year olds shifts the supply of babysitting services to the right, as shown in Figure 4-24. Theresult is a decline in the price of babysitting services.Figure 4-23Figure 4-247. Since ketchup is a complement for hot dogs, when the price of hot dogs rises,the quantity demanded of hot dogs falls, thus reducing the demand for ketchup, causing both price and quantity of ketchup to fall. Since the quantity of ketchup falls, the demand for tomatoes by ketchup producers falls, so both price andquantity of tomatoes fall. When the price of tomatoes falls, producers of tomato juice face lower input prices, so the supply curve for tomato juice shifts down,causing the price of tomato juice to fall and the quantity of tomato juice to rise.The fall in the price of tomato juice causes people to substitute tomato juice for orange juice, so the demand for orange juice declines, causing the price andquantity of orange juice to fall. Now you can see clearly why a rise in the price ofhot dogs leads to a fall in price of orange juice!Figure 4-258. a. Cigars and chewing tobacco are substitutes for cigarettes, since a higherprice for cigarettes would increase demand for cigars and chewingtobacco.b. An increase in the tax on cigarettes leads to increased demand for cigarsand chewing tobacco. The result, as shown in Figure 4-25 for cigars, is arise in both the equilibrium price and quantity of cigars and chewingtobacco.c. The results in part (b) showed that a tax on cigarettes leads people tosubstitute cigars and chewing tobacco for cigarettes when the tax oncigarettes rises. To reduce total tobacco usage, policymakers might alsowant to increase the tax on cigars and chewing tobacco, or pursue sometype of public education program.9. Quantity supplied equals quantity demanded at a price of $6 and quantity of 81pizzas (Figure 4-26). If price were greater than $6, quantity supplied wouldexceed quantity demanded, so suppliers would reduce their price to gain sales.If price were less than $6, quantity demanded would exceed quantity supplied, so suppliers could raise their price without losing sales. In both cases, the price would continue to adjust until it reached $6, the only price at which there'sneither surplus nor shortage.Figure 4-2610. a. If the price of flour falls, since flour is an ingredient in bagels, the supplycurve for bagels would shift to the right. The result, shown in Figure 4-27,would be a fall in the price of bagels and a rise in the equilibrium quantityof bagels.Since cream cheese is a complement to bagels, the rise in quantitydemanded of bagels increases the demand for cream cheese, as shown inFigure 4-28. The result is a rise in both the equilibrium price and quantityof cream cheese. So, a fall in the price of flour indeed raises both theequilibrium price of cream cheese and the equilibrium quantity of bagels.Figure 4-27Figure 4-28What happens if the price of milk falls Since milk is an ingredient in cream cheese, the fall in the price of milk leads to an increase in the supply of cream cheese. This leads to a decrease in the price of cream cheese (Figure 4-29), rather than a rise in the price of cream cheese. So a fall in the price of milk couldn't have been responsible for the pattern observed.Figure 4-29Figure 4-30b. In part (a), we found that a fall in the price of flour led to a rise in theprice of cream cheese and a rise in the equilibrium quantity of bagels. Ifthe price of flour rose, the opposite would be true; it would lead to a fallin the price of cream cheese and a fall in the equilibrium quantity ofbagels. Since the question says the equilibrium price of cream cheese has risen, it couldn't have been caused by a rise in the price of flour.What happens if the price of milk rises From part (a), we found that a fallin the price of milk caused a decline in the price of cream cheese, so arise in the price of milk would cause a rise in the price of cream cheese.Since bagels and cream cheese are complements, the rise in the price ofcream cheese would reduce the demand for bagels, as Figure 4-30 shows.The result is a decline in the equilibrium quantity of bagels. So a rise inthe price of milk does cause both a rise in the price of cream cheese anda decline in the equilibrium quantity of bagels.11. a. As Figure 4-31 shows, the supply curve is vertical. The constant supplymakes sense because the basketball arena has a fixed number of seats nomatter what the price.Figure 4-31b. Quantity supplied equals quantity demanded at a price of $8. Theequilibrium quantity is 8,000 tickets.c.Price Quantity Demanded Quantity Supplied$ 4 14,0008,0008 11,0008,000128,0008,000165,0008,000202,0008,000The new equilibrium price will be $12, which equates quantity demandedto quantity supplied. The equilibrium quantity is 8,000 tickets.12. The executives are confusing changes in demand with changes in quantitydemanded. Figure 4-32 shows the demand curve prior to the marketing campaign (D1), and after the campaign (D2). The marketing campaign increased the demand for champagne, as shown, leading to a higher equilibrium price and quantity. Theinfluence of the higher price on demand is already reflected in the outcome. It's impossible for the scenario outlined by the executives to occur.Figure 4-32。
曼昆微观经济学课后练习英文答案完整版

曼昆微观经济学课后练习英文答案集团标准化办公室:[VV986T-J682P28-JP266L8-68PNN]the link between buyers’ willingness to pay for a good and the demandcurve.how to define and measure consumer surplus.the link between sellers’ costs of producing a good and the supply curve.how to define and measure producer surplus.that the equilibrium of supply and demand maximizes total surplus in amarket.CONTEXT AND PURPOSE:Chapter 7 is the first chapter in a three-chapter sequence on welfare economics and market efficiency. Chapter 7 employs the supply and demand model to develop consumer surplus and producer surplus as a measure of welfare and market efficiency. These concepts are then utilized in Chapters 8 and 9 to determine the winners and losers from taxation and restrictions on international trade.The purpose of Chapter 7 is to develop welfare economics—the study of how the allocation of resources affects economic well-being. Chapters 4 through 6 employed supply and demand in a positive framework, which focused on the question, “What is the equilibrium price and quantity in a market” This chapter now addresses the normative question, “Is the equilibrium price and quantity in a market the best possible solution to the resource allocation problem, or is it simply the price and quantity that balance supply and demand” Students will discover that under most circumstances the equilibrium price and quantity is also the one that maximizes welfare.KEY POINTS:Consumer surplus equals buyers’ willingness to pay for a good minus the amount they actually pay for it, and it measures the benefit buyers get from participating in a market. Consumer surplus can be computed by finding the area below the demand curve and above the price.Producer surplus equals the amount sellers receive for their goods minus their costs of production, and it measures the benefit sellers get from participating in a market. Producer surplus can be computed by finding the area below the price and above the supply curve.An allocation of resources that maximizes the sum of consumer and producer surplus is said to be efficient. Policymakers are often concerned with the efficiency, as well as the equality, of economic outcomes.The equilibrium of supply and demand maximizes the sum of consumer andproducer surplus. That is, the invisible hand of the marketplace leadsbuyers and sellers to allocate resources efficiently.Markets do not allocate resources efficiently in the presence of market failures such as market power or externalities.CHAPTER OUTLINE:I. Definition of welfare economics: the study of how the allocation of resources affects economic well-being.A. Willingness to Pay1. Definition of willingness to pay: the maximum amount that a buyer will pay for a good.2. Example: You are auctioning a mint-condition recording of Elvis Presley’s first album. Four buyers show up. Their willingness to pay is as follows:If the bidding goes to slightly higher than $80, all buyersdrop out except for John. Because John is willing to paymore than he has to for the album, he derives some benefitfrom participating in the market.3. Definition of consumer surplus: the amount a buyer is willing to payfor a good minus the amount the buyer actually pays for it.4. Note that if you had more than one copy of the album, the price in the auction would end up being lower (a little over $70 in the case of two albums) and both John and Paul would gain consumer surplus.B. Using the Demand Curve to Measure Consumer Surplus1. We can use the information on willingness to pay to derive a demandmarginal buyer . Because the demand curve shows the buyers’ willingness to pay, we can use the demand curve to measure c onsumer surplus.C. How a Lower Price Raises Consumer Surplussurplus because they are paying less for the product than before (area A on the graph).b. Because the price is now lower, some new buyers will enter the market and receive consumer surplus on these additional units of output purchased (area B on the graph).D. What Does Consumer Surplus Measure?1. Remember that consumer surplus is the difference between the amount that buyers are willing to pay for a good and the price that they actually pay.2. Thus, it measures the benefit that consumers receive from the good as the buyers themselves perceive it.III. Producer SurplusA. Cost and the Willingness to Sell1. Definition of cost: the value of everything a seller must give up to produce a good .2. Example: You want to hire someone to paint your house. You accept bidsfor the work from four sellers. Each painter is willing to work if the priceyou will pay exceeds her opportunity cost. (Note that this opportunity costthus represents willingness to sell.) The costs are:sellers will drop out except for Grandma. Because Grandma receives more than she would require to paint the house, she derives some benefit from producing in the market.4. Definition of producer surplus: the amount a seller is paid for a good minus the seller’s cost of providing it.5. Note that if you had more than one house to paint, the price in the auction would end up being higher (a little under $800 in the case of two houses) and both Grandma and Georgia would gain producer surplus.ALTERNATIVE CLASSROOM EXAMPLE:Review the material on price ceilings from Chapter 6. Redraw themarket for two-bedroom apartments in your town. Draw in a priceceiling below the equilibrium price.Then go through:consumer surplus before the price ceiling is put into place. consumer surplus after the price ceiling is put into place. You will need to take some time to explain the relationship between the producers’ willingness to sell and the cost of producing the good. The relationship between cost and the supply curve is not as apparent as the relationship between the It is important to stress that consumer surplus is measured inmonetary terms. Consumer surplus gives us a way to place amonetary cost on inefficient market outcomes (due to governmentB. Using the Supply Curve to Measure Producer Surplus1. We can use the information on cost (willingness to sell) to derive a2.the cost of the marginal seller. Because the supply curve shows the sellers’ cost (willingness to sell), we can use the supply curve to measure producer surplus.C. How a Higher Price Raises Producer Surplussurplus because they are receiving more for the product than before (area C on the graph).b. Because the price is now higher, some new sellers will enter the market and receive producer surplus on these additional units of output sold (area D on the graph).D. Producer surplus is used to measure the economic well-being of producers,ALTERNATIVE CLASSROOM EXAMPLE:Review the material on price floors from Chapter 6. Redraw the marketfor an agricultural product such as corn. Draw in a price supportabove the equilibrium price.Then go through:producer surplus before the price support is put in place.producer surplus after the price support is put in place.Make sure that you discuss the cost of the price support tomuch like consumer surplus is used to measure the economic well-being of consumers.IV. Market EfficiencyA. The Benevolent Social Planner1. The economic well-being of everyone in society can be measured by total surplus, which is the sum of consumer surplus and producer surplus:Total Surplus = Consumer Surplus + Producer SurplusTotal Surplus = (Value to Buyers – Amount Paid byBuyers) +(Amount Received by Sellers – Cost to Sellers)Because the Amount Paid by Buyers = Amount Received bySellers:2. Definition of efficiency: the property of a resource allocation of maximizing the total surplus received by all members of society .3. Definition of equality: the property of distributing economicprosperity uniformly the members of society .a. Buyers who value the product more than the equilibrium price will purchase the product; those who do not, will not purchase the product. Inother words, the free market allocates the supply of a good to the buyers who value it most highly, as measured by their willingness to pay.b. Sellers whose costs are lower than the equilibrium price will produce the product; those whose costs are higher, will not produce the product. Inother words, the free market allocates the demand for goods to the sellers who can produce it at the lowest cost.value of the product to the marginal buyer is greater than the cost to the marginal seller so total surplus would rise if output increases.Pretty Woman, Chapter 6. Vivien (Julia Roberts) and Edward(Richard Gere) negotiate a price. Afterward, Vivien reveals shewould have accepted a lower price, while Edward admits he wouldhave paid more. If you have done a good job of introducingconsumer and producer surplus, you will see the light bulbs gob. At any quantity of output greater than the equilibrium quantity, the value of the product to the marginal buyer is less than the cost to the marginal seller so total surplus would rise if output decreases.3. Note that this is one of the reasons that economists believe Principle #6: Markets are usually a good way to organize economic activity.C. In the News: Ticket Scalping1. Ticket scalping is an example of how markets work to achieve anefficient outcome.2. This article from The Boston Globe describes economist Chip Case’sexperience with ticket scalping.D. Case Study: Should There Be a Market in Organs?1. As a matter of public policy, people are not allowed to sell their organs.a. In essence, this means that there is a price ceiling on organs of $0.b. This has led to a shortage of organs.2. The creation of a market for organs would lead to a more efficientallocation of resources, but critics worry about the equity of a market system for organs.V. Market Efficiency and Market FailureA. To conclude that markets are efficient, we made several assumptions about how markets worked.1. Perfectly competitive markets.2. No externalities.B. When these assumptions do not hold, the market equilibrium may not be efficient.C. When markets fail, public policy can potentially remedy the situation. SOLUTIONS TO TEXT PROBLEMS:Quick Quizzes1. Figure 1 shows the demand curve for turkey. The price of turkey is P 1and the consumer surplus that results from that price is denoted CS. Consumer surplus is the amount a buyer is willing to pay for a good minus the amount the buyer actually pays for it. It measures the benefit to buyers ofparticipating in a market.Figure 1 Figure 22. Figure 2 shows the supply curve for turkey. The price of turkey is P 1and the producer surplus that results from that price is denoted PS. Producer surplus is the amount sellers are paid for a good minus the sellers’ cost of providing it (measured by the supply curve). It measures the benefit to sellers of participating in a market.It would be a good idea to remind students that there are circumstances when the market process does not lead to the most efficient outcome. Examples include situations such as when a firm (or buyer) has market power over price or when there areFigure 33. Figure 3 shows the supply and demand for turkey. The price of turkey is P, consumer surplus is CS, and producer surplus is PS. Producing more turkeys 1than the equilibrium quantity would lower total surplus because the value to the marginal buyer would be lower than the cost to the marginal seller on those additional units.Questions for Review1. The price a buyer is willing to pay, consumer surplus, and the demand curve are all closely related. The height of the demand curve represents the willingness to pay of the buyers. Consumer surplus is the area below the demand curve and above the price, which equals the price that each buyer is willing to pay minus the price actually paid.2. Sellers' costs, producer surplus, and the supply curve are all closely related. The height of the supply curve represents the costs of the sellers. Producer surplus is the area below the price and above the supply curve, which equals the price received minus each seller's costs of producing the good.Figure 43. Figure 4 shows producer and consumer surplus in a supply-and-demand diagram.4. An allocation of resources is efficient if it maximizes total surplus, the sum of consumer surplus and producer surplus. But efficiency may not be the only goal of economic policymakers; they may also be concerned about equitythe fairness of the distribution of well-being.5. The invisible hand of the marketplace guides the self-interest of buyers and sellers into promoting general economic well-being. Despite decentralized decision making and self-interested decision makers, free markets often lead to an efficient outcome.6. Two types of market failure are market power and externalities. Market power may cause market outcomes to be inefficient because firms may cause price and quantity to differ from the levels they would be under perfect competition, which keeps total surplus from being maximized. Externalities are side effects that are not taken into account by buyers and sellers. As a result, the free market does not maximize total surplus.Problems and Applications1. a. Consumer surplus is equal to willingness to pay minus the price paid. Therefore, Melissa’s willingness to pay must be $200 ($120 + $80).b. Her consumer surplus at a price of $90 would be $200 $90 = $110.c. If the price of an iPod was $250, Melissa would not have purchased one because the price is greater than her willingness to pay. Therefore, she would receive no consumer surplus.2. If an early freeze in California sours the lemon crop, the supply curve for lemons shifts to the left, as shown in Figure 5. The result is a rise in the price of lemons and a decline in consumer surplus from A + B + C to just A. So consumer surplus declines by the amount B + C.Figure 5 Figure 6In the market for lemonade, the higher cost of lemons reduces the supply of lemonade, as shown in Figure 6. The result is a rise in the price of lemonade and a decline in consumer surplus from D + E + F to just D, a loss of E + F. Note that an event that affects consumer surplus in one market oftenhas effects on consumer surplus in other markets.3. A rise in the demand for French bread leads to an increase in producer surplus in the market for French bread, as shown in Figure 7. The shift of the demand curve leads to an increased price, which increases producer surplusfrom area A to area A + B + C.Figure 7The increased quantity of French bread being sold increases the demandfor flour, as shown in Figure 8. As a result, the price of flour rises, increasing producer surplus from area D to D + E + F. Note that an event that affects producer surplus in one market leads to effects on producer surplus in related markets.Figure 84. a.Figure 9b. When the price of a bottle of water is $4, Bert buys two bottles of water. His consumer surplus is shown as area A in the figure. He values hisfirst bottle of water at $7, but pays only $4 for it, so has consumer surplus of $3. He values his second bottle of water at $5, but pays only $4 for it, so has consumer surplus of $1. Thus Bert’s total consumer surplus is $3 + $1 = $4, which is the area of A in the figure.c. When the price of a bottle of water falls from $4 to $2, Bert buys three bottles of water, an increase of one. His consumer surplus consists of both areas A and B in the figure, an increase in the amount of area B. He gets consumer surplus of $5 from the first bottle ($7 value minus $2 price), $3from the second bottle ($5 value minus $2 price), and $1 from the third bottle ($3 value minus $2 price), for a total consumer surplus of $9. Thus consumer surplus rises by $5 (which is the size of area B) when the price of a bottle of water falls from $4 to $2.5. a.Figure 10b. When the price of a bottle of water is $4, Ernie sells two bottles of water. His producer surplus is shown as area A in the figure. He receives $4 for his first bottle of water, but it costs only $1 to produce, so Ernie has producer surplus of $3. He also receives $4 for his second bottle of water, which costs $3 to produce, so he has producer surplus of $1. Thus Ernie’s total producer surplus is $3 + $1 = $4, which is the area of A in the figure.c. When the price of a bottle of water rises from $4 to $6, Ernie sells three bottles of water, an increase of one. His producer surplus consists of both areas A and B in the figure, an increase by the amount of area B. He gets producer surplus of $5 from the first bottle ($6 price minus $1 cost), $3 from the second bottle ($6 price minus $3 cost), and $1 from the third bottle ($6 price minus $5 price), for a total producer surplus of $9. Thus producer surplus rises by $5 (which is the size of area B) when the price of a bottle of water rises from $4 to $6.6. a. From Ernie’s supply schedule and Bert’s demand schedule, thean equilibrium quantity of two.b. At a price of $4, consumer surplus is $4 and producer surplus is $4, as shown in Problems 3 and 4 above. Total surplus is $4 + $4 = $8.c. If Ernie produced one less bottle, his producer surplus would decline to $3, as shown in Problem 4 above. If Bert consumed one less bottle, hisconsumer surplus would decline to $3, as shown in Problem 3 above. So total surplus would decline to $3 + $3 = $6.d. If Ernie produced one additional bottle of water, his cost would be $5, but the price is only $4, so his producer surplus would decline by $1. If Bert consumed one additional bottle of water, his value would be $3, but the price is $4, so his consumer surplus would decline by $1. So total surplus declines by $1 + $1 = $2.7. a. The effect of falling production costs in the market for stereos results in a shift to the right in the supply curve, as shown in Figure 11. As a result, the equilibrium price of stereos declines and the equilibriumquantity increases.Figure 11b. The decline in the price of stereos increases consumer surplus from area A to A + B + C + D, an increase in the amount B + C + D. Prior to the shift in supply, producer surplus was areas B + E (the area above the supply curve and below the price). After the shift in supply, producer surplus is areas E + F + G. So producer surplus changes by the amount F + G – B, which may be positive or negative. The increase in quantity increases producer surplus, while the decline in the price reduces producer surplus. Because consumer surplus rises by B + C + D and producer surplus rises by F + G – B, total surplus rises by C + D + F + G.c. If the supply of stereos is very elastic, then the shift of the supply curve benefits consumers most. To take the most dramatic case, suppose the supply curve were horizontal, as shown in Figure 12. Then there is no producer surplus at all. Consumers capture all the benefits of falling production costs, with consumer surplus rising from area A to area A + B.Figure 128. Figure 13 shows supply and demand curves for haircuts. Supply equals demand at a quantity of three haircuts and a price between $4 and $5. Firms A, C, and D should cut the hair of Ellen, Jerry, and Phil. Oprah’s willingnessto pay is too low and firm B’s costs are too high, so they do not participate. The maximum total surplus is the area between the demand and supply curves, which totals $11 ($8 value minus $2 cost for the first haircut, plus $7 value minus $3 cost for the second, plus $5 value minus $4 cost for the third).Figure 139. a. The effect of falling production costs in the market for computers results in a shift to the right in the supply curve, as shown in Figure 14. As a result, the equilibrium price of computers declines and the equilibrium quantity increases. The decline in the price of computers increases consumer surplus from area A to A + B + C + D, an increase in the amount B + C + D.Figure 14 Figure 15Prior to the shift in supply, producer surplus was areas B + E(the area above the supply curve and below the price). After theshift in supply, producer surplus is areas E + F + G. So producersurplus changes by the amount F + G – B, which may be positive ornegative. The increase in quantity increases producer surplus,while the decline in the price reduces producer surplus. Becauseconsumer surplus rises by B + C + D and producer surplus rises byF +G – B, total surplus rises by C + D + F + G.b. Because typewriters are substitutes for computers, the decline in the price of computers means that people substitute computers for typewriters, shifting the demand for typewriters to the left, as shown in Figure 15. The result is a decline in both the equilibrium price and equilibrium quantity of typewriters. Consumer surplus in the typewriter market changes from area A + B to A + C, a net change of C – B. Producer surplus changes from area C + D + E to area E, a net loss of C + D. Typewriter producers are sad about technological advances in computers because their producer surplus declines.c. Because software and computers are complements, the decline in the price and increase in the quantity of computers means that the demand for software increases, shifting the demand for software to the right, as shown in Figure 16. The result is an increase in both the price and quantity of software. Consumer surplus in the software market changes from B + C to A + B, a net change of A – C. Producer surplus changes from E to C + D + E, an increase of C + D, so software producers should be happy about the technological progress in computers.Figure 16d. Yes, this analysis helps explain why Bill Gates is one the world’s richest people, because his company produces a lot of software that is a complement with computers and there has been tremendous technological advance in computers.10. a. With Provider A, the cost of an extra minute is $0. WithProvider B, the cost of an extra minute is $1.b. With Provider A, my friend will purchase 150 minutes [= 150 –(50)(0)]. With Provider B, my friend would purchase 100 minutes [=150 – (50)(1)].c. With Provider A, he would pay $120. The cost would be $100 with Provider B.Figure 17d. Figure 17 shows the friend’s demand. With Provider A, he buys 150minutes and his consumer surplus is equal to (1/2)(3)(150) – 120= 105. With Provider B, his consumer surplus is equal to(1/2)(2)(100) = 100.e. I would recommend Provider A because he receives greater consumer surplus.11. a. Figure 18 illustrates the demand for medical care. If each procedure has a price of $100, quantity demanded will be Q1 procedures.Figure 18b. If consumers pay only $20 per procedure, the quantity demanded will be Qprocedures. Because the cost to society is $100, the number of procedures 2performed is too large to maximize total surplus. The quantity that maximizes total surplus is Q1 procedures, which is less than Q2.c. The use of medical care is excessive in the sense that consumers get procedures whose value is less than the cost of producing them. As a result, the economy’s total surplus is reduced.d. To prevent this excessive use, the consumer must bear the marginal cost of the procedure. But this would require eliminating insurance. Another possibility would be that the insurance company, which pays most of the marginal cost of the procedure ($80, in this case) could decide whether the procedure should be performed. But the insurance company does not get the benefits of the procedure, so its decisions may not reflect the value to the consumer.。
曼昆_经济学原理答案_英文版chp4
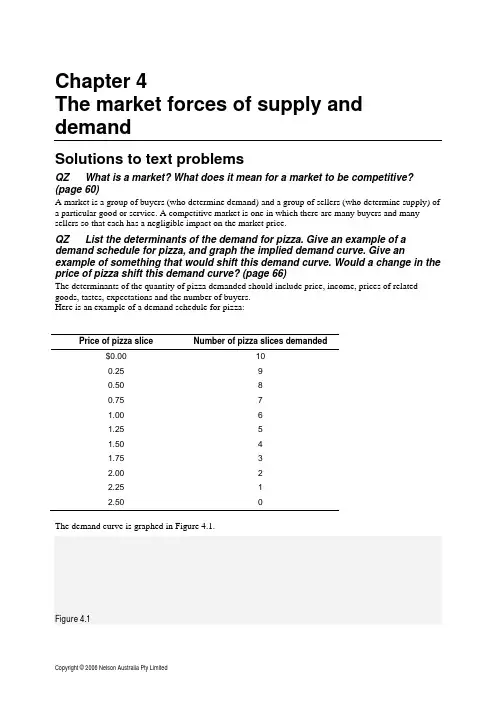
Chapter 4The market forces of supply and demandSolutions to text problemsQZ What is a market? What does it mean for a market to be competitive? (page 60)A market is a group of buyers (who determine demand) and a group of sellers (who determine supply) of a particular good or service. A competitive market is one in which there are many buyers and many sellers so that each has a negligible impact on the market price.QZ List the determinants of the demand for pizza. Give an example of a demand schedule for pizza, and graph the implied demand curve. Give an example of something that would shift this demand curve. Would a change in the price of pizza shift this demand curve? (page 66)The determinants of the quantity of pizza demanded should include price, income, prices of related goods, tastes, expectations and the number of buyers.Here is an example of a demand schedule for pizza:Price of pizza slice Number of pizza slices demanded$0.00 100.25 90.50 80.75 71.00 61.25 51.50 41.75 32.00 22.25 12.50 0The demand curve is graphed in Figure 4.1.Figure 4.1Chapter 4: The market forces of supply and demand 31Examples of things that would shift the demand curve include changes in income, prices of related goods like soft drink or hot dogs, tastes, and expectations about future income or prices.A change in the price of pizza would not shift this demand curve; it would only move from one point to another along the curve.QZ List the determinants of the supply of pizza. Give an example of a supply schedule for pizza, and graph the implied supply curve. Give an example of something that would shift this supply curve. Would a change in the price of pizza shift this supply curve? (page 71)The determinants of the quantity of pizza supplied include the price of pizza, the prices of inputs into pizza production, the technology for producing pizza, expectations about things like the future price of pizza and the number of suppliers of pizza.Here is an example of a supply schedule for pizza:Price of pizza slice Number of pizza slices supplied$0.00 00.25 1000.50 2000.75 3001.00 4001.25 5001.50 6001.75 7002.00 8002.25 9002.50 1000The supply curve is graphed in Figure 4.2.Figure 4.232 Principles of Economics, Third edition, Instructor’s ManualExamples of things that would shift the supply curve include changes in prices of inputs like tomato sauce and cheese, changes in technology like more efficient pizza ovens or automatic dough makers, and changes in expectations about the future price of pizza.A change in the price of pizza would not shift this supply curve; it would only move from one point to another along the curve.QZ Analyse what happens to the market for pizza if the price of tomatoes rises. Analyse what happens to the market for pizza if the price of hamburgers falls. (page 75)If the price of tomatoes rises, the supply curve for pizza shifts to the left because of the increased price of an input into pizza production, however there is no effect on demand. The shift to the left of the supply curve causes the equilibrium price to rise and the equilibrium quantity to decline, as Figure 4.3 shows.Figure 4.3Chapter 4: The market forces of supply and demand 33 If the price of hamburgers falls, the demand curve for pizza shifts to the left because the lower price of hamburgers will lead consumers to buy more hamburgers and less pizza, but there is no effect on supply. The shift to the left of the demand curve causes the equilibrium price to fall and the equilibrium quantity to decline, as Figure 4.4 shows.Figure 4.434 Principles of Economics, Third edition, Instructor’s ManualQuestions for review (page 79)1 A competitive market is a market in which there are many buyers and many sellers so that each has anegligible impact on the market price.2The quantity of a good that buyers demand is determined by the price of the good, income, the prices of related goods, tastes, expectations and the number of buyers.3The demand schedule is a table that shows the relationship between the price of a good and the quantity demanded. The demand curve is the downward-sloping line relating price and quantity demanded. The demand schedule and demand curve are related because the demand curve is simplya graph showing the points in the demand schedule.4The demand curve slopes downward because of the law of demand—other things equal, when the price of a good rises, the quantity demanded of the good falls. People buy less of a good when its price rises, both because they can't afford to buy as much and because they switch to purchasing other goods.5 A change in consumers' tastes leads to a shift of the demand curve. A change in price leads to amovement along the demand curve.6The quantity of a good that sellers supply is determined by the price of the good, input prices, technology, expectations and the number of suppliers.7 A supply schedule is a table showing the relationship between the price of a good and the quantity aproducer is willing and able to supply. The supply curve is the upward-sloping line relating price and quantity supplied. The supply schedule and the supply curve are related because the supply curve is simply a graph showing the points in the supply schedule.8The supply curve slopes upward because when the price is high, suppliers' profits increase, so they supply more output to the market. The result is the law of supply—other things equal, when the price of a good rises, the quantity supplied of the good also rises.9 A change in producers' technology leads to a shift in the supply curve. A change in price leads to amovement along the supply curve.10The equilibrium of a market is the point at which the demand and supply curves intersect. At the equilibrium price, the quantity of the good that buyers are willing and able to buy exactly balances the quantity that sellers are willing and able to sell. If the price is above the equilibrium price, sellers want to sell more than buyers want to buy, so there is a surplus. Sellers try to increase their sales by cutting prices; that continues until they reach the equilibrium price. If the price is below theequilibrium price, buyers want to buy more than sellers want to sell, so there is a shortage. Sellers can raise their price without losing customers; that continues until they reach the equilibrium price. 11When the price of beer rises, the demand for pies declines, because beer and pies are complements and people want to buy less beer. When we say the demand for pies declines, we mean that the demand curve for pies shifts to the left as in Figure 4.5 below. The supply curve for pies isn'taffected. With a shift to the left in the demand curve, the equilibrium price and quantity both decline, as the figure shows. Thus the quantity of pies supplied and demanded both fall. In summary, supply is unchanged, demand is decreased, quantity supplied declines, quantity demanded declines, and the price falls.Chapter 4: The market forces of supply and demand 35Figure 4.512 Prices play a vital role in market economies because they bring markets into equilibrium. If the priceis different from its equilibrium level, quantity supplied and quantity demanded aren't equal. The resulting surplus or shortage leads suppliers to adjust the price until equilibrium is restored. Prices thus serve as signals that guide economic decisions and allocate scarce resources.Problems and applications (page 80)1 a The cyclone damages the banana harvest, reducing the supply of bananas. This can be seen inFigure 4.6 as a shift to the left in the supply curve for bananas. The new equilibrium price is higher than the old equilibrium price. Figure 4.6P r i c e o f p i e sQuantity of bananasP r i c e o f b a n a n a sQuantity of pies36 Principles of Economics, Third edition, Instructor’s Manualb People often go to the pictures during school holidays so demand for picture tickets is highduring school holidays. When school holidays end, fewer people go to the pictures. The result, as shown in Figure 4.7, is a shift to the left in the demand curve. The equilibrium price of picture tickets is thus lower when school holidays end, as the figure shows. Figure 4.7c When a war breaks out in the Middle East, many markets are affected. Since much oilproduction takes place there, the war disrupts oil supplies, shifting the supply curve for petrol tothe left, as shown in Figure 4.8. The result is a rise in the equilibrium price of petrol. With a higher price for petrol, the cost of operating a big car, like a Ford Falcon, will increase. As a result, the demand for used Ford Falcons will decline, as people in the market for cars won't find Falcons as attractive. In addition, some people who already own Falcons will try to sell them. The result is that the demand curve for used Falcons shifts to the left, while the supply curve shifts to the right, as shown in Figure 4.9. The result is a decline in the equilibrium price of used Falcons.Figure 4.8Quantity of theatre tickets P r i c e o f t h e a t r e t i c k e t sP r i c e o f p e t r o l Quantity of petrolChapter 4: The market forces of supply and demand 37Figure 4.92 The statement that ‘an increase in the demand for notebooks raises the quantity of notebooksdemanded, but not the quantity supplied’ is false, in general. As Figure 4.10 shows, the increase in demand for notebooks results in an increased quantity supplied. The only way the statement would be true is if the supply curve were perfectly inelastic, as shown in Figure 4.11. Figure 4.10P r i c e o f u s e d F o r d F a l c o n sQuantity of used Ford Falcons38 Principles of Economics, Third edition, Instructor’s ManualFigure 4.113 a If people decide to have more children (a change in tastes), they'll want larger vehicles forhauling their kids around, so the demand for station wagons will increase. Supply won't be affected. The result is a rise in both price and quantity, as Figure 4.12 shows. Figure 4.12Quantity of Station WagonsP r i c e o f S t a t i o n W a g o n sChapter 4: The market forces of supply and demand 39b If a strike by steelworkers raises steel prices, the costs of producing a station wagon rise (a risein input prices), so the supply of station wagons decreases. Demand won't be affected. The result is a rise in the price of station wagons and a decline in the quantity, as Figure 4.13 shows.Figure 4.13c The development of new automated machinery for the production of station wagons is animprovement in technology. The reduction in firms' costs results in an increase in supply. Demand isn't affected. The result is a decline in the price of station wagons and an increase in the quantity, as Figure 4.14 shows.Figure 4.14d The rise in the price of minivans affects station wagon demand because minivans are substitutesfor station wagons (that is, there's a rise in the price of a related good). The result is an increase in demand for station wagons. Supply isn't affected. In equilibrium, the price and quantity of station wagons both rise, as Figure 4.12 shows.P r i c e o f S t a t i o n W a g o n sQuantity of Station WagonsP r i c e o f S t a t i o n W a g o n sQuantity of Station Wagonse The reduction in peoples' wealth caused by a stock market crash reduces their income, leading toa reduction in the demand for station wagons, since station wagons are a normal good. Supply isn’t affected. As a result, both price and quantity decline, as Figure 4.15 shows. Figure 4.154 Technological advances that reduce the cost of producing computer chips represent a decline in aninput price for producing a computer. The result is a shift to the right in the supply of computers, as shown in Figure 4.16. The equilibrium price falls and the equilibrium quantity rises, as the figure shows. Figure 4.16Quantity of Station WagonsP r i c e o f S t a t i o n W a g o n sSince computer software is a complement to computers, the increased equilibrium quantity of computers increases the demand for software. As Figure 4.17 shows, the result is a rise in both the equilibrium price and quantity of software.Figure 4.17Since typewriters are substitutes for computers, the increased equilibrium quantity of computers reduces the demand for typewriters. As Figure 4.18 shows, the result is a decline in both theequilibrium price and quantity of typewriters.Figure 4.185 a When an outbreak of ‘foot and mouth’ disease hits sheep farms in New Zealand, it raises inputprices for producing woollen jumpers. As a result, the supply of woollen jumpers shifts to the left, as shown in Figure 4.19. The new equilibrium has a higher price and lower quantity of woollen jumpers. Figure 4.19b A decline in the price of leather jackets leads more people to buy leather jackets, reducing thedemand for woollen jumpers. The result, shown in Figure 4.20, is a decline in both theequilibrium price and quantity of woollen jumpers.Figure 4.20Quantity of woollen jumpers P r i c e o f w o o l l e n j u m p e r sQuantity of woollen jumpersP r i c e o f w o o l l e n j u m p e r sc Kylie wearing a woollen jumper raises the demand for woollen jumpers, as shown in Figure4.21. The result is an increase in both the equilibrium price and quantity of woollen jumpers. Figure 4.21d The invention of new knitting machines increases the supply of woollen jumpers. As Figure 4.22shows, the result is a reduction in the equilibrium price and an increase in the equilibriumquantity of woollen jumpers.Figure 4.22P r i c e o f W o o l l e n J u m p e r sQuantity of Woollen Jumpers Quantity of Woollen JumpersP r i c e o f W o o l l e n J u m p e r s6 A temporarily high birth rate in the year 2005 leads to opposite effects on the price of babysittingservices in the years 2010 and 2020. In the year 2010, there are more 5-year-olds who need sitters, so the demand for babysitting services rises, as shown in Figure 4.23. The result is a higher price for babysitting services in 2010. However, in the year 2020, the increased number of 15-year-olds shifts the supply of babysitting services to the right, as shown in Figure 4.24. The result is a decline in the price of babysitting services.Figure 4.23Figure 4.247Since tomato sauce is a complement for hot dogs, when the price of hot dogs rises, the quantity demanded of hot dogs falls, thus reducing the demand for tomato sauce, causing both price and quantity of tomato sauce to fall. Since the quantity of tomato sauce falls, the demand for tomatoes by tomato sauce producers falls, so both price and quantity of tomatoes fall. When the price of tomatoes falls, producers of tomato juice face lower input prices, so the supply curve for tomato juice shifts down, causing the price of tomato juice to fall and the quantity of tomato juice to rise. The fall in the price of tomato juice causes people to substitute tomato juice for orange juice, so the demand for orange juice declines, causing the price and quantity of orange juice to fall. Now you can see clearly why a rise in the price of hot dogs leads to a fall in price of orange juice!8 a Cigars and chewing tobacco are substitutes for cigarettes, since a higher price for cigaretteswould increase demand for cigars and pipe tobacco.b An increase in the tax on cigarettes leads to increased demand for cigars and pipe tobacco. Theresult, as shown in Figure 4.25 for cigars, is a rise in both the equilibrium price and quantity of cigars and pipe tobacco.Figure 4.25c The results in part (b) showed that a tax on cigarettes leads people to substitute cigars and pipetobacco for cigarettes when the tax on cigarettes rises. To reduce total tobacco usage,policymakers might also want to increase the tax on cigars and pipe tobacco, or pursue sometype of public education program.9Quantity supplied equals quantity demanded at a price of $6 and quantity of 81 pizzas (Figure 4.26).If price were greater than $6, quantity supplied would exceed quantity demanded, so suppliers would reduce their price to gain sales. If price were less than $6, quantity demanded would exceed quantity supplied, so suppliers could raise their price without losing sales. In both cases, the price would continue to adjust until it reached $6, the only price at which there is neither surplus nor shortage. Figure 4.2610 a If the price of flour falls, since flour is an ingredient in bagels, the supply curve for bagels wouldshift to the right. The result, shown in Figure 4.27, would be a fall in the price of bagels and arise in the equilibrium quantity of bagels. Since cream cheese is a complement to bagels, the rise in quantity demanded of bagels increases the demand for cream cheese, as shown in Figure 4.28.The result is a rise in both the equilibrium price and quantity of cream cheese. So, a fall in theprice of flour indeed raises both the equilibrium price of cream cheese and the equilibriumquantity of bagels.Figure 4.27Figure 4.28What happens if the price of milk falls? Since milk is an ingredient in cream cheese, the fall in the price of milk leads to an increase in the supply of cream cheese. This leads to a decrease in the price of cream cheese (Figure 4.29), rather than a rise in the price of cream cheese. So a fall in the price of milk couldn't have been responsible for the pattern observed.Figure 4.29b In part (a), we found that a fall in the price of flour led to a rise in the price of cream cheese anda rise in the equilibrium quantity of bagels. If the price of flour rose, the opposite would be true;it would lead to a fall in the price of cream cheese and a fall in the equilibrium quantity ofbagels. Since the question says the equilibrium price of cream cheese has risen, it couldn't have been caused by a rise in the price of flour.What happens if the price of milk rises? From part (a), we found that a fall in the price of milk caused a decline in the price of cream cheese, so a rise in the price of milk would cause a rise in the price of cream cheese. Since bagels and cream cheese are complements, the rise in the price of cream cheese would reduce the demand for bagels, as Figure 4.30 shows. The result is adecline in the equilibrium quantity of bagels. So a rise in the price of milk does cause both a rise in the price of cream cheese and a decline in the equilibrium quantity of bagels.Figure 4.3011 a As Figure 4.31 shows, the supply curve is vertical. The constant supply makes sense because thepicture theatre has a fixed number of seats no matter what the price.Figure 4.31b Quantity supplied equals quantity demanded at a price of $8. The equilibrium quantity is 800tickets. cPriceQuantity demandedQuantity supplied$4 1400 800 8 1100 800 12 800 800 16 500 800 20 200800The new equilibrium price will be $12, which equates quantity demanded to quantity supplied. The equilibrium quantity is 800 tickets.P r i c e o f p i c t u r e t h e a t r e t i c k e t sQuantity of picture theatre tickets 80012The executives are confusing changes in demand with changes in quantity demanded. Figure 4.32 shows the demand curve prior to the marketing campaign (D1), and after the campaign (D2). The marketing campaign increased the demand for champagne, as shown, leading to a higher equilibrium price and quantity. The influence of the higher price on demand is already reflected in the outcome.It's impossible for the scenario outlined by the executives to occur.Figure 4.3213 At equilibrium Q S=Q D. Therefore here:1400 + 700P = 1600 – 300P1000P = 200P = $0.20The equilibrium price is $0.20 per bar of chocolate. Substitute this into either Q S or Q D to get the equilibrium quantity of 1540 bars of chocolate.。
曼昆宏观经济学第七版英文习题第四章
6.The holders of money pay the inflation tax. As prices rise, the real value of the moneythat people hold falls—that is, a given amount of money buys fewer goods and services since prices are higher.7.The Fisher equation expresses the relationship between nominal and real interestrates. It says that the nominal interest rate i equals the real interest rate r plus the inflation rate π:i= r+ π.This tells us that the nominal interest rate can change either because the real interest rate changes or the inflation rate changes. The real interest rate is assumed to be unaf-fected by inflation; as discussed in Chapter 3, it adjusts to equilibrate saving and investment. There is thus a one-to-one relationship between the inflation rate and the nominal interest rate: if inflation increases by 1 percent, then the nominal interest rate also increases by 1 percent. This one-to-one relationship is called the Fisher effect.If inflation increases from 6 to 8 percent, then the Fisher effect implies that the nominal interest rate increases by 2 percentage points, while the real interest rate remains constant.8.The costs of expected inflation include the following:a.Shoeleather costs.H igher inflation means higher nominal interest rates, whichmean that people want to hold lower real money balances. If people hold lowermoney balances, they must make more frequent trips to the bank to withdrawmoney. This is inconvenient (and it causes shoes to wear out more quickly).b.Menu costs.H igher inflation induces firms to change their posted prices moreoften. This may be costly if they must reprint their menus and catalogs.c.Greater variability in relative prices. If firms change their prices infrequently,then inflation causes greater variability in relative prices. Since free-marketeconomies rely on relative prices to allocate resources efficiently, inflation leads tomicroeconomic inefficiencies.d.Altered tax liabilities.Many provisions of the tax code do not take into account theeffect of inflation. Hence, inflation can alter individuals’ and firms’ tax liabilities,often in ways that lawmakers did not intend.e.The inconvenience of a changing price level.It is inconvenient to live in a worldwith a changing price level. Money is the yardstick with which we measure eco-nomic transactions. Money is a less useful measure when its value is alwayschanging.There is an additional cost to unexpected inflation:f.Arbitrary redistributions of wealth.Unexpected inflation arbitrarily redistributeswealth among individuals. For example, if inflation is higher than expected,debtors gain and creditors lose. Also, people with fixed pensions are hurt becausetheir dollars buy fewer goods.9.Hyperinflation is always a reflection of monetary policy. That is, the price level cannotgrow rapidly unless the supply of money also grows rapidly; and hyperinflations do not end unless the government drastically reduces money growth. This explanation, howev-er, begs a central question: Why does the government start and then stop printing lots of money? The answer almost always lies in fiscal policy: When the government has a large budget deficit (possibly due to a recent war or some other major event) that it can-not fund by borrowing, it resorts to printing money to pay its bills. And only when this fiscal problem is alleviated—by reducing government spending and collecting more taxes—can the government hope to slow its rate of money growth.10.Real variables are measured in physical units, and nominal variables are measured interms of money. Real variables have been adjusted for inflation and are often measured in terms of constant dollars, while nominal variables are measured in terms of current dollars. For example, real GDP is measured in terms of constant base-year dollars, while nominal GDP is measured in current dollars. An increase in real GDP means weand growth of M 3 was 22 percent. Note that countries with higher rates of inflation have higher nominal interest rates. To show that countries with higher rates of money growth have higher rates of inflation is more difficult and requires gathering data on inflation and money growth across a range of years. Money growth can vary substan-tially from year to year within a country, and this is not always immediately reflected in the inflation rate.As another example, in the twelve months ending in November 2001, consumer prices in Turkey rose 69 percent from a year earlier, M 1 rose 55 percent while M 2 rose 52 percent, and short-term interest rates were 54 percent. By contrast, in the United States in the twelve months ending in December 2001, consumer prices rose about 2percent, M 1 rose 8 percent, M 2 rose 14 percent; and short-term interest rates were a little under 2 percent. These data are consistent with the theories in the chapter, in that high-inflation countries have higher rates of money growth and also higher nomi-nal interest rates.More Problems and Applications to Chapter 41.With constant money growth at rate µ, the question tells us that the Cagan modelimplies that p t = m t + γµ. This question draws out the implications of this equation.a.One way to interpret this result is to rearrange to find:m t – p t = –γµ.That is, real balances depend on the money growth rate. As the growth rate of money rises, real balances fall. This makes sense in terms of the model in this chapter, since faster money growth implies faster inflation, which makes it less desirable to hold money balances.b.With unchanged growth in the money supply, the increase in the level of the money supply m t increases the price level p t one-for-one. c.With unchanged current money supply m t , a change in the growth rate of money µchanges the price level in the same direction. d.When the central bank reduces the rate of money growth µ, the price level willimmediately fall. To offset this decline in the price level, the central bank can increase the current level of the money supply m t , as we found in part (b). These answers assume that at each point in time, private agents expect the growth rate of money to remain unchanged, so that the change in policy takes them by sur-prise—but once it happens, it is completely credible. A practical problem is that the private sector might not find it credible that an increase in the current money supply signals a decrease in future money growth rates.e.If money demand does not depend on the expected rate of inflation, then the price level changes only when the money supply itself changes. That is, changes in the growth rate of money µdo not affect the price level. In part (d), the central bank can keep the current price level p t constant simply by keeping the current money supply m tconstant.。
曼昆经济学原理第六版第4章 供给与需求的市场力量课后习题答案
圣才考研网 ——考研考博专业课辅导―中国第一品牌咨询 QQ:1224978229第2篇 第4章市场如何运行供给与需求的市场力量一、概念题 1.市场(market) 答: 市场指某种物品或劳务的买者与卖者组成的一个群体。
买者作为一个群体决定了一 种物品或劳务的需求,而卖者作为一个群体决定了一种物品或劳务的供给。
市场作为商品经济的范畴,具有三层含义:一是指商品交换的场所;二是指由商品供求 双方及其中介人之间, 围绕着体现各自利益的价格而展开激烈竞争所形成的各种经济关系总 和; 三是指调节社会经济运行的一种关系。
贯穿于这三层含义并能统一于市场这一范畴的核 心是商品交换,或者说是商品流通。
2.竞争市场(competitive market) 答: 竞争市场指有许多买者和卖者, 以至于每一个人对市场价格的影响都微不足道的市 场。
竞争市场一般指完全竞争市场。
完全竞争,又称为纯粹竞争,是指不存在任何阻碍和干 扰竞争因素的市场情况, 亦即没有任何垄断因素的市场结构。
完全竞争市场需要具备以下四 个条件:①市场上有大量的买者和卖者;②市场上每一个厂商提供的商品都是同质的;③所 有的资源具有完全的流动性;④信息是完全的。
3.需求量(quantity demanded) 答: 需求量是指消费者在一定时期内, 在各种可能的价格水平下愿意而且能够购买的商 品的数量。
根据定义,如果消费者对某种商品只有购买的欲望而没有购买的能力,就不能算 作是需求。
需求必须是既有购买欲望又有购买能力的有效需求。
影响商品需求的因素有:该 商品的价格、消费者收入、其他相关商品价格、消费者偏好和消费者对未来的预期等。
在其 他影响因素不变的条件下,需求量与价格的关系可用需求曲线来表示。
一般说来,随着商品 价格的提高,消费者消费商品的数量减少。
4.需求定理(law of demand) 答:需求定理是有关物品价格与需求量之间关系的定理。
该定理的内容是:在其他条件 不变的情况下, 某商品的需求量与价格之间成反方向变动, 即需求量随着商品本身价格的上 升而减少,随商品价格的下降而增加。
曼昆经济学原理 第五版 课后答案 第四篇 公共部门经济学
第四篇公共部门经济学第十章外部性复习题1.举出一个负外部性的例子和一个正外部性的例子。
答:负外部性的例子:化工厂排放的化学废气,污染了环境,但它却不必承担污染的全部成本。
正外部性的例子:在临街的自家院子里种花,既美化了自己家的环境,又使邻居和路人可以欣赏到美丽的花,具有正外部性。
2.用供求图解释生产中负外部性的影响。
图10-1 存在负外部性的供求图答:生产中的外部性使该物品的社会成本大于私人成本,生产该物品的最优数量小于其均衡数量,即市场量。
3.专利制用什么方法帮助社会解决了一个外部性问题?答:专利制利用法律法规的形式规定专利发明者可以在一定时期排他性的使用自己的发明的权利,激励发明者更多地进行新技术研究,科技发明的正外部性内在化。
4.列出不用政府干预时也可以解决外部性引起的问题的一些方法。
答:私人解决外部性所引起的问题的方法有:(1)用道德规范和社会约束来解决;(2)慈善行为;(3)通过依靠有关各方的私利来解决外部性问题;(4)利益各方签订合约。
5.设想你与一个吸烟者同住一间房,但你不吸烟。
根据科斯定理,什么因素决定了你的室友是否在房间里吸烟?这个结果有效率吗?你和你室友如何达成这种解决方法?答:根据科斯定理,如果我被迫吸烟所承受的成本大于我的室友吸烟所获得的收益,我的室友就不应该在房间里吸烟。
如果我的成本小于室友的收益,她就可以在房间里吸烟。
我可以通过对她进行吸烟有害的教育,同时给她买一些糖果以缓解她不能吸烟的痛苦,来与她达成协议——她以后不在房间里吸烟。
6.为什么经济学家对庇古税作为一种保护环境免受污染的方法的偏好大于管制?答:经济学家偏爱庇古税,首先是因为它减少污染更有效率。
庇古税实际上规定了污染权的价格,并把污染权分配给那些减少污染成本最高的工厂。
无论环境保护机构选择的污染水平是多少,它都可以用税收以最低的总成本达到这个目标。
其次,庇古税对环境更有利。
在管制政策下,企业被动地减少污染,一旦达到了管制的要求,它就没有理由再减少排污。
曼昆微观经济学课后练习英文答案
WHAT’S NEW IN THE SIXTH EDITION:There are no major changes to this chapter.LEARNING OBJECTIVES:By the end of this chapter, students should understand: the link between buyers’ willingness to pay for a good and the demand curve. how to define and measure consumer surplus. the link between sellers’ costs of producing a good and the supply curve. how to define and measure producer surplus. that the equilibrium of supply and demand maximizes total surplus in a market.CONTEXT AND PURPOSE:Chapter 7 is the first chapter in a three-chapter sequence on welfare economics and market efficiency. Chapter 7 employs the supply and demand model to develop consumer surplus and producer surplus as a measure of welfare and market efficiency. These concepts are then utilized in Chapters 8 and 9 to determine the winners and losers from taxation and restrictions on international trade. The purpose of Chapter 7 is to develop welfare economics —the study of how the allocation of resources affects economic well-being. Chapters 4 through 6 employed supply and demand in a positive framework, which focused on the question, “What is the equilibrium price and quantity in a market” This chapter now addresses the normative question, “Is the equilibri um price and quantity in a market the best possible solution to the resource allocation problem, or is it simply the price and quantity that balance supply and demand” Students will discover that under most circumstances the equilibrium price and quantity is also the one that maximizes welfare.CONSUMERS, PRODUCERS, AND THEEFFICIENCY OF MARKETSKEY POINTS:Consumer surplus equals buyers’ willingness to pay for a good minus the amount they actually pay for it, and it measures the benefit buyers get from participating in a market. Consumer surplus can be computed by finding the area below the demand curve and above the price.Producer surplus equals the amount sellers receive for their goods minus their costs of production, and it measures the benefit sellers get from participating in a market. Producer surplus can be computed by finding the area below the price and above the supply curve.An allocation of resources that maximizes the sum of consumer and producer surplus is said to be efficient.Policymakers are often concerned with the efficiency, as well as the equality, of economic outcomes.The equilibrium of supply and demand maximizes the sum of consumer and producer surplus. That is, the invisible hand of the marketplace leads buyers and sellers to allocate resources efficiently.Markets do not allocate resources efficiently in the presence of market failures such as market power or externalities.CHAPTER OUTLINE:I. Definition of welfare economics: the study of how the allocation of resources affects economic well-being.II. Consumer SurplusA. Willingness to Pay1. Definition of willingness to pay: the maximum amount that a buyer will pay for a good.2. Example: You are auctioning a mint-condition recording of Elvis Presley’s first album. Four buyersshow up. Their willingness to pay is as follows:If the bidding goes to slightly higher than $80, all buyers drop out except for John.Because John is willing to pay more than he has to for the album, he derives somebenefit from participating in the market.3. Definition of consumer surplus: the amount a buyer is willing to pay for a good minus the amountthe buyer actually pays for it.4. Note that if you had more than one copy of the album, the price in the auction would end up beinglower (a little over $70 in the case of two albums) and both John and Paul would gain consumer surplus.B. Using the Demand Curve to Measure Consumer Surplus1. We can use the information on willingness to pay to derive a demand curve for the rare Elvis Presleyalbum.PriceBuyersQuantity DemandedMore than $100 None 0 $80 to $100 John1 $70 to $80 John, Paul2 $50 to $70 John, Paul, George3 $50 or lessJohn, Paul, George, Ringo42. At any given quantity, the price given by the demand curve reflects the willingness to pay of themarginal buyer . Because the demand curve shows the buyers’ willingness to pay, we can use the demand curve to measure consumer surplus.Figure 1 “This represents the demand curve for the time machine. Consumer surplus is the difference between what consumers are willing to pay and the amount they actually have to pay. The market price will determine who uses the time machi ne and how much surplus they keep.”“If the price of a time machine ride was $500, three rides would be sold—one to Scott, one to Carol, and one to Steve. Jeanne is not willing to pay $500, so she wouldn’t time travel.”“We can calculate the consumer su rplus of three time trips. Scott would pay $3,000 but only pays $500, leaving $2,500 of net benefits.” (Put these numbers on the board.) “Carol has net benefits of $2,000. Steve has $300 in net benefits. Adding up these net savings gives $4,800 in consumer surplus.”Points for DiscussionThe consumer surplus depends on a good’s selling price and the number of consumers who are willing to purchase the good at that price. The lower the price, the greater the consumer surplus.Figure 23. Consumer surplus can be measured as the area below the demand curve and above the price.C. How a Lower Price Raises Consumer SurplusFigure 31. As price falls, consumer surplus increases for two reasons.a. Those already buying the product will receive additional consumer surplus because they arepaying less for the product than before (area A on the graph).b. Because the price is now lower, some new buyers will enter the market and receive consumersurplus on these additional units of output purchased (area B on the graph).D. What Does Consumer Surplus MeasureIt is important to stress that consumer surplus is measured in monetary terms. Consumersurplus gives us a way to place a monetary cost on inefficient market outcomes (due togovernment involvement or market failure).1. Remember that consumer surplus is the difference between the amount that buyers are willing topay for a good and the price that they actually pay.2. Thus, it measures the benefit that consumers receive from the good as the buyers themselvesperceive it.III. Producer SurplusA. Cost and the Willingness to Sell1. Definition of cost: the value of everything a seller must give up to produce a good .2. Example: You want to hire someone to paint your house. You accept bids for the work from foursellers. Each painter is willing to work if the price you will pay exceeds her opportunity cost. (Note that this opportunity cost thus represents willingness to sell.) The costs are:3. Bidding will stop when the price gets to be slightly below $600. All sellers will drop out except forGrandma. Because Grandma receives more than she would require to paint the house, she derives some benefit from producing in the market.4. Definition of producer surplus : the amount a seller is paid for a good minus the seller’s cost ofproviding it.5. Note that if you had more than one house to paint, the price in the auction would end up beinghigher (a little under $800 in the case of two houses) and both Grandma and Georgia would gain producer surplus.ALTERNATIVE CLASSROOM EXAMPLE:Review the material on price ceilings from Chapter 6. Redraw the market for two-bedroom apartments in your town. Draw in a price ceiling below the equilibrium price.Then go through: consumer surplus before the price ceiling is put into place. consumer surplus after the price ceiling is put into place.B. Using the Supply Curve to Measure Producer Surplus1. We can use the information on cost (willingness to sell) to derive a supply curve for house paintingservices.Price Sellers Quantity Supplied$900 or more Mary, Frida, Georgia, Grandma4$800 to $900Frida, Georgia, Grandma3$600 to $800Georgia, Grandma2$500 to $600Grandma1less than $500None02. At any given quantity, the price given by the supply curve represents the cost of the marginal seller.Because the supply curve shows the sellers’ cost (willingness to sell), we can use the supply curve to measure producer surplus.3. Producer surplus can be measured as the area above the supply curve and below the price.Figure 4Figure 5C. How a Higher Price Raises Producer Surplus1. As price rises, producer surplus increases for two reasons.a. Those already selling the product will receive additional producer surplus because they arereceiving more for the product than before (area C on the graph).b. Because the price is now higher, some new sellers will enter the market and receive producersurplus on these additional units of output sold (area D on the graph).D. Producer surplus is used to measure the economic well-being of producers, much like consumer surplus isused to measure the economic well-being of consumers.Figure 6ALTERNATIVE CLASSROOM EXAMPLE:Review the material on price floors from Chapter 6. Redraw the market for an agricultural productsuch as corn. Draw in a price support above the equilibrium price.Then go through:producer surplus before the price support is put in place.producer surplus after the price support is put in place.Make sure that you discuss the cost of the price support to taxpayers.Pretty Woman, Chapter 6. Vivien (Julia Roberts) and Edward (Richard Gere) negotiate aprice. Afterward, Vivien reveals she would have accepted a lower price, while Edward admitshe would have paid more. If you have done a good job of introducing consumer andproducer surplus, you will see the light bulbs go off above your students’ heads as theywatch this clip.IV. Market EfficiencyA. The Benevolent Social Planner1. The economic well-being of everyone in society can be measured by total surplus, which is the sum ofconsumer surplus and producer surplus:Total Surplus = Consumer Surplus + Producer SurplusTotal Surplus = (Value to Buyers – Amount Paid by Buyers) + (Amount Received by Sellers – Cost to Sellers)Because the Amount Paid by Buyers = Amount Received by Sellers:2. Definition ofefficiency: the property of a resource allocation of maximizing the total surplusreceived by all members of society .3. Definition of equality: the property of distributing economic prosperity uniformly the members ofsociety .B. Evaluating the Market EquilibriumTotal Surplus = Value to Buyers Cost to Sellers Figure 7 Now might be a good time to point out that many government policies involve a trade-off between efficiency and equity. When you evaluate government policies, like price ceilings or floors, you can explain them in terms of equity and efficiency.1. At the market equilibrium price:a. Buyers who value the product more than the equilibrium price will purchase the product; thosewho do not, will not purchase the product. In other words, the free market allocates the supplyof a good to the buyers who value it most highly, as measured by their willingness to pay.b. Sellers whose costs are lower than the equilibrium price will produce the product; those whosecosts are higher, will not produce the product. In other words, the free market allocates thedemand for goods to the sellers who can produce it at the lowest cost.2. Total surplus is maximized at the market equilibrium.Figure 8a. At any quantity of output smaller than the equilibrium quantity, the value of the product to themarginal buyer is greater than the cost to the marginal seller so total surplus would rise if outputincreases.b. At any quantity of output greater than the equilibrium quantity, the value of the product to themarginal buyer is less than the cost to the marginal seller so total surplus would rise if outputdecreases.3. Note that this is one of the reasons that economists believe Principle #6: Markets are usually a goodway to organize economic activity.It would be a good idea to remind students that there are circumstances when the marketprocess does not lead to the most efficient outcome. Examples include situations such aswhen a firm (or buyer) has market power over price or when there are externalities present.These situations will be discussed in later chapters.C. In the News: Ticket Scalping1. Ticket scalping is an example of how markets work to achieve an efficient outcome.2. This article from The Boston Globe describes economist Chip Case’s experience with ticket scalping.D. Case Study: Should There Be a Market in Organs1. As a matter of public policy, people are not allowed to sell their organs.a. In essence, this means that there is a price ceiling on organs of $0.b. This has led to a shortage of organs.2. The creation of a market for organs would lead to a more efficient allocation of resources, but criticsworry about the equity of a market system for organs.V. Market Efficiency and Market FailureA. To conclude that markets are efficient, we made several assumptions about how markets worked.1. Perfectly competitive markets.2. No externalities.B. When these assumptions do not hold, the market equilibrium may not be efficient.C. When markets fail, public policy can potentially remedy the situation.SOLUTIONS TO TEXT PROBLEMS:Quick Quizzes1. Figure 1 shows the demand curve for turkey. The price of turkey is P1 and the consumer surplus thatresults from that price is denoted CS. Consumer surplus is the amount a buyer is willing to pay for agood minus the amount the buyer actually pays for it. It measures the benefit to buyers ofparticipating in a market.Figure 1 Figure 22. Figure 2 shows the supply curve for turkey. The price of turkey is P1 and the producer surplus thatresults from that price is denoted PS. Producer surplus is the amount sellers are paid for a goodminus the sellers’ cost of providing it (measured by the supply curve). It measures the benefit tosellers of participating in a market.Figure 33. Figure 3 shows the supply and demand for turkey. The price of turkey is P1, consumer surplus is CS,and producer surplus is PS. Producing more turkeys than the equilibrium quantity would lower totalsurplus because the value to the marginal buyer would be lower than the cost to the marginal selleron those additional units.Questions for Review1. The price a buyer is willing to pay, consumer surplus, and the demand curve are all closely related.The height of the demand curve represents the willingness to pay of the buyers. Consumer surplus isthe area below the demand curve and above the price, which equals the price that each buyer iswilling to pay minus the price actually paid.2. Sellers' costs, producer surplus, and the supply curve are all closely related. The height of the supplycurve represents the costs of the sellers. Producer surplus is the area below the price and above thesupply curve, which equals the price received minus each seller's costs of producing the good.Figure 43. Figure 4 shows producer and consumer surplus in a supply-and-demand diagram.4. An allocation of resources is efficient if it maximizes total surplus, the sum of consumer surplus andproducer surplus. But efficiency may not be the only goal of economic policymakers; they may also beconcerned about equitythe fairness of the distribution of well-being.5. The invisible hand of the marketplace guides the self-interest of buyers and sellers into promotinggeneral economic well-being. Despite decentralized decision making and self-interested decisionmakers, free markets often lead to an efficient outcome.6. Two types of market failure are market power and externalities. Market power may cause marketoutcomes to be inefficient because firms may cause price and quantity to differ from the levels theywould be under perfect competition, which keeps total surplus from being maximized. Externalitiesare side effects that are not taken into account by buyers and sellers. As a result, the free marketdoes not maximize total surplus.Problems and Applications1. a. Consumer surplus is equal to willingness to pay minus the price paid. Therefore, Melissa’swillingness to pay must be $200 ($120 + $80).b. Her consumer surplus at a price of $90 would be $200 $90 = $110.c. If the price of an iPod was $250, Melissa would not have purchased one because the price isgreater than her willingness to pay. Therefore, she would receive no consumer surplus.2. If an early freeze in California sours the lemon crop, the supply curve for lemons shifts to the left, asshown in Figure 5. The result is a rise in the price of lemons and a decline in consumer surplus from A+ B + C to just A. So consumer surplus declines by the amount B + C.Figure 5 Figure 6In the market for lemonade, the higher cost of lemons reduces the supply of lemonade, as shown inFigure 6. The result is a rise in the price of lemonade and a decline in consumer surplus from D + E + Fto just D, a loss of E + F. Note that an event that affects consumer surplus in one market often haseffects on consumer surplus in other markets.3. A rise in the demand for French bread leads to an increase in producer surplus in the market forFrench bread, as shown in Figure 7. The shift of the demand curve leads to an increased price, which increases producer surplus from area A to area A + B + C.Figure 7The increased quantity of French bread being sold increases the demand for flour, as shown in Figure8. As a result, the price of flour rises, increasing producer surplus from area D to D + E + F. Note thatan event that affects producer surplus in one market leads to effects on producer surplus in related markets.Figure 84. a. Bert’s demand schedule is:Price Quantity DemandedMore than $70$5 to $71$3 to $52$1 to $33$1 or less4Bert’s demand curve is shown in Figure 9.Figure 9b. When the price of a bottle of water is $4, Bert buys two bottles of water. His consumer surplus isshown as area A in the figure. He values his first bottle of water at $7, but pays only $4 for it, so has consumer surplus of $3. He values his second bottle of water at $5, but pays only $4 for it, so has consumer surplus of $1. Thus Bert’s total consumer surplus is $3 + $1 = $4, which is the area of A in the figure.c. When the price of a bottle of water falls from $4 to $2, Bert buys three bottles of water, anincrease of one. His consumer surplus consists of both areas A and B in the figure, an increase in the amount of area B. He gets consumer surplus of $5 from the first bottle ($7 value minus $2price), $3 from the second bottle ($5 value minus $2 price), and $1 from the third bottle ($3value minus $2 price), for a total consumer surplus of $9. Thus consumer surplus rises by $5(which is the size of area B) when the price of a bottle of water falls from $4 to $2.5. a. Ernie’s supply schedule for water is:Price Quantity SuppliedMore than $74$5 to $73$3 to $52$1 to $31Less than $10Ernie’s supply curve i s shown in Figure 10.Figure 10b. When the price of a bottle of water is $4, Ernie sells two bottles of water. His producer surplus isshown as area A in the figure. He receives $4 for his first bottle of water, but it costs only $1 toproduce, so Ernie has producer surplus of $3. He also receives $4 for his second bottle of water, which costs $3 to produce, so he has producer surplus of $1. Thus Ernie’s total producer surplus is $3 + $1 = $4, which is the area of A in the figure.c. When the price of a bottle of water rises from $4 to $6, Ernie sells three bottles of water, anincrease of one. His producer surplus consists of both areas A and B in the figure, an increase by the amount of area B. He gets producer surplus of $5 from the first bottle ($6 price minus $1cost), $3 from the second bottle ($6 price minus $3 cost), and $1 from the third bottle ($6 priceminus $5 price), for a total producer surplus of $9. Thus producer surplus rises by $5 (which is the size of area B) when the price of a bottle of water rises from $4 to $6.6. a. From Ernie’s supply schedule and Bert’s demand schedule, the quantity demanded and suppliedare:Price Quantity Supplied Quantity Demanded$213$422$631Only a price of $4 brings supply and demand into equilibrium, with an equilibrium quantity oftwo.b. At a price of $4, consumer surplus is $4 and producer surplus is $4, as shown in Problems 3 and 4above. Total surplus is $4 + $4 = $8.c. If Ernie produced one less bottle, his producer surplus would decline to $3, as shown in Problem4 above. If Bert consumed one less bottle, his consumer surplus would decline to $3, as shown inProblem 3 above. So total surplus would decline to $3 + $3 = $6.d. If Ernie produced one additional bottle of water, his cost would be $5, but the price is only $4, sohis producer surplus would decline by $1. If Bert consumed one additional bottle of water, hisvalue would be $3, but the price is $4, so his consumer surplus would decline by $1. So totalsurplus declines by $1 + $1 = $2.7. a. The effect of falling production costs in the market for stereos results in a shift to the right in thesupply curve, as shown in Figure 11. As a result, the equilibrium price of stereos declines and the equilibrium quantity increases.Figure 11b. The decline in the price of stereos increases consumer surplus from area A to A + B + C + D, anincrease in the amount B + C + D. Prior to the shift in supply, producer surplus was areas B + E(the area above the supply curve and below the price). After the shift in supply, producer surplus is areas E + F + G. So producer surplus changes by the amount F + G – B, which may be positive or negative. The increase in quantity increases producer surplus, while the decline in the pricereduces producer surplus. Because consumer surplus rises by B + C + D and producer surplusrises by F + G – B, total surplus rises by C + D + F + G.c. If the supply of stereos is very elastic, then the shift of the supply curve benefits consumers most.To take the most dramatic case, suppose the supply curve were horizontal, as shown in Figure 12.Then there is no producer surplus at all. Consumers capture all the benefits of falling productioncosts, with consumer surplus rising from area A to area A + B.Figure 128. Figure 13 shows supply and demand curves for haircuts. Supply equals demand at a quantity of threehaircuts and a price between $4 and $5. Firms A, C, and D should cut the hair of Ellen, Jerry, and Phil.Oprah’s willingness to pay is too low and firm B’s costs are too high, so they do not participate. The maximum total surplus is the area between the demand and supply curves, which totals $11 ($8 value minus $2 cost for the first haircut, plus $7 value minus $3 cost for the second, plus $5 value minus $4 cost for the third).Figure 139. a. The effect of falling production costs in the market for computers results in a shift to the right inthe supply curve, as shown in Figure 14. As a result, the equilibrium price of computers declines and the equilibrium quantity increases. The decline in the price of computers increases consumer surplus from area A to A + B + C + D, an increase in the amount B + C + D.Figure 14 Figure 15Prior to the shift in supply, producer surplus was areas B + E (the area above the supply curve and below the price). After the shift in supply, producer surplus is areas E + F + G. So producer surplus changes by the amount F + G – B, which may be positive or negative. The increase in quantity increases producer surplus, while the decline in the price reduces producer surplus.Because consumer surplus rises by B + C + D and producer surplus rises by F + G – B, total surplus rises by C + D + F + G.b. Because typewriters are substitutes for computers, the decline in the price of computers meansthat people substitute computers for typewriters, shifting the demand for typewriters to the left, as shown in Figure 15. The result is a decline in both the equilibrium price and equilibriumquantity of typewriters. Consumer surplus in the typewriter market changes from area A + B to A + C, a net change of C – B. Producer surplus changes from area C + D + E to area E, a net loss of C + D. Typewriter producers are sad about technological advances in computers because their producer surplus declines.c. Because software and computers are complements, the decline in the price and increase in thequantity of computers means that the demand for software increases, shifting the demand forsoftware to the right, as shown in Figure 16. The result is an increase in both the price andquantity of software. Consumer surplus in the software market changes from B + C to A + B, a net change of A – C. Producer surplus changes from E to C + D + E, an increase of C + D, so softwareproducers should be happy about the technological progress in computers.Figure 16d. Yes, this analysis helps explain why Bill Gates is one the world’s richest people, because hiscompany produces a lot of software that is a complement with computers and there has beentremendous technological advance in computers.10. a. With Provider A, the cost of an extra minute is $0. With Provider B, the cost of an extra minute is$1.b. With Provider A, my friend will purchase 150 minutes [= 150 – (50)(0)]. With Provider B, myfriend would purchase 100 minutes [= 150 – (50)(1)].c. With Provider A, he would pay $120. The cost would be $100 with Provider B.Figure 17d. Figure 17 shows the friend’s demand. With Provider A, he buys 150 minutes and his cons umersurplus is equal to (1/2)(3)(150) – 120 = 105. With Provider B, his consumer surplus is equal to(1/2)(2)(100) = 100.e. I would recommend Provider A because he receives greater consumer surplus.11. a. Figure 18 illustrates the demand for medical care. If each procedure has a price of $100, quantitydemanded will be Q1 procedures.Figure 18b. If consumers pay only $20 per procedure, the quantity demanded will be Q2 procedures. Becausethe cost to society is $100, the number of procedures performed is too large to maximize totalsurplus. The quantity that maximizes total surplus is Q1 procedures, which is less than Q2.c. The use of medical care is excessive in the sense that consumers get procedures whose value isless than the cost of produ cing them. As a result, the economy’s total surplus is reduced.d. To prevent this excessive use, the consumer must bear the marginal cost of the procedure. Butthis would require eliminating insurance. Another possibility would be that the insurancecompany, which pays most of the marginal cost of the procedure ($80, in this case) could decide whether the procedure should be performed. But the insurance company does not get thebenefits of the procedure, so its decisions may not reflect the value to the consumer.。
- 1、下载文档前请自行甄别文档内容的完整性,平台不提供额外的编辑、内容补充、找答案等附加服务。
- 2、"仅部分预览"的文档,不可在线预览部分如存在完整性等问题,可反馈申请退款(可完整预览的文档不适用该条件!)。
- 3、如文档侵犯您的权益,请联系客服反馈,我们会尽快为您处理(人工客服工作时间:9:00-18:30)。
Problems and Applications1. a. Cold weather damages the orange crop, reducing the supply of oranges. Thiscan be seen in Figure 4-6 as a shift to the left in the supply curve for oranges.The new equilibrium price is higher than the old equilibrium price.Figure 4-6b. People often travel to the Caribbean from New England to escape cold weather, sodemand for Caribbean hotel rooms is high in the winter. In the summer, fewerpeople travel to the Caribbean, since northern climes are more pleasant. Theresult, as shown in Figure 4-7, is a shift to the left in the demand curve. Theequilibrium price of Caribbean hotel rooms is thus lower in the summer than in thewinter, as the figure shows.Figure 4-7c. When a war breaks out in the Middle East, many markets are affected. Sincemuch oil production takes place there, the war disrupts oil supplies, shifting thesupply curve for gasoline to the left, as shown in Figure 4-8. The result is a rise in the equilibrium price of gasoline. With a higher price for gasoline, the cost ofoperating a gas-guzzling automobile, like a Cadillac, will increase. As a result, the demand for used Cadillacs will decline, as people in the market for cars won't find Cadillacs as attractive. In addition, some people who already own Cadillacs willtry to sell them. The result is that the demand curve for used Cadillacs shifts to the left, while the supply curve shifts to the right, as shown in Figure 4-9. Theresult is a decline in the equilibrium price of used Cadillacs.Figure 4-8Figure 4-92. The statement that "an increase in the demand for notebooks raises the quantity ofnotebooks demanded, but not the quantity supplied" is false, in general. As Figure 4-10 shows, the increase in demand for notebooks results in an increased quantity supplied.The only way the statement would be true is if the supply curve were perfectly inelastic, asshown in Figure 4-11.Figure 4-10Figure 4-113. a. If people decide to have more children (a change in tastes), they'll want largervehicles for hauling their kids around, so the demand for minivans will increase.Supply won't be affected. The result is a rise in both price and quantity, as Figure4-12 shows.Figure 4-12Figure 4-13b. If a strike by steelworkers raises steel prices, the costs of producing a minivan rise(a rise in input prices), so the supply of minivans decreases. Demand won't beaffected. The result is a rise in the price of minivans and a decline in the quantity, as Figure 4-13 shows.c. The development of new automated machinery for the production of minivans isan improvement in technology. The reduction in firms' costs results in anincrease in supply. Demand isn't affected. The result is a decline in the price ofminivans and an increase in the quantity, as Figure 4-14 shows.Figure 4-14Figure 4-15d. The rise in the price of station wagons affects minivan demand because stationwagons are substitutes for minivans (that is, there's a rise in the price of a relatedgood). The result is an increase in demand for minivans. Supply isn't affected.In equilibrium, the price and quantity of minivans both rise, as Figure 4-12 shows.e. The reduction in peoples' wealth caused by a stock-market crash reduces theirincome, leading to a reduction in the demand for minivans, since minivans are anormal good. Supply isn’t affected. As a result, both price and quantity decline,as Figure 4-15 shows.4. Technological advances that reduce the cost of producing computer chips represent adecline in an input price for producing a computer. The result is a shift to the right in the supply of computers, as shown in Figure 4-16. The equilibrium price falls and theequilibrium quantity rises, as the figure shows.Figure 4-16Figure 4-17Since computer software is a complement to computers, the increased equilibrium quantity of computers increases the demand for software. As Figure 4-17 shows, the result is arise in both the equilibrium price and quantity of software.Since typewriters are substitutes for computers, the increased equilibrium quantity ofcomputers reduces the demand for typewriters. As Figure 4-18 shows, the result is adecline in both the equilibrium price and quantity of typewriters.Figure 4-185. a. When a hurricane in South Carolina damages the cotton crop, it raises input pricesfor producing sweatshirts. As a result, the supply of sweatshirts shifts to the left,as shown in Figure 4-19. The new equilibrium has a higher price and lowerquantity of sweatshirts.Figure 4-19b. A decline in the price of leather jackets leads more people to buy leather jackets,reducing the demand for sweatshirts. The result, shown in Figure 4-20, is adecline in both the equilibrium price and quantity of sweatshirts.Figure 4-20c. The effects of colleges requiring students to engage in morning calisthenics inappropriate attire raises the demand for sweatshirts, as shown in Figure 4-21.The result is an increase in both the equilibrium price and quantity of sweatshirts.Figure 4-21d. The invention of new knitting machines increases the supply of sweatshirts. AsFigure 4-22 shows, the result is a reduction in the equilibrium price and anincrease in the equilibrium quantity of sweatshirts.Figure 4-226. A temporarily high birth rate in the year 2005 leads to opposite effects on the price ofbabysitting services in the years 2010 and 2020. In the year 2010, there are more 5-year olds who need sitters, so the demand for babysitting services rises, as shown in Figure4-23. The result is a higher price for babysitting services in 2010. However, in the year2020, the increased number of 15-year olds shifts the supply of babysitting services to the right, as shown in Figure 4-24. The result is a decline in the price of babysitting services.Figure 4-23Figure 4-247. Since ketchup is a complement for hot dogs, when the price of hot dogs rises, the quantitydemanded of hot dogs falls, thus reducing the demand for ketchup, causing both price and quantity of ketchup to fall. Since the quantity of ketchup falls, the demand for tomatoes by ketchup producers falls, so both price and quantity of tomatoes fall. When the price of tomatoes falls, producers of tomato juice face lower input prices, so the supply curve for tomato juice shifts down, causing the price of tomato juice to fall and the quantity oftomato juice to rise. The fall in the price of tomato juice causes people to substitutetomato juice for orange juice, so the demand for orange juice declines, causing the price and quantity of orange juice to fall. Now you can see clearly why a rise in the price of hot dogs leads to a fall in price of orange juice!Figure 4-258. a. Cigars and chewing tobacco are substitutes for cigarettes, since a higher price forcigarettes would increase demand for cigars and chewing tobacco.b. An increase in the tax on cigarettes leads to increased demand for cigars andchewing tobacco. The result, as shown in Figure 4-25 for cigars, is a rise in boththe equilibrium price and quantity of cigars and chewing tobacco.c. The results in part (b) showed that a tax on cigarettes leads people to substitutecigars and chewing tobacco for cigarettes when the tax on cigarettes rises. Toreduce total tobacco usage, policymakers might also want to increase the tax oncigars and chewing tobacco, or pursue some type of public education program.9. Quantity supplied equals quantity demanded at a price of $6 and quantity of 81 pizzas (Figure4-26). If price were greater than $6, quantity supplied would exceed quantity demanded, so suppliers would reduce their price to gain sales. If price were less than $6, quantitydemanded would exceed quantity supplied, so suppliers could raise their price withoutlosing sales. In both cases, the price would continue to adjust until it reached $6, the only price at which there's neither surplus nor shortage.Figure 4-2610. a. If the price of flour falls, since flour is an ingredient in bagels, the supply curve forbagels would shift to the right. The result, shown in Figure 4-27, would be a fallin the price of bagels and a rise in the equilibrium quantity of bagels.Since cream cheese is a complement to bagels, the rise in quantity demanded ofbagels increases the demand for cream cheese, as shown in Figure 4-28. Theresult is a rise in both the equilibrium price and quantity of cream cheese. So, afall in the price of flour indeed raises both the equilibrium price of cream cheeseand the equilibrium quantity of bagels.Figure 4-27Figure 4-28What happens if the price of milk falls? Since milk is an ingredient in cream cheese, the fall in the price of milk leads to an increase in the supply of cream cheese. This leads to a decrease in the price of cream cheese (Figure 4-29), rather than a rise in the price of cream cheese. So a fall in the price of milkcouldn't have been responsible for the pattern observed.Figure 4-29Figure 4-30b. In part (a), we found that a fall in the price of flour led to a rise in the price ofcream cheese and a rise in the equilibrium quantity of bagels. If the price of flour rose, the opposite would be true; it would lead to a fall in the price of creamcheese and a fall in the equilibrium quantity of bagels. Since the question saysthe equilibrium price of cream cheese has risen, it couldn't have been caused by a rise in the price of flour.What happens if the price of milk rises? From part (a), we found that a fall in the price of milk caused a decline in the price of cream cheese, so a rise in the price ofmilk would cause a rise in the price of cream cheese. Since bagels and creamcheese are complements, the rise in the price of cream cheese would reduce thedemand for bagels, as Figure 4-30 shows. The result is a decline in theequilibrium quantity of bagels. So a rise in the price of milk does cause both arise in the price of cream cheese and a decline in the equilibrium quantity ofbagels.11. a. As Figure 4-31 shows, the supply curve is vertical. The constant supply makessense because the basketball arena has a fixed number of seats no matter whatthe price.Figure 4-31b. Quantity supplied equals quantity demanded at a price of $8. The equilibriumquantity is 8,000 tickets.c.The new equilibrium price will be $12, which equates quantity demanded toquantity supplied. The equilibrium quantity is 8,000 tickets.12. The executives are confusing changes in demand with changes in quantity demanded.Figure 4-32 shows the demand curve prior to the marketing campaign (D1), and after the campaign (D2). The marketing campaign increased the demand for champagne, asshown, leading to a higher equilibrium price and quantity. The influence of the higherprice on demand is already reflected in the outcome. It's impossible for the scenariooutlined by the executives to occur.Figure 4-32。