雅思写作 小作文五国开支
雅思写作task1范文

雅思写作task1范文The bar chart illustrates the amount of money spent on five consumer goods in a European country in 2018. Overall, it can be seen that the highest expenditure was on food and drink, followed by clothing and footwear. On the other hand, the least amount of money was spent on electronic goods.Food and drink had the highest expenditure, with a total of 250 billion euros. This was followed by clothing and footwear, which had an expenditure of 200 billion euros. In contrast, the least amount of money was spent on electronic goods, with only 50 billion euros.Looking at the individual items, it is evident that the highest expenditure was on groceries, with 150 billion euros spent. This was followed by dining out, with an expenditure of 100 billion euros. The least amount of money was spent on alcoholic drinks, with only 50 billion euros.In terms of clothing and footwear, it can be seen that the highest expenditure was on shoes, with 120 billion euros spent. This was followed by clothing, with an expenditure of 80 billion euros. The least amount of money was spent on accessories, with only 20 billion euros.In conclusion, the bar chart illustrates the expenditure on five consumer goods in a European country in 2018. Food and drink had the highest expenditure, while electronic goods had the least. Groceries and shoes were the items with the highest expenditure in their respective categories.。
五个国家政府卫生保健支出百分比雅思作文

五个国家政府卫生保健支出百分比雅思作文The provided bar chart presents a compelling comparison of healthcare expenditure as a percentage of GDP across five distinct nations: the United States, Japan, the United Kingdom, Italy, and Canada. The data paints a vivid picture of varying priorities and approaches to healthcare within these countries. TheUnited States stands out prominently with a staggering 17.1% of its GDP allocated to healthcare, a figure that dwarfs the other nations in the comparison. This substantial investment reflects the complex and often criticized nature of the American healthcare system, characterized by private insurance, highadministrative costs, and advanced medical technology. While this spending ensures access to cutting-edge treatments and a wide range of medical services, it also raises concerns about affordability and accessibility for all citizens. In contrast, Japan demonstrates a more balanced approach, dedicating 10.9% of its GDP to healthcare. The Japanese system is renowned for its universal coverage and emphasis on preventive care, contributing to the nation's impressive health outcomes and longevity. This model suggests that significant health improvements can be achieved without the exorbitant spending observed in the US. The United Kingdom, with 9.8% of its GDP directed towards healthcare, exemplifies a publicly funded National Health Service (NHS) model. The NHS provides universal healthcare access, ensuring that essential medical services are available to all residents regardless of their financial circumstances. While lauded for its equity and comprehensiveness, the NHS also faces challenges related to wait times andresource constraints. Italy and Canada follow closely behind with healthcare expenditures representing 9.2% and 10.7% of their respective GDPs. Both nations embrace universal healthcare systems, highlighting their commitment to providing accessible and affordable medical services to their populations. However,variations exist in their specific models and funding mechanisms. The stark disparities in healthcare spending among these nations raise crucial questions about the optimal balance between cost, quality, and accessibility. While the US model offers advanced treatments and a diverse range of options, it also grapples with issues of affordability and inequality. Conversely, the other nations demonstrate that universal healthcare systems can deliver favorable healthoutcomes without incurring the same level of financial burden. Ultimately, the ideal approach to healthcare remains a subject of ongoing debate, with each country navigating its unique set of challenges and priorities.。
雅思写作小作文范文 雅思写作柱状图bar chart 六种商品的花费.doc
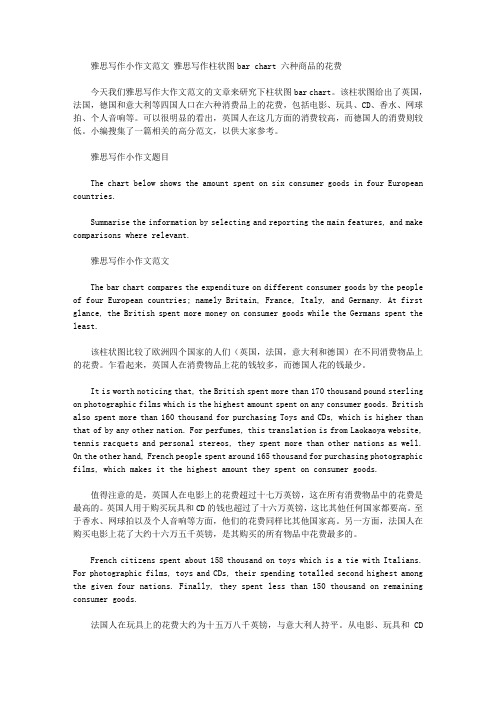
雅思写作小作文范文雅思写作柱状图bar chart 六种商品的花费今天我们雅思写作大作文范文的文章来研究下柱状图bar chart。
该柱状图给出了英国,法国,德国和意大利等四国人口在六种消费品上的花费,包括电影、玩具、CD、香水、网球拍、个人音响等。
可以很明显的看出,英国人在这几方面的消费较高,而德国人的消费则较低。
小编搜集了一篇相关的高分范文,以供大家参考。
雅思写作小作文题目The chart below shows the amount spent on six consumer goods in four European countries.Summarise the information by selecting and reporting the main features, and make comparisons where relevant.雅思写作小作文范文The bar chart compares the expenditure on different consumer goods by the people of four European countries; namely Britain, France, Italy, and Germany. At first glance, the British spent more money on consumer goods while the Germans spent the least.该柱状图比较了欧洲四个国家的人们(英国,法国,意大利和德国)在不同消费物品上的花费。
乍看起来,英国人在消费物品上花的钱较多,而德国人花的钱最少。
It is worth noticing that, the British spent more than 170 thousand pound sterling on photographic films which is the highest amount spent on any consumer goods. British also spent more than 160 thousand for purchasing Toys and CDs, which is higher than that of by any other nation. For perfumes, this translation is from Laokaoya website, tennis racquets and personal stereos, they spent more than other nations as well. On the other hand, French people spent around 165 thousand for purchasing photographic films, which makes it the highest amount they spent on consumer goods.值得注意的是,英国人在电影上的花费超过十七万英镑,这在所有消费物品中的花费是最高的。
雅思写作小作文范文 雅思写作柱状图bar chart 日常花费.doc

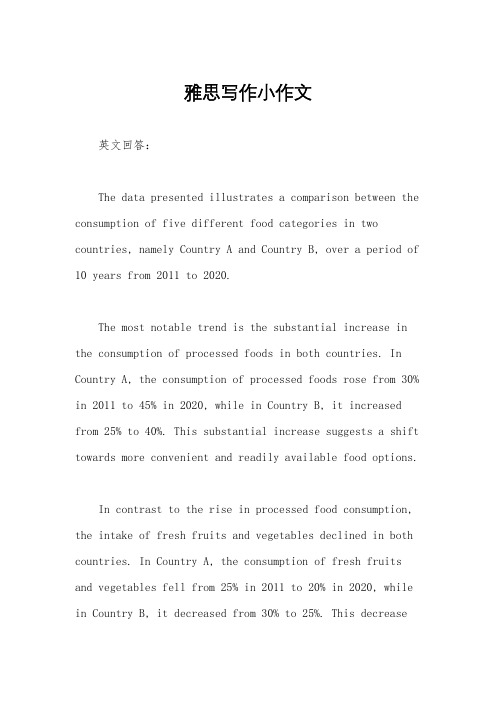
雅思写作小作文范文雅思写作柱状图bar chart 日常花费今天我们雅思写作小作文范文的文章来研究下柱状图bar chart。
该图表共显示了4个国家,分别为德国、意大利、法国和英国,以及这些国家的民众在音响、网球拍、香水、CD、玩具和电影方面的花费。
因为图中数据较多(共有24个),如果每条数据都详细描述的话,无论是时间和篇幅都不够用。
因此小编搜集了一篇相应的考官范文,以供大家参考。
雅思写作小作文题目雅思写作小作文范文The bar chart compares consumer spending on six different items in Germany, Italy, France and Britain.柱状图比较了德国、意大利、法国和英国的消费者在六种不同物品上的花费。
It is clear that British people spent significantly more money than people in the other three countries on all six goods. Of the six items, consumers spent the most money on photographic film.很明显,英国民众在所有六种物品上都明显花费比其他三个国家民众更多的金钱。
在六种物品中,消费者在电影上花费的金钱最多。
People in Britain spent just over £170,000 on photographic film, which is the highest figure shown on the chart. By contrast, Germans were the lowest overall spenders, with roughly the same figures (just under £150,000) for each of the six products.英国民众在电影上的花费超过170000英镑。
雅思写作小作文
雅思写作小作文英文回答:The data presented illustrates a comparison between the consumption of five different food categories in two countries, namely Country A and Country B, over a period of 10 years from 2011 to 2020.The most notable trend is the substantial increase in the consumption of processed foods in both countries. In Country A, the consumption of processed foods rose from 30% in 2011 to 45% in 2020, while in Country B, it increased from 25% to 40%. This substantial increase suggests a shift towards more convenient and readily available food options.In contrast to the rise in processed food consumption, the intake of fresh fruits and vegetables declined in both countries. In Country A, the consumption of fresh fruits and vegetables fell from 25% in 2011 to 20% in 2020, while in Country B, it decreased from 30% to 25%. This decreasemay be attributed to factors such as limited accessibility, affordability, or changes in dietary preferences.The consumption of dairy products remained relatively stable in Country A, with a slight increase from 20% in 2011 to 22% in 2020. However, Country B experienced a noticeable decline in dairy consumption, dropping from 25% in 2011 to 20% in 2020. This decrease could be due to changing dietary habits or increased awareness of lactose intolerance.The consumption of meat and poultry showed a moderate increase in both countries. In Country A, the intake of meat and poultry rose from 25% in 2011 to 30% in 2020, while in Country B, it increased from 20% to 25%. This increase may be driven by the perception of meat as a symbol of affluence or a desire for higher protein intake.Overall, the data reveals significant changes in food consumption patterns over the past decade. The rise in processed food consumption and decline in fresh fruit and vegetable intake are particularly concerning, as they haveimplications for public health and nutrition. Understanding these trends can inform policy interventions aimed at promoting healthier eating habits.中文回答:数据分析:图表显示,在 2011 年至 2020 年的 10 年间,国家 A 和国家B 中五种不同食品类别的消费情况进行了比较。
英语小作文5个国家花费;turkey;

英语小作文5个国家花费;turkey;The table compares the expenditure of consumers on three categories in five different countries in 2002.Consumer spending on food/drinks/tobacco was the highest in Turkey (32.14%), followed by that in Ireland (28.91%). Figures for Italy, Spain, and Sweden varied from a low of 15% to a high of 20%.In terms of the second item, Italy had the largest consumer spending on clothing and footwear (9%), as opposed to only 5.4% in Sweden. Figures for Ireland, Spain and Turkey were similar: 6.43%,6.51% and 6.63% separately.In the case of the third category, 4.35% of consumer expenditure was spent on leisure and education in Turkey, about twice as much as that in Ireland(2.21%).Similar consumer spending on this field was seen in Italy and Sweden:3.2% and 3.22% respectively.Overall, the largest proportion of consumer expenditure in each country was at food, drinks and tobacco; as to leisure and education, the reverse was the case.2)similar newspaper sales per 1000 people were seen in Argentina and Surinam as well as Cuba: 123 and 122 and 118 pieces(papers)separately(respectively).You said separately should be changed to respectively. I wonder if separately is not correct, is there any other words can replace respectively?respectively is appropriate as you are listing the figures, so by saying this, you are making it clear that the first figure relates to Argentina and Suriname and the second figure is for Cuba. This really is the best term to use in this context. If you would like to rephrase the sentence, you could say "Argentina and Surinam had 123 newspaper sales, whereas Cuba only had 122.。
【推荐】雅思写作经典范文:图表范文(消费额度差异)-精选word文档 (1页)
【推荐】雅思写作经典范文:图表范文(消费额度差异)-精选word文档本文部分内容来自网络整理,本司不为其真实性负责,如有异议或侵权请及时联系,本司将立即删除!== 本文为word格式,下载后可方便编辑和修改! ==雅思写作经典范文:图表范文(消费额度差异)The chart below shows the amount of money spent on six consumer goods in four European countries .Write a report for a university lecturer describing the information shown below .本图比较了德国、意大利、法国与英国在6种消费品上的消费额度差异。
This chart compares the amount of money spent on six consumer goods in Germany , Italy , France and Britain .从图上可以看到,英国人在所有六种消费品上的花费都比任何其他国家人们的支出高。
在音响、网球拍和香水这三种物品上,意大利排名第二,之后是德国和法国。
在音乐光盘、玩具和摄影方面的消费排序依次是:英、法、意、德。
As we can see from the chart , British people spend more money on all the six above - mentioned consumer goods than people from any other country do . So far as the expenditure on personal stereos , tennis racquets and perfumes is concerned , Italy ranks No . 2, followed by Germany and France . When it comes to CDs , toys , and photographic film , the ranking order of the four countries are : Britain , France , Italy , and Germany .首先,英国人在音响、网球拍和香水上的花费分别达到了15.5万、15.5万和17.2万英镑,比排名第二的意大利分别高出约0.5万英镑和0.2万英镑。
雅思写作-小作文范文-条图
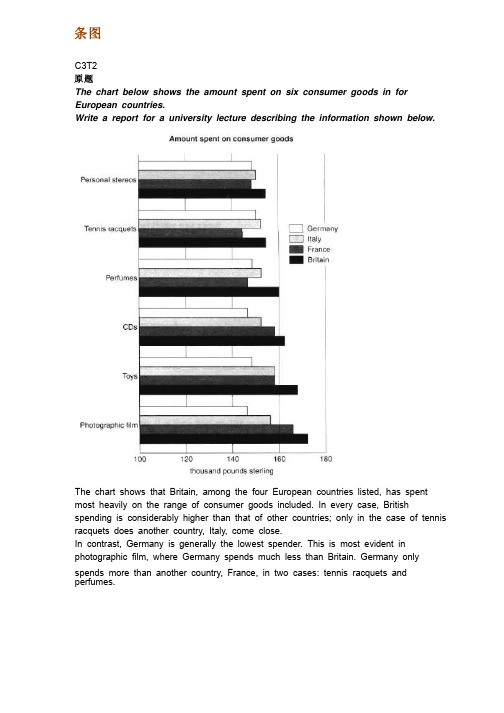
条图C3T2 原题The chart below shows the amount spent on six consumer goods in for European countries.Write a report for a university lecture describing the information shown below.The chart shows that Britain, among the four European countries listed, has spent most heavily on the range of consumer goods included. In every case, British spending is considerably higher than that of other countries; only in the case of tennis racquets does another country, Italy, come close. In contrast, Germany is generally the lowest spender. This is most evident in photographic film, where Germany spends much less than Britain. Germany only spends more than another country, France, in two cases: tennis racquets and perfumes. Meanwhile, France and Italy generally maintain middle positions, averaging approximately similar spending overall. Specifically, France spends more on CDs and photographic film but less on tennis racquets than Italy does. Italy’s spending on personal stereos is only marginally greater than that of France, while spending on toys is equal between the two. It is clear from the data given that there are some significant differences in spending habits within Europe. 分析:题目The chart below shows the amount spent on six consumer goods in four European countries.一般题目都会将图形的X1, X2, Y轴的几个变量表示出来,如此处X1轴six consumer goods; X2轴European countries; Y轴the amount 第一段The chart shows that Britain, among the four European countries listed, has spent most heavily on the range of consumer goods included.点明了英国消费冠军的地位点明了英国消费冠军的地位the range of consumer goods 其中的the range of 表示表示“一系列的”,由于雅思小作文经常出现多个物品或人群的比较,所以这个表达很有用作文经常出现多个物品或人群的比较,所以这个表达很有用the four countries listed; consumer goods included其中的listed, included为过去分词作后置定语,但是这两个词是充数的,没有也无妨,不过这两个词雅思图表经常用到表经常用到In every case, British spending is considerably higher than that of other countries; only in the case of tennis racquets does another country, Italy, come close.具体到6种消费品,只是这个地方的描述和图形不太精确,仔细看看,应当是stereos 和法国与德国齐平,tennis racquets越高于意大利,当然用come close是正确的。
- 1、下载文档前请自行甄别文档内容的完整性,平台不提供额外的编辑、内容补充、找答案等附加服务。
- 2、"仅部分预览"的文档,不可在线预览部分如存在完整性等问题,可反馈申请退款(可完整预览的文档不适用该条件!)。
- 3、如文档侵犯您的权益,请联系客服反馈,我们会尽快为您处理(人工客服工作时间:9:00-18:30)。
雅思写作小作文五国开支
英文回答:
The provided table presents the government expenditure of five countries in the following sectors: education, healthcare, defense, infrastructure, and social welfare. While the figures vary across countries, certain trends are evident.
Education receives the highest share of funding in all countries except for Country D, where it is surpassed by defense. Country E allocates the largest proportion of its budget to education, at 25%. In contrast, Country A spends the least on education, at only 17%.
Healthcare expenditure is relatively high in Country B and Country C, where it accounts for 21% and 22% of government spending, respectively. Country A and Country D dedicate a smaller portion of their budgets to healthcare, at 15% and 18%. Country E invests the least in healthcare,
with only 11% of its budget allocated to this sector.
Defense spending is a significant expense for Country D, which devotes 25% of its budget to this area. Country A
also spends a considerable amount on defense, at 20%. The remaining countries spend less on defense, with Country E allocating the least, at 12%.
Infrastructure development receives varying levels of funding across the countries. Country C and Country D
invest heavily in infrastructure, with 22% and 24% of their budgets allocated to this sector, respectively. Country A and Country B allocate a more modest share of their budgets to infrastructure, at 17% and 18%. Country E spends the
least on infrastructure, at only 14%.
Social welfare programs are funded to different degrees in the five countries. Country B and Country E provide the most generous social welfare support, with 24% and 25% of their budgets allocated to this sector, respectively. Country A and Country D allocate a smaller portion of their budgets to social welfare, at 19% and 18%. Country C spends
the least on social welfare, with only 16% of its budget dedicated to this area.
In summary, the table reveals that education, healthcare, defense, infrastructure, and social welfare receive varying levels of government expenditure across the five countries. While some countries prioritize certain sectors, others allocate their resources differently, reflecting their unique needs and circumstances.
中文回答:
给定表格展示了五国的政府支出,涉及领域包括,教育、医疗、国防、基础设施和社会福利。
尽管各个国家的数据不尽相同,但仍
有明显趋势。
除了国家 D(国防支出高于教育支出)以外,所有国家都将教
育支出作为资金分配的重中之重。
国家 E 将其预算最大份额(25%)分配给教育。
相比之下,国家 A 在教育方面的支出最少,仅有 17%。
医疗支出在国家 B 和国家 C 相对较高,分别占政府支出的 21% 和 22%。
国家 A 和国家 D 将较小一部分预算(15% 和 18%)用于
医疗。
国家 E 对医疗的投资最少,仅将其预算的 11% 分配给该领域。
国防支出是国家 D 的一大开支,该国将其预算的 25% 用在了
此领域。
国家 A 也在国防上花费了巨资,占 20%。
其余国家在国防
上花的钱较少,国家 E 分配的钱最少,仅为 12%。
基础设施建设在不同国家获得了不同程度的资金。
国家 C 和国
家 D 在基础设施上投入巨资,分别将其预算的 22% 和 24% 分配给
了该领域。
国家 A 和国家 B 在基础设施上分配的预算份额较小,
分别为 17% 和 18%。
国家 E 在基础设施上的支出最少,仅为 14%。
社会福利计划在五国获得了不同程度的资助。
国家 B 和国家 E 提供的社会福利支持最为慷慨,分别将其预算的 24% 和 25% 分配
给了该领域。
国家 A 和国家 D 将较小一部分预算(19% 和 18%)
分配给了社会福利。
国家 C 在社会福利上花的钱最少,仅将其预算
的 16% 用于此领域。
综上所述,表格显示,教育、医疗、国防、基础设施和社会福
利在这五个国家获得的政府支出水平各不相同。
虽然一些国家优先
考虑某些领域,但其他国家则以不同的方式分配资源,这反映了它
们的独特需求和情况。