2021雅思小作文-表格Table攻略及范文汇总
(完整版)剑桥雅思小作文表格及其他类的写法归纳
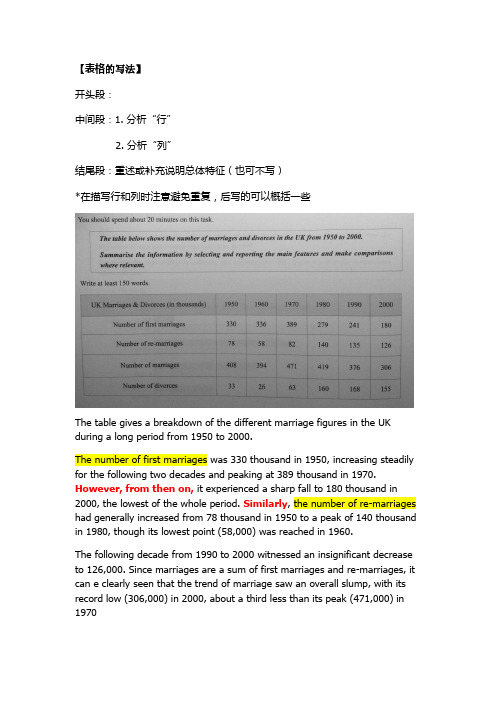
【表格的写法】开头段:中间段:1. 分析“行”2. 分析“列”结尾段:重述或补充说明总体特征(也可不写)*在描写行和列时注意避免重复,后写的可以概括一些The table gives a breakdown of the different marriage figures in the UK during a long period from 1950 to 2000.The number of first marriages was 330 thousand in 1950, increasing steadily for the following two decades and peaking at 389 thousand in 1970. However, from then on, it experienced a sharp fall to 180 thousand in 2000, the lowest of the whole period. Similarly, the number of re-marriages had generally increased from 78 thousand in 1950 to a peak of 140 thousand in 1980, though its lowest point (58,000) was reached in 1960.The following decade from 1990 to 2000 witnessed an insignificant decrease to 126,000. Since marriages are a sum of first marriages and re-marriages, it can e clearly seen that the trend of marriage saw an overall slump, with its record low (306,000) in 2000, about a third less than its peak (471,000) in 1970In contrast to the general downward trend of marriages, divorces had nearly tripled from 33 thousand in 1950 to 168 thousand in 1990. Despite a slight decline, the year 2000 also witnessed a high of 155 thousand.Generally speaking, the number of marriages has been descending, or even plummeted in the last decades whereas that of divorces soared surprisingly by four times.【饼图的写法】对饼状图数据进行分析之后,可将题目分为有时间跨度的动态图,和没有时间跨度的静态对比图。
雅思写作小作文表格题参考范文
雅思写作小作文表格题参考范文表格题的写作大家接触的比较少,可能写不好,但是一定要多练习。
因为这可是雅思小作文的常考类型之一。
下面,小编为大家提供两篇雅思写作小作文表格题参考范文,希望对大家有用。
雅思写作小作文表格题参考范文一话题:The table below shows the amount of waste production (in millions of tonnes) in six different countries over a twenty-year period.参考范文:The chart compares the amounts of waste that were produced in sixcountries in the years 1980, 1990 and 2000.In each of these years, the US produced more waste than Ireland, Japan, Korea, Poland and Portugal combined. It is also noticeable that Korea was the only country that managed to reduce its waste output by the year 2000.Between 1980 and 2000, waste production in the US rose from 131 to 192 million tonnes, and rising trends were also seen in Japan, Poland and Portugal. Japan’s waste output increased from 28 to 53 million tonnes, while Poland and Portugal saw waste totals increase from 4 to 6.6 and from 2 to 5 million tonnes respectively.The trends for Ireland and Korea were noticeably different from those described above. In Ireland, waste production increased more than eightfold, from only 0.6 million tonnes in 1980 to 5 million tonnes in 2000. Korea, by contrast, cut its waste output by 12 million tonnes between 1990 and 2000.雅思写作小作文表格题参考范文二话题:The table below shows changes in the numbers of residents cycling to work in different areas of the UK between 2001 and 2011.参考范文:The table compares the numbers of people who cycled to work in twelve areas of the UK in the years 2001 and 2011.Overall, the number of UK commuters who travelled to work by bicycle rose considerably over the 10-year period. Inner London had by far the highest number of cycling commuters in both years.In 2001, well over 43 thousand residents of inner London commuted by bicycle, and this figure rose to more than 106 thousand in 2011, an increase of 144%. By contrast, although outer London had the second highest number of cycling commuters in each year, the percentage change, at only 45%, was the lowest of the twelve areas shown in the table.Brighton and Hove saw the second biggest increase (109%) in the number of residents cycling to work, but Bristol was the UK’s second city in terms of total numbers of cycling commuters, with 8,108 in 2001 and 15,768 in 2011. Figures for the other eight areas were below the 10 thousand mark in both years.。
雅思表格图表题范文
雅思表格图表题范文雅思考试中,表格图表题是常见的题型之一。
这类题目要求考生根据给出的表格或图表,回答相关问题。
在这篇文章中,我们将提供一些雅思表格图表题的范文,帮助考生更好地理解和应对这类题目。
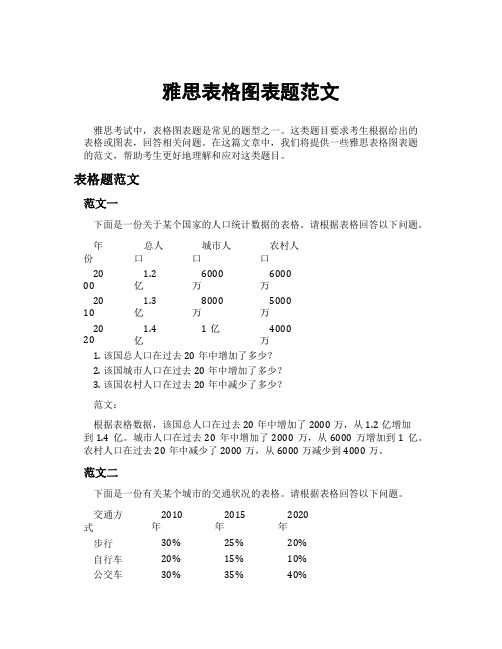
表格题范文范文一下面是一份关于某个国家的人口统计数据的表格。
请根据表格回答以下问题。
年份总人口城市人口农村人口20 001.2亿6000万6000万20 101.3亿8000万5000万20 201.4亿1亿4000万1.该国总人口在过去20年中增加了多少?2.该国城市人口在过去20年中增加了多少?3.该国农村人口在过去20年中减少了多少?范文:根据表格数据,该国总人口在过去20年中增加了2000万,从1.2亿增加到1.4亿。
城市人口在过去20年中增加了2000万,从6000万增加到1亿。
农村人口在过去20年中减少了2000万,从6000万减少到4000万。
范文二下面是一份有关某个城市的交通状况的表格。
请根据表格回答以下问题。
交通方式2010年2015年2020年步行30% 25% 20% 自行车20% 15% 10% 公交车30% 35% 40%交通方式2010年2015年2020年私家车20% 25% 30%1.该城市步行和自行车的使用率在过去10年中分别下降了多少?2.该城市公交车和私家车的使用率在过去10年中分别增加了多少?范文:根据表格数据,该城市步行的使用率在过去10年中下降了10%,从30%下降到20%。
自行车的使用率在过去10年中下降了10%,从20%下降到10%。
公交车的使用率在过去10年中增加了10%,从30%增加到40%。
私家车的使用率在过去10年中增加了10%,从20%增加到30%。
图表题范文范文一下面是一张有关某个城市空气质量的折线图。
请根据图表回答以下问题。
空气质量折线图空气质量折线图1.该城市哪个季节的空气质量最好?2.该城市空气质量在过去一年中有没有出现恶化的趋势?范文:根据折线图数据,该城市春季的空气质量最好,PM2.5浓度约为30。
作文范文之雅思小作文table

作文范文之雅思小作文table雅思小作文table【篇一:雅思小作文表格图实例分析】雅思小作文表格图实例分析朗阁海外考试研究中心表格图是雅思小作文的常考图形之一,也是烤鸭们在备考时必须要准备的一类题型。
那么烤鸭们具体应该如何准备表格图呢?下面,朗阁海外考试研究中心的专家将以一道具体的实例,就这一题型的解题思路和步骤做出详尽的分析和解答。
the table below shows personal savings as a percentage of personal income for selected countries in 1989, 1999 and 2009. personal savings as a percentage of personal income一、审题,决定大体写作方式首先,读题目,了解到这幅表格图是关于“几个国家的人民个人收入中存款的百分比”以及三个时间点(据此,正文部分描述存款率是时态基调为过去时)。
表格上方的title和题目表述一样,没有额外信息,因此,读一遍即可。
然后,审具体表格,决定大致写作方向和方式,即分段方式。
表格的审图需要注意以下几个方面:横轴,纵轴和总体数据特征。
此图中的横纵轴分别是时间和7个研究对象——7个国家。
横纵轴中间有一栏为时间,那说明,此图原则上应该按曲线图原理来写——即,描述7个国家存款率上升或下降趋势;但是,经过下一步对表格中数据总体特征的总结发现:7个国家的存款率在这一段时间内总体呈现下降趋势。
这一发现说明,如果继续按照曲线图原理描述,文章会非常单调,而且对比的空间也不大;相反,同一年份里,几个国家之间的差距很大。
因此,正文部分应该按时间分成三个段落,对比同一时间内,7个国家之间的存款率的高低。
最后,审题的最后一关是总结表格中数据的明显特征。
正文主要是从时间角度,纵向对比几个国家。
但是,我们同时也需要反方向观察和对比,也就是,几个国家内部不同时间内存款率的起伏。
雅思英语图表作文范文(必备3篇)

雅思英语图表作文范文第1篇A类雅思各类图表作文要点及范文一.曲线图解题关键1曲线图和柱状图都是动态图,解题的切入点在于描述趋势。
2在第二段的开头部分对整个曲线进行一个阶段式的总分类,使写作层次清晰,同时也方便考官阅卷。
接下来再分类描述每个阶段的specifictrend,同时导入数据作为分类的依据。
3趋势说明。
即,对曲线的连续变化进行说明,如上升、下降、波动、持平。
以时间为比较基础的应抓住“变化”:上升、下降、或是波动。
题中对两个或两个以上的变量进行描述时应在此基础上进行比较,如变量多于两个应进行分类或有侧重的比较。
4极点说明。
即对图表中最高的、最低的点单独进行说明。
不以时间为比较基础的应注意对极点的描述。
5交点说明。
即对图表当中多根曲线的交点进行对比说明。
6不要不做任何说明就机械地导入数据,这不符合雅思的考试目的。
曲线图常用词汇动词—九大运动趋势一:表示向上:increase,rise,improve,grow,ascend,mount,aggrandize,goup,climb, take off, jump,shoot up暴涨,soar,rocket, skyrocket雅思英语图表作文范文第2篇It is said that countries are becoming similar to each other because of the global spread of the same products, which are now available for purchase almost anywhere. I strongly believe that this modern development is largely detrimental to culture and traditions worldwide.A country’s history, language and ethos are all inextricably bound up in its manufactured artefacts. If the relentless advance of international brands into every corner of the world continues, these bland packages might one day completely oust the traditional objects of a nation, which would be a loss of richness and diversity in the world, as well as the sad disappearance of t he manifestations of a place’s character. What would a Japanese tea ceremony be without its specially crafted teapot, or a Fijian kava ritual without its bowl made from a certain type of tree bark?Let us not forget either that traditional products, whether these be medicines, cosmetics, toy, clothes, utensils or food, provide employment for local people. The spread of multinational products can often bring in its wake a loss of jobs, as people urn to buying the new brand,perhaps thinking it more glamorous than the one they are used to. This eventually puts old-school craftspeople out of work.Finally, tourism numbers may also be affected, as travelers become disillusioned with finding every place just the same as the one they visited previously. To see the same products in shops the world over is boring, and does not impel visitors to open their wallets in the same way that trinkets or souvenirs unique to the particular area too.Some may argue that all people are entitled to have access to the same products, but I say that local objects suit local conditions best, and that faceless uniformity worldwide is an unwelcome and dreary prospect.Heres my full answer:The line graphs show the average monthly amount that parents in Britain spent on their children’s s porting activities and the number of British children who took part in three different sports from 2008 to is clear that parents spent more money each year on their children’s participation in sports over the six-year period. In terms of the number of children taking part, football was significantly more popular than athletics and 2008, British parents spent an average of around £20 per month on their children’s sporting activities. Parents’ spending on children’s sports increased gradually over the followi ng six years, and by 2014 the average monthly amount had risen to just over £ at participation numbers, in 2008 approximately 8 million British children played football, while only 2 million children were enrolled in swimming clubs and less than 1 million practised athletics. The figures for football participation remained relatively stable over the following 6 years. By contrast, participation in swimming almost doubled, to nearly 4 million children, and there was a near fivefold increase in the number of children doing athletics.剑桥雅思6test1大作文范文,剑桥雅思6test1大作文task2高分范文+真题答案实感。
雅思写作-小作文范文-表格

雅思小作文表格题写作技巧雅思小作文中,表格题是经常出现的一种,也是相对比较简单的一种。
那么雅思小作文表格题有哪些写作技巧呢?下面为大家整理了一种,供大家参考,希望大家能够得到帮助。
雅思小作文表格题其实分为两种情况,所以小作文表格题的写作技巧也就分成了两种。
雅思小作文表格题的第一种情况是其他图的改写,一般为曲线和柱状图,当然还有饼图题。
得剑桥系列上有一个小作文的题,就是表格题,但是里面的内容其实就是变相的柱状图,写的是两个年年代的里的各种旅行的交通工具的受欢迎程度的变化,一般来说,如果遇到这种题的话,大家应该会毫不犹豫地选择直接把数据一写,这不是不对,但是就落入下乘了,同时大家可以看看范文,看范文是怎么写的,没错,范文描绘的对象并不仅仅是表格里的数据,更多的是每种交通工具的变化的大小,幅度最大最小的那几个数据。
由此,我们可以得到这种表格题的解题方法。
1.先做出简单的四则运算,算出变化的大小。
2.排列这些大小,挑出最具代表性的对象。
3.以这些对象来写。
雅思小作文表格题第二种情况就是正儿八经的表格题,这类表格题没啥好说,直接写,也就是按照一个顺序把时间和内容交代清楚,但是记住是一个顺序,不要多个顺序,否则是写不出东西来的。
以上就是雅思小作文表格题的写作技巧的全部内容,大家可以按照上面的技巧在自己的雅思写作中予以应用,这样就可以更加提高大家的写作效率了。
关于雅思小作文-表格的答疑问题:现在有一类table对我来说是非常难的,这类table题的特点是纵列提供无关联的并且分类信息,横向几列信息有一定关联(也就是某事物的几个方面的特征),但是相互关系不那么明显,正是地铁和澳洲用水这种图。
我不容易找到重点,哪怕思考这图的用意也很难看出要侧重在哪方面,到现在我对地铁那个图的理解都不是很到位,我看您的思路很有道理,但是换成我自己再看的话,我还是找不到切入点。
不知道李老师有什么好建议?回复:关于切入点的问题,我始终认为就是在第一时间内给出这张表潜在阅读者最想要的信息。
雅思写作小作文范文 雅思写作表格题table 耐用消费品情况.doc

雅思写作小作文范文雅思写作表格题table 耐用消费品情况今天我们雅思写作小作文范文的文章来研究下表格题table。
该图表给出了1972年到1983年之间,英国居民使用各种电器的数据。
具体条目包括中央暖气,电视,食品,吸尘器,冰箱,洗碗机,洗衣机,电话等。
其中出现的数据众多,我们可以根据多和少,或者增长和降低来分类,并且挑选最高点和最低点来进行重点说明。
小编搜集了一篇相关的高分范文,以供大家参考。
雅思写作小作文题目The table below shows the consumer durables (telephone, refrigerator, etc.) owned in Britain from 1972 to 1983.Summarise the information by selecting and reporting the main features, and make comparisons where relevant.雅思写作小作文范文The given table compares eight different consumer products possessed by the British between 1972 and 1983. As a whole, television was the most common item they were using during this period, while dishwasher, which was introduced in 1978, was the least popular durable product in the UK.上述表格比较了1972年到1983年之间英国居民所拥有的8种消费产品。
整体来看,电视机是他们在此期间最经常使用的物品。
而1978年才引入的洗碗机,是英国最不受欢迎的消费耐用品。
雅思小作文表格题技巧

雅思小作文表格题技巧雅思小作文表格题技巧:①表格上的每一项是根据评分标准给出的1分到5分。
所有内容都要用数字、图片和表格呈现,绝不能只写文章本身。
因为表格更具逻辑性,且可以展示一定程度的思维过程。
所以从评分角度看,表格优于段落。
所以我们在做小作文时,尽量选择有图或者有文字说明的段落来练习。
这样既保证了内容的丰富多彩又提高了自己的书面语言组织能力。
如果你觉得自己实在没什么词汇储备,那就直接写段落吧!但是切记,千万别空着,也许你会发现,你已经把段落里该填充的东西全部填满了呢?②通过对比两个段落的首句,找出其中的相同点与不同点。
例如下面这篇文章: The first sentence of the paragraph was as follows:“ In many ways” and then came to a conclusion that it is not true. But what does this mean by saying there are no more good ideas about doing things in their own way or howto make them better than others’ ones (for example)? A study suggests one thing but another can be found out from these two sentences which point different points on our understandings towards people who have been criticized because they do something differently when other people did otherwise( suchas).I think you should also find some examples below- like‘ One's style/ personality differed with his family… etc— so we know why someone has become famous after being praised at all time while others continue getting worse; You may say he had done wrong however given him an opportunity to change himself, eventually will surely improve themselves; He might still believe everything else though if only she could understand her feelings before making up herself again And just look around yourself!。
- 1、下载文档前请自行甄别文档内容的完整性,平台不提供额外的编辑、内容补充、找答案等附加服务。
- 2、"仅部分预览"的文档,不可在线预览部分如存在完整性等问题,可反馈申请退款(可完整预览的文档不适用该条件!)。
- 3、如文档侵犯您的权益,请联系客服反馈,我们会尽快为您处理(人工客服工作时间:9:00-18:30)。
表格题写作要点:1表格与饼图一样,都是静态图。
切入点在描述分配;2表格题考查列举数字的能力和方法。
通过举一些有代表性的数据来说明问题;3横向比较。
介绍横向各个数据的区别、变化和趋势;4纵向比较。
介绍纵向各个数据的区别、变化和趋势;5不需要将每一个数据分别说明,突出强调数据最大值和最小值;6对比时要总结出数据对比最悬殊的和最小的。
表格类作文常用词汇noticeable trend 明显趋势pronounced adj. 明显的significant changes一些较大变化rank n. vt. vi. 列为,排列,等级distribute vt. 分布,区别unequally adv. 不平等地average n.vt.vi.adj.corresponding adj. 相应的,通讯的represent vt. 阐述,表现overall adj.in the case of adv. 在...的情况下in terms of / in respect of / regarding 在...方面.5.2 表格描述比例1) _____ accounts for (takes up) 20%of all. _____占总数的20%。
2) On the top of the list is _____, which accounts for 70%.比例最高的是_____,占70%。
3) At the bottom of the list is _____,which takes up 20%only.比例最低的是_____,仅占20%。
4) A ranks first,followed by B at 20%and C at 15%.A占比例最大,其次是B 占20%及C占15%。
5) The figure reached the highest/lowest point in _____. 数据在_____时候达到最高点(最低点)。
描述对比1) A has almost (nearly/about) over a quarter (half/twice/one third) as many students as (as much money as) B. A的学生数/钱(差不多)是B的四分之一/一半/两倍/三分之一/一样。
2) A has about (approximately/exactly/precisely) the same number (proportion/amount) of students (money) as B.A和B的学生/钱/数量/比例差不多/正好一样。
3) A has something in common with B. A与B有一些共同点。
4) The difference between A and B lies in _____. A与B的不同之处在于_____。
描述趋势1) The number increased (/rose)suddenly (dramatically/rapidly/substantially/considerably/sharply)from _____ to _____.数量从_____激增到_____。
2) During 1990 to 2000,there was a sudden (rapid/dramatic/substantial /sharp/considerable)rise (boom)in the number of private cars from _____ to _____. 1990年到2000年间,私人汽车的数量从_____急剧增长到_____。
3) The ten years from 1990 to 2000 witnessed (/saw)a steady growth of private cars from _____ to _____. 1990年到2000年10年间,私人汽车的数量从_____稳步增长到_____。
4) The number of private cars increased (rose / fell/dropped/declined/decreased) by 20%.私人汽车数量增长了(或:降低了)20%。
5) The number of private cars in 2000 was 5 times more than that in 1990.2000年私人汽车数量是1990年的5倍。
6) The number of private cars roughly (/approximately) doubled (tripled) between 1990 and 2000.1990年到2000年间,私人汽车数量大约是原来的2倍(3倍)。
表格模板The table shows _____. (简要介绍表中呈现的信息。
)According to the figures,as people age in Someland, their social lives reduce.Teenagers and people in their twenties _____. People in their 30s,40s,50s and 60s _____.(general statement,点明从数据中概括得出的一种趋势。
) Group and individual exercise follow a similar pattern.People of all ages spend a good part of their leisure time on entertainment. Teenagers and retiredpeople _____. For everybody else, _____.(general statement,点明从数据中概括得出的另一种趋势。
)Consequently,it can be concluded that there is a significant trend towards_____.例文-1You should spend about 20 minutes on this task.The table below give information about Favorite Pastimes in different countries.Summarise the information by selecting and reporting the main features, and make comparisons where relevant. Write at least 150 words.This table clearly presents and compares favorable pastimes in eight different countries. The pastimes, across the top of the table, are analyzed in relation to each country.As can be seen, about 60% of Canadians, Australians and Americans like watching television. On the other hand, this figure is quite low for China where only 15% of people watch television. Predictably, Americans like music at 23%, whereas only 2 to 5% of people in the other countries feel the same way. 20% of people inEngland enjoy sleeping as a pastime whereas in Canada and the USA, for example, the figure is only 2%. Interestingly, the Chinese like hobbies the most at 50%, as opposed to only 20% in France. It isn’t surprisi ng that the highest percentage of beach-lovers is in Australia and the USA at 30%.It seems that pastimes of people of different nationalities may be influenced by a number of factors such as the socio-economic situation or the climate. These factors influence cultural differences between different nationalities and make cross-cultural experiences more interesting.类别对比型(category-comparison)的写法与表达方式这种类型的考题首先要分类(category),然后对比(comparison)。
对比不同类别之间的相同点与不同点,或者最高值与最低值,并根据数据对比的结果总结所要描述的内容。
以表格题(table)为例:IELTS Scores for Students with Different Language Background这个考题可以分为雅思考试的听说读写,对比各个科目的最高点与最低点,可以发现:在四类考生中,Hindi考生在听、写、读三方面成绩最佳,而Spanish考生在读方面成绩最佳,但在听与写却是最低。
同时,Russian与Malayalam考生阅读成绩一样,而且都是最低,Malayalam考生说的成绩最差。
如果总体对比听说读写四类,会发现四种考生的说的成绩都是最高的。
进过分析,写作的思路就非常清楚了。
From an overall perspective, Hindi speakers achieved the highest grades with an average score of 6.73 across all four sections. Malayalam speakers’ scores took the second place, at 6.43, closely followed by Spanish and Russian speakers, at 6.41 and 6.38. (Note:任何题目中出现总量(total)或平均数(average),其写法都是进行排序。