数字图像处理(双语)期中考试试卷答案
《数字图像处理》习题参考答案
1《数字图像处理》 习题参考答案第1章概述1.1连续图像和数字图像如何相互转换?答:数字图像将图像看成是许多大小相同、形状一致的像素组成。
这样,数字图像可以用二维矩阵表示。
将自然界的图像通过光学系统成像并由电子器件或系统转化为模拟图像 (连续图像)信号,再由模拟 /数字转化器(ADC )得到原始的数字图像信号。
图像的数字化包括离散和量化两个主要步骤。
在空间将连续坐标过程称为离散化,而进一步将图像的幅度值(可能是灰度或色彩)整数化的过程称为量化。
1.2采用数字图像处理有何优点?答:数字图像处理与光学等模拟方式相比具有以下鲜明的特点:1 •具有数字信号处理技术共有的特点。
(1)处理精度高。
(2)重现性能好。
(3)灵活性高。
2•数字图像处理后的图像是供人观察和评价的,也可能作为机器视觉的预处理结果。
3•数字图像处理技术适用面宽。
4 •数字图像处理技术综合性强。
1.3数字图像处理主要包括哪些研究内容?答:图像处理的任务是将客观世界的景象进行获取并转化为数字图像、进行增强、变换、编码、恢复、重建、编码和压缩、分割等处理,它将一幅图像转化为另一幅具有新的意义的 图像。
1.4讨论数字图像处理系统的组成。
列举你熟悉的图像处理系统并分析它们的组成和功能。
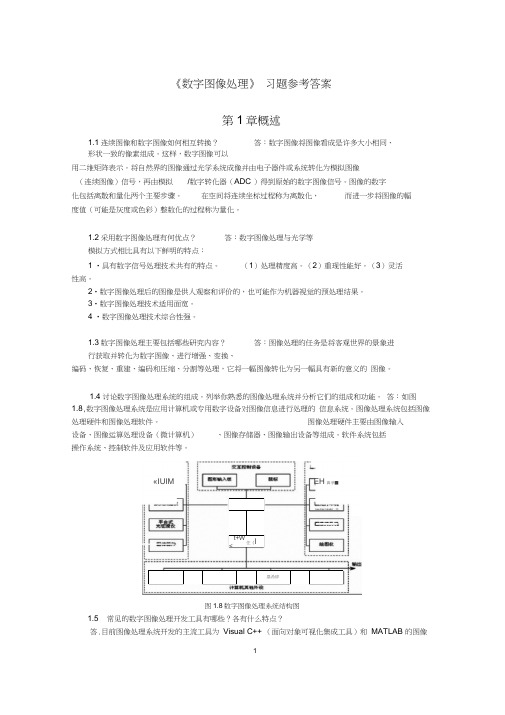
答:如图1.8,数字图像处理系统是应用计算机或专用数字设备对图像信息进行处理的 信息系统。
图像处理系统包括图像处理硬件和图像处理软件。
图像处理硬件主要由图像输入设备、图像运算处理设备(微计算机) 、图像存储器、图像输出设备等组成。
软件系统包括操作系统、控制软件及应用软件等。
1.5 常见的数字图像处理开发工具有哪些?各有什么特点?答.目前图像处理系统开发的主流工具为 Visual C++ (面向对象可视化集成工具)和 MATLAB 的图像t+W<住《l 塁希碎«IUIMEH 鼻爭■图1.8数字图像处理系统结构图处理工具箱(Image Processing Tool box )。
数字图像期中考试试题
数字图像期中考试试题
《数字图像处理》中期测试
注意:请自备一张答题纸,将以下试题的答案写在纸上。
注明学号,姓名!上交时间:本周五上课时统一上交(5月16号)1.试阐述图像工程的三个层次及相互之间的关系。
2.一个完整的图像处理系统包括哪些的基本功能?
3.灰度映射的基本原理是什么?典型的灰度映射有哪些?
4.直方图均衡化处理的主要步骤是什么?
5.直方图规定化处理与直方图均衡化处理有什么区别?
6.试论述模板卷积和模板排序的基本步骤。
7.试论述使用理想低通滤波器对图像进行滤波产生振铃现象的原因。
期中考试卷子答案 数字图像处理
1.什么是数字图像?(14分)答:一副图像可定义为一个二维函数f(x,y),当x,y和幅值f为有限的离散数值时,称给图像为数字图像。
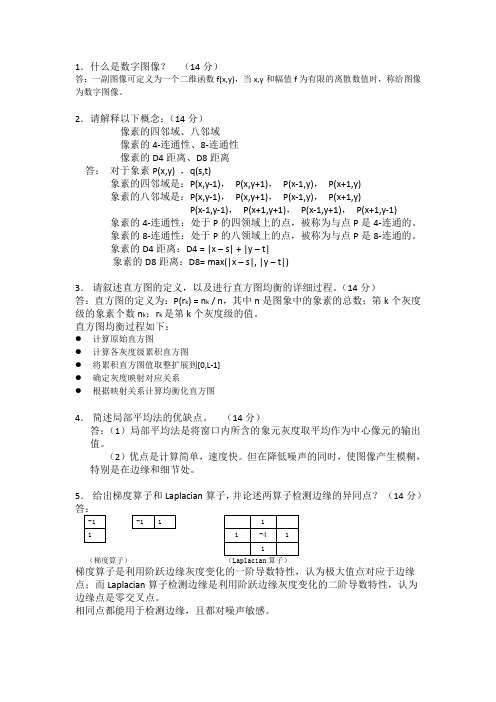
2.请解释以下概念:(14分)像素的四邻域、八邻域像素的4-连通性、8-连通性像素的D4距离、D8距离答:对于象素P(x,y) ,q(s,t)象素的四邻域是:P(x,y-1),P(x,y+1),P(x-1,y),P(x+1,y)象素的八邻域是:P(x,y-1),P(x,y+1),P(x-1,y),P(x+1,y)P(x-1,y-1),P(x+1,y+1),P(x-1,y+1),P(x+1,y-1) 象素的4-连通性:处于P的四领域上的点,被称为与点P是4-连通的。
象素的8-连通性:处于P的八领域上的点,被称为与点P是8-连通的。
象素的D4距离:D4 = |x – s| + |y – t|象素的D8距离:D8= max(|x – s|, |y – t|)3.请叙述直方图的定义,以及进行直方图均衡的详细过程。
(14分)答:直方图的定义为:P(r k) = n k / n,其中n是图象中的象素的总数;第k个灰度级的象素个数n k;r k是第k个灰度级的值。
直方图均衡过程如下:●计算原始直方图●计算各灰度级累积直方图●将累积直方图值取整扩展到[0,L-1]●确定灰度映射对应关系●根据映射关系计算均衡化直方图4.简述局部平均法的优缺点。
(14分)答:(1)局部平均法是将窗口内所含的象元灰度取平均作为中心像元的输出值。
(2)优点是计算简单,速度快。
但在降低噪声的同时,使图像产生模糊,特别是在边缘和细节处。
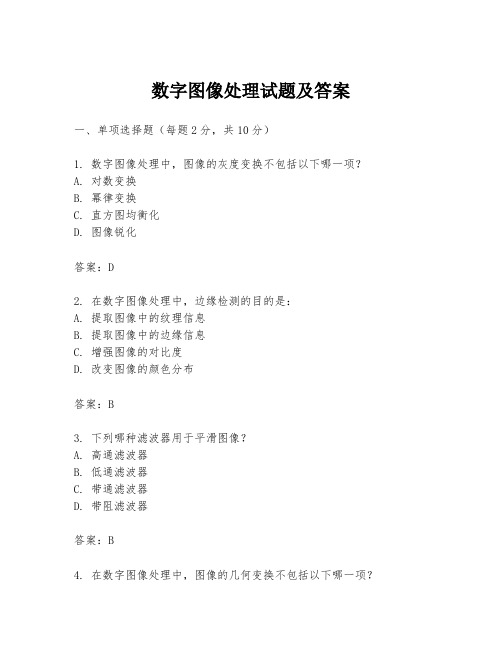
5.给出梯度算子和Laplacian算子,并论述两算子检测边缘的异同点?(14分)(梯度算子)梯度算子是利用阶跃边缘灰度变化的一阶导数特性,认为极大值点对应于边缘点;而Laplacian算子检测边缘是利用阶跃边缘灰度变化的二阶导数特性,认为边缘点是零交叉点。
相同点都能用于检测边缘,且都对噪声敏感。
数字图像处理试题及答案
数字图像处理试题及答案一、单项选择题(每题2分,共10分)1. 数字图像处理中,图像的灰度变换不包括以下哪一项?A. 对数变换B. 幂律变换C. 直方图均衡化D. 图像锐化答案:D2. 在数字图像处理中,边缘检测的目的是:A. 提取图像中的纹理信息B. 提取图像中的边缘信息C. 增强图像的对比度D. 改变图像的颜色分布答案:B3. 下列哪种滤波器用于平滑图像?A. 高通滤波器B. 低通滤波器C. 带通滤波器D. 带阻滤波器答案:B4. 在数字图像处理中,图像的几何变换不包括以下哪一项?B. 缩放C. 剪切D. 颜色变换答案:D5. 在数字图像处理中,以下哪种方法用于图像分割?A. 阈值处理B. 边缘检测C. 直方图分析D. 颜色量化答案:A二、多项选择题(每题3分,共15分)6. 数字图像处理中的图像增强技术包括:A. 直方图均衡化B. 锐化C. 噪声滤除D. 图像压缩答案:ABC7. 在数字图像处理中,以下哪些是空间域的图像增强方法?A. 直方图均衡化B. 中值滤波C. 拉普拉斯算子D. 傅里叶变换8. 数字图像处理中,以下哪些是频域的图像增强方法?A. 低通滤波B. 高通滤波C. 带通滤波D. 傅里叶变换答案:ABC9. 在数字图像处理中,以下哪些是图像的几何变换?A. 旋转B. 缩放C. 平移D. 颜色变换答案:ABC10. 数字图像处理中,以下哪些是图像分割的方法?A. 阈值处理B. 边缘检测C. 区域生长D. 颜色量化答案:ABC三、简答题(每题5分,共20分)11. 简述数字图像处理中边缘检测的基本原理。
答案:边缘检测的基本原理是识别图像中亮度变化剧烈的区域,这些区域通常对应于物体的边界。
通过应用边缘检测算子,如Sobel算子、Prewitt算子或Canny算子,可以突出图像中的边缘,从而为后续的图像分析和处理提供重要信息。
12. 描述数字图像处理中直方图均衡化的目的和效果。
答案:直方图均衡化的目的是改善图像的对比度,使图像的直方图分布更加均匀。
数字图像处理(双语)期中考试试卷答案
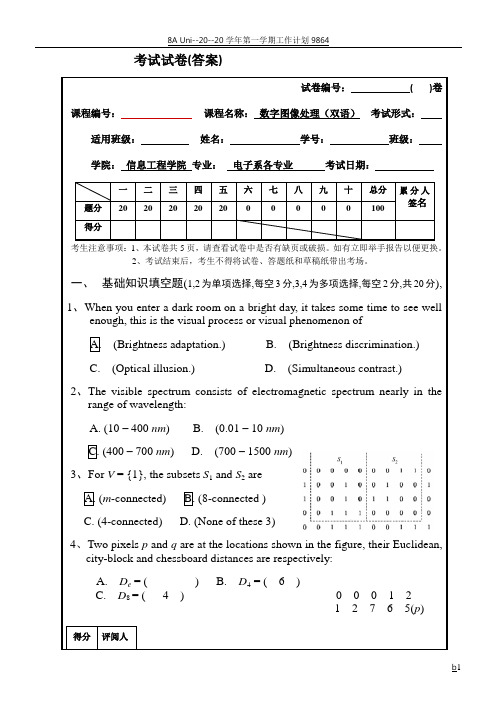
考试试卷(答案)试卷编号:( )卷课程编号:课程名称:数字图像处理(双语)考试形式:适用班级:姓名:学号:班级:学院:信息工程学院专业:电子系各专业考试日期:一二三四五六七八九十总分累分人签名题分20 20 20 20 20 0 0 0 0 0 100得分考生注意事项:1、本试卷共5页,请查看试卷中是否有缺页或破损。
如有立即举手报告以便更换。
2、考试结束后,考生不得将试卷、答题纸和草稿纸带出考场。
一、基础知识填空题(1,2为单项选择,每空3分,3,4为多项选择,每空2分,共20分),1 1、When you enter a dark room on a bright day, it takes some time to see wellenough, this is the visual process or visual phenomenon ofA. (Brightness adaptation.)B. (Brightness discrimination.)C. (Optical illusion.)D. (Simultaneous contrast.)2、The visible spectrum consists of electromagnetic spectrum nearly in therange of wavelength:A. (10 – 400 nm)B. (0.01 – 10 nm)C. (400 – 700 nm)D. (700 – 1500 nm)3、For V = {1}, the subsets S1 and S2areA. (m-connected)B. (8-connected )C. (4-connected)D. (None of these 3)4、Two pixels p and q are at the locations shown in the figure, their Euclidean,city-block and chessboard distances are respectively:A. D e= ( )B. D4 = ( 6 )C. D8 = ( 4 ) 0 0 0 1 21 2 7 6 5(p)得分评阅人二、空域图像增强题1(Image enhancement in the spatial domain) (20分) Exponential of the form s = T (r ) = 2552r e α-, 0 ≤ r ≤ 255, with α being a positive constant, are useful for constructing smooth gray-level transformation functions. (1) Start with this basic function and construct transformation functions having the shapes shown in the above figures. (15分) (2) What kind of transformation does the function of (a) approximatelycomplete for an input of a gray intensity image? (5分) (1) (a)so.(b)so得分 评阅人255 255255 (b)(a)(c)三、空域图像增强题2(Image enhancement in the spatial domain) (20分)The White bars in the test pattern shown are 7 pixels wide and 210 pixels high. The separator between bars is 17 pixels. What would this image look like after application of1. A 3×3 median filter?2. A 7×7 median filter?3. A 9×9 median filter?4. A 15×15 median filter?( Note: in your answer, quantitative analysis is expected. )Answer:The separator between bars is 17 pixels wide > 15, so none of the 4 filters can remove any black pixels. We can treat all black pixels as background.1. Applying a 3×3 median filter removes the 1 pixel at the top left, top right, bottom left and bottom right locations of each bar, as shown in (a), which is an amplified corner of the filteredimage.2. Applying a 7×7 median filter remove 6 pixels located at the top left, the top right, the bottom left, the bottom right of each bar, as shown in (b),which is an amplified corner of the median filtered image.0111110 0001000 3×3 1111111 7×7 01111110 1111111 011111103. Applying a 9×9 median filter remove 10 pixels located at the top left, the top right, the bottom left, the bottom right of each bar, as shown in (c). which is an amplified corner of the median filtered image 0000000 9×9 001110001111104. This time all bars are disappeared.得分 评阅人(a)(b)(a)。
数字图像处理试题和答案解析
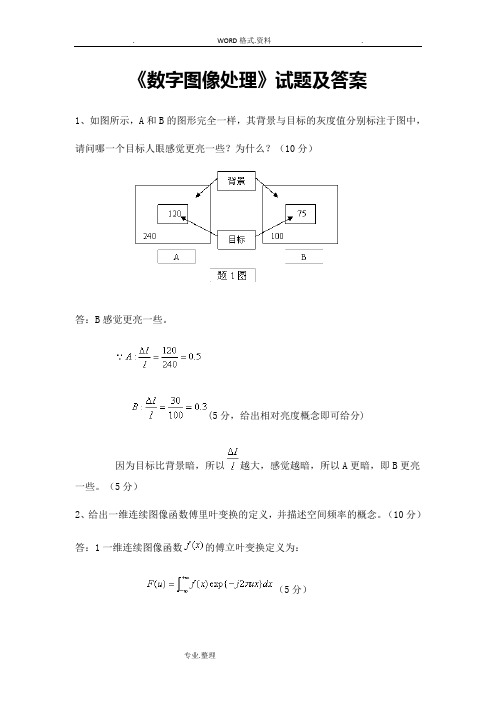
《数字图像处理》试题及答案1、如图所示,A和B的图形完全一样,其背景与目标的灰度值分别标注于图中,请问哪一个目标人眼感觉更亮一些?为什么?(10分)答:B感觉更亮一些。
(5分,给出相对亮度概念即可给分)因为目标比背景暗,所以越大,感觉越暗,所以A更暗,即B更亮一些。
(5分)2、给出一维连续图像函数傅里叶变换的定义,并描述空间频率的概念。
(10分)答:1一维连续图像函数的傅立叶变换定义为:(5分)2空间频率是指单位长度内亮度作周期变化的次数。
(2分)对于傅立叶变换基函数,考虑的最大值直线在坐标轴上的截距为,则表示空间周期,即为空间频率。
(3分)3、已知的图像数据如图所示,请计算:(15分)a、的离散傅里叶变换;b、的哈德玛变换。
题3图答:1令,则,(5分)2(3分)则哈德玛变换为(3分)4、写出频域拉普拉斯算子的传递函数,并说明掩模矩阵对图像的卷积与拉普拉斯算子对图像运算结果之间的关系。
(15分)答:1F =F=F=F +F(6分)2相当于原图像与拉普拉斯算子运算之差(3分)。
因为拉式算子:(2分)所以:=-(4分)5、如图为一幅16级灰度的图像。
请写出均值滤波和中值滤波的3x3滤波器;说明这两种滤波器各自的特点;并写出两种滤波器对下图的滤波结果(只处理灰色区域,不处理边界)。
(15分)题5图答:均值滤波:(2分)中值滤波:(2分)均值滤波可以去除突然变化的点噪声,从而滤除一定的噪声,但其代价是图像有一定程度的模糊;中值滤波容易去除孤立的点、线噪声,同时保持图像的边缘。
(5分)均值滤波:(3分)中值滤波:(3分)6、写出图像退化/复原的总体模型;利用线性系统的相关知识,推导线性空不变条件下连续图像函数的退化模型。
(10分)答:(5分)线性系统中:其中为系统H的冲激响应。
又空不变系统,则(5分)7、如图,X是待处理图像,黑点代表目标,白点代表背景;B是结构元素,原点在中心。
试分别给出B对X做开运算和闭运算的结果(在图中涂黑目标点即可)。
《数字图像处理》习题参考答案
1《数字图像处理》 习题参考答案第1章概述1.1连续图像和数字图像如何相互转换?答:数字图像将图像看成是许多大小相同、形状一致的像素组成。
这样,数字图像可以用二维矩阵表示。
将自然界的图像通过光学系统成像并由电子器件或系统转化为模拟图像 (连续图像)信号,再由模拟 /数字转化器(ADC )得到原始的数字图像信号。
图像的数字化包括离散和量化两个主要步骤。
在空间将连续坐标过程称为离散化,而进一步将图像的幅度值(可能是灰度或色彩)整数化的过程称为量化。
1.2采用数字图像处理有何优点?答:数字图像处理与光学等模拟方式相比具有以下鲜明的特点:1 •具有数字信号处理技术共有的特点。
(1)处理精度高。
(2)重现性能好。
(3)灵活性高。
2•数字图像处理后的图像是供人观察和评价的,也可能作为机器视觉的预处理结果。
3•数字图像处理技术适用面宽。
4 •数字图像处理技术综合性强。
1.3数字图像处理主要包括哪些研究内容?答:图像处理的任务是将客观世界的景象进行获取并转化为数字图像、进行增强、变换、编码、恢复、重建、编码和压缩、分割等处理,它将一幅图像转化为另一幅具有新的意义的 图像。
1.4讨论数字图像处理系统的组成。
列举你熟悉的图像处理系统并分析它们的组成和功能。
答:如图1.8,数字图像处理系统是应用计算机或专用数字设备对图像信息进行处理的 信息系统。
图像处理系统包括图像处理硬件和图像处理软件。
图像处理硬件主要由图像输入设备、图像运算处理设备(微计算机) 、图像存储器、图像输出设备等组成。
软件系统包括操作系统、控制软件及应用软件等。
1.5 常见的数字图像处理开发工具有哪些?各有什么特点?答.目前图像处理系统开发的主流工具为 Visual C++ (面向对象可视化集成工具)和 MATLAB 的图像t+W<住《l 塁希碎«IUIMEH 鼻爭■图1.8数字图像处理系统结构图处理工具箱(Image Processing Tool box )。
数字图像处理期中考试答案
{
sprintf(s,"\n");
fwrite(s,1,1,fp);
}
}
fclose(fp);
}
void CTeach_testView::On8bitChange()
{
CTeach_testDoc *pDoc=GetDocument();
int i,j;
for(i=0;i<10;i++)
fp=fopen("mywater.bmp","wb+");
BMpFHeader=pDoc->BitMapFileHeader;
BMpFHeader.bfSize=200*200+14+40+1024;
pBMapInfo=pDoc->pBitMapInfo->bmiHeader;
pBMapInfo.biWidth=200;
dc.LineTo(40+i,320-nHist[i]/20);
dc.SelectObject(oldpen);
}
for(i=0+256;i<=255+256;i++)
{
CPen pen(PS_SOLID,1,RGB(0,255,0));
CPen*oldpen =dc.SelectObject(&pen);
{
nHist[pDoc->pImage[i*pDoc->nWidth+j]]++;
}
}
for(i=0;i<256;i++)
{
sprintf(s,"%3d:%6d ",i,nHist[i]);
- 1、下载文档前请自行甄别文档内容的完整性,平台不提供额外的编辑、内容补充、找答案等附加服务。
- 2、"仅部分预览"的文档,不可在线预览部分如存在完整性等问题,可反馈申请退款(可完整预览的文档不适用该条件!)。
- 3、如文档侵犯您的权益,请联系客服反馈,我们会尽快为您处理(人工客服工作时间:9:00-18:30)。
C. (Optical illusion.) D. (Simultaneous contrast.) 2、The visible spectrum consists of electromagnetic spectrum nearly in the range of wavelength: A. (10 – 400nm) B. (0.01 – 10 nm)
(b)
(a)
第 3 页共 5 页
四、 频域图像增强题 1 (Image enhancement in Freq. Domain 1) (20 分) Given a continuous function f(t) = cos(2πnt), (1) Its period T = ? 得分 评阅人 (2) Its frequency F = ? (3) Its Fourier transform F (jΩ) = ? (4) The Nyquist rate fs = ? (5) If it is sampled with a rate higher than fs, what’s the sampling function? What do the sampled function and its Fourier transform like like? (6) If it is sampled with a rate lower than fs, answer the same problem as (5). (7) If it is sampled with the Nyquist rate at the instants t = 0, ∆T, 2∆T, …, answer the same problem as (5). 得分 评阅人 Answer: (1) The period T = 1/n. (2) The frequency F = n. (3) F (jΩ)=
(a) The period is such that 2πnt =2π, or t =1/n. (b) The frequency is 1 divided by the period, or n. The continuous Fourier transform of the given sine wave looks as in Fig. P4.4(a) (see Problem 4.3), and the transform of the sampled data (showing a few periods) has the general form illustrated in Fig. P4.4(b) (the dashed box is an ideal filter that would allow reconstruction if the sine function were sampled, with the sampling theorem being satisfied). (c) The Nyquist sampling rate is exactly twice the highest frequency, or 2 n. That is, (1/ΔT) = 2n, or ΔT = 1/2n. Taking samples at t = ±ΔT,±2ΔT, . . . would yield the sampled function sin (2πnΔT ) whose values are all 0s because ΔT = 54 CHAPTER 4. PROBLEM SOLUTIONS
-nn F()
Figure P4.4 1/2n and n is an integer. In terms of Fig. P4.4(b), we see that when ΔT = 1/2n all the positive and negative impulses would coincide, thus canceling each other and giving a result of 0 for the sampled data. (d) When the sampling rate is less than the Nyquist rate, we can have a situation such as the one illustrated in Fig. P4.4(c), which is the sum of two sine waves in this case. For some values of sampling, the sum of the two sines combine to form a single sine wave and a plot of the samples would appear as in Fig. 4.8 of the book. Other values would result in functions whose samples can describe any shape obtainable by sampling the sum of two sines.
一、 基础知识填空题(1,2 为单项选择,每空 3 分,3,4 为多项选择,每空 2 分,共 20 分), 1 1、When you enter a dark room on a bright day, it takes some time to see well enough, this is the visual process or visual phenomenon of A. (Brightness adaptation.) B. (Brightness discrimination.)
C. (400 – 700 nm) D. (700 – 1500 nm) 3、For V= {1}, the subsets S1 and S2are A. (m-connected) B. (8-connected )
C.(4-connected) D.(None of these 3) 4、Two pixels pandqare at the locations shown in the figure, their Euclidean, city-block and chessboard distances are respectively: A. De= ( C. D8 = ( B. D4 = ( 6 ) 4 ) 0 0 0 1 2 1 2 7 6 5(p) 3 4 5 6 7
2
(1) (a)
得分 评阅人
so (a) (b)
. (c)
(b)
so
第 2 页共 5 页
(c) , can not be decided from the information given by the figure (c). We can specify with an arbitrary positive number, for
得分 评阅人
)Байду номын сангаас
(q)4 5 6 7 3
第 1 页共 5 页
二、空域图像增强题 1(Image enhancement in the spatial domain) (20 分)
r Exponential of the form s = T(r) = 255 e , 0 ≤ r ≤ 255, with α beinga positive constant, are useful for constructing smooth gray-level transformation functions. (1) Start with this basic function and construct transformation functions having the shapes shown in the above figures. (15 255 255 分 ) (2) What kind of transformation does 255 the function of (a) approximatelycomplete for an input of a gray intensity image? (5 分)
三、空域图像增强题 2(Image enhancement in the spatial domain) (20 分) The White bars in the test pattern shown are 7 pixels wide and 210 pixels high. The separator between bars is 17 pixels. What would this image look like after application of 得分 评阅人 1. A 3×3 median filter? 2. A 7×7 median filter? 3. A 9×9 median filter? 4. A 15×15 median filter? (Note: in your answer, quantitative analysis is expected. ) Answer: The separator between bars is 17 pixels wide > 15, so none of the 4 filters can remove any black pixels. We can treat all black pixels as background. 1. Applying a 3 × 3 median filter removes the 1 pixel at the top left, top right, bottom left and bottom right locations of each bar, as shown in (a), which is an amplified corner of the filtered image. (a) 2. Applying a 7×7 median filter remove 6 pixels located at the top left, the top right, the bottom left, the bottom right of each bar, as shown in (b),which is an amplified corner of the median filtered image. 0111110 0001000 3×3 1111111 7×7 01111110 1111111 01111110 3. Applying a 9×9 median filter remove 10 pixels located at the top left, the top right, the bottom left, the bottom right of each bar, as shown in (c). which is an amplified corner of the median filtered image 0000000 9×9 0011100 0111110 4. This time all bars are disappeared.