国际贸易英文文献
国际服务贸易外文文献翻译
国际服务贸易外文翻译文献(含:英文原文及中文译文)文献出处:《World Development》,2015,12(1):35-44.英文原文The research of international service trade and economic growth theoryChakraborty Kavin1 IntroductionThe study of the relation between international trade and economic growth is one of the most active issues. Since 1980s, the world has been in transition from national economy orientating towards natural resources and manufacturing industry to global and regional economy orientating towards information resources and service industry. After the signature of GA TS in1994, the institutional arrangements on liberalizing service trade result in a world-wide involvement division and exchanges of service trade, and it is undoubtedly that the positive interaction between service trade and investment leads to economic growth. But the theoretical research on service trade lags behind practice.Is it a statistic phenomenon or a universal rule of economic growth? To approach the above two issues from theoretical and empirical perspective is of great value to policy-making.For the proposition of that "International service trade will drive economic growth". Theoretical analysis shows that although service tradeis not a direct interpretative variable to economic growth, it can effect economic growth indirectly through other growing factors and technology upgrade, but the ways and mechanisms are different in different stages. In a certain stage of economic development, service trade (including investment) will have static and dynamic effect on factors supply and technology upgrade in one county, which will lead to the domestic alteration of resources condition structure. It is the enterprises that select industry structure, technology structure and trade structure according to dynamic alteration way of comparative technology structure and trade structure, which will ultimately promote evolution of economic growth gradually. So far as operational mechanism of service trade and investment is concerned, service trade affects factors supply in one country by physical capital accumulating effect, human capital effect, technology upgrade effect, institutional transition effect, employment effect and externality of technology, then influences the upgrade of industrial structure, the upgrade of technological structure and the transition of mode of economic growth. It is obvious that dynamic effect is greater than static effect; that external effect is playing more important role than internal effect; and that technology spillover effect of foreign direct investment in service industry is greater than that of service trade in a narrow sense (including across-border supply, consumption abroad and movement of natural person).For the research of mechanism about how service trade drive economic growth. Firstly, the paper verifies the causality between service trade and economic growths concerning different economic bodies and the representative countries. The results show that there are causalities between international service trade and economic growth in the whole world, in the developed countries, in the US and in china. In the developing countries, service trade is the Granger cause of economic growth; In the whole world and the developing countries, economic growth is the Granger cause of service trade; In the US, service export is the Granger cause of economic growth, and economic growth is the Granger cause of service import. On this basis, it is concluded that the opening of service industry will benefit economic growth in one country. Secondly, in order to explore on how the service trade and investment act on economic growth, empirical studies are employed to explain the case of US and that of China. The results show that the routes by which service trade affects economic growth in the US can be rowed as follows from more significant to less: employment effect, human capital effect, physical capital effect, technology effect, institution effect. The results of empirical analysis of China can be summarized that: the routes by which service export affects economic growth can be rowed as follows: employment effect, physical capital effect, institution effect, human capital effect, technology effect; the routs by which service import affectseconomic growth can be rowed as follows: technology effect, institution effect, employment effect, human capital effect, physical capital effect; the routes by which FDI in service affects economic growth can be rowed as follows: technology effect, human capital effect, institution effect, employment effect, physical capital effect. Moreover, the effect of FDI in service is stronger than service import, and the effect of service import is stronger than service export.According to the empirical test in this paper, the conclusion can be drawn as follows: service trade in a narrow sense will have static and dynamic effects on factor supply in one country through import and export of service, FDI in service industry is one of the most important cross-border transactions and is another important channel which will affect the transition of advantages on factor supply in one country. It should be emphasized that the above-mentioned channels will have different effects on countries at different stages of economic development. Whether the roles can be brought into play or not depends on given restraints. The input output of factors themselves cannot form a clear function, but will interact together and act on economic growth hand in hand through numerous feedback chain.Chinese economy is now undergoing transformation from elementary age to middle age of industrialization. Service trade and investment in current period have both advantages and disadvantages.Based on these judgments, we propose that China should pursue a policy favoring protectionism on management of service trade and adopt relevant countermeasures as follows. Scientific development view should be formed with an eye to harmonizing development of three industries so as to lay a solid industries foundation for service trade; The strategic programming should be stipulated and the market of service trade should be opened gradually; The rule of international transfer of service trade should be mastered and environment of utilizing foreign investment on service industry should be improved.As the characteristics of the world's service-oriented economy have gradually emerged, service trade originating from the upgrading of industrial structure has developed rapidly, and the scale of service trade is rapidly expanding. From the statistical data, the total exports of world service trade rose rapidly from 365 billion U.S. dollars in 1980 to 377.779 billion U.S. dollars in 2008, an increase of 9.35 times. Compared with the trade of goods with a long history, service trade is a new form of trade. With the continuous increase in absolute size and relatively low levels, service trade has become a focus of attention in modern society.2 The impact of overall service trade on economic growthAccording to the WTO General Agreement on Trade in Services (GA TS), which was signed in 1994, trade in services includes Cross- border Supply, Consumption A broad, Commercial Presence, and naturalperson mobility. (Movement of Natural Persn) Four modes. The service trade of these four modes has completely different properties and characteristics. Therefore, it is difficult to establish a unified theoretical framework for service trade to affect economic growth. The corresponding literature is very rare. The only foreign documents are mainly Robinson et al. (2002), who simply regard service trade as a commodity. Trade, without taking into account differences in the four trade models, studied the economic growth effects of service trade liberalization using the Computable General Equilibrium (CGE) model.Using empirical methods to study the literature on the impact of overall service trade on economic growth is more, but such studies are mostly domestic scholars. Research shows that the average contribution of China's overall service trade to economic growth is 18.9%.3 Effect of Service Trade in Different Industries on Economic GrowthAt present, the literature on the impact of industry trade in service trade on economic growth is mostly concentrated in such service sectors as finance, telecommunications, and health care. These studies have basically reached a relatively unanimous conclusion that the opening of the service sector or the increase in productivity can significantly promote economic growth. . For example, studies by Beck et al. (1998), M urinde & Ryan (2003), and Eschenbach (2004) suggest that the opening of the financial sector has, to a certain extent, broken the monopoly of domesticfinancial markets and prompted the orderly competition of financial markets. On the normal development track, productivity has improved, and it has finally led to economic growth in the country. Kim (2000) studied the relationship between the development of service trade in the distribution sector and the growth of total factor productivity (TFP) using Korea's input-output data. The results show that the liberalization of service trade not only significantly promoted its own TFP. The promotion also promoted the improvement of total factor productivity in the related manufacturing sector. The total factor productivity growth brought about by service trade almost covered the entire economic sector.4 Effect of Service Trade on Economic Growth by Different Trading ModesThere are few literatures on specific transaction models and theoretical studies on the impact of trade in services on economic growth. Carr et al. (2001) & M arkusen et al. (2005) theoretically examined the commercial existence model by means of the CGE model. The impact of the trade in services on economic growth shows that the opening up of trade in services is an important source of the increase in economic welfare of a country. From the perspective of economic welfare, the opening up of trade in services is a general trend. Subsequently, the use of CGE models to theoretically examine the impact of service trade on economic growth began to prevail. For example, Rutherford et al. (2005)used the CGE model to evaluate Russia's WTO accession effects, and Ko nan &Maskus (2006) used CGE models. The potential effects of Tunisia's elimination of barriers to trade in services were studied. Their conclusions indicate that the increase in the level of economic welfare in one country can benefit from the opening up of the service market, while the elimination of FDI market access barriers in the service sector is a pattern of four trades. The most important liberalization measures are the main sources of increased welfare in a country. There are a lot of literatures on the relationship between service trade and economic growth in specific models using empirical methods. In the four modes of trade in services, commercial presence is the most important one, and from the point of view of data availability, although statistical data is still not very accurate, commercial existence of service trade is based on service industry FDI as a carrier. To achieve this, researchers can use service industry FDI data to characterize the scale of service trade in this model, and this type of trade model has received more attention. Among them, Markusen (1989) believes that the existence of commercial trade in services has two positive and negative effects. The positive effect is that competition in the service sector has led to an increase in domestic demand for the sector’s production factors, which is conducive to output growth. The effect of market size and negative effects means that the intensified competition in the domestic market of service industries has led to the withdrawal ofdomestic service-oriented enterprises from the market. The study by Markusen (1989) shows that the effect of market size after the opening of the service market far exceeds the crowding-out effect. After offsetting the crowding-out effect, it can still promote the productivity improvement of the non-service sector and further lead to the structure of domestic trade in goods. The changes, those sectors that were previously low in productivity and dependent on imports, will evolve into high-productivity export sectors, which is quite similar to the latest research findings on the interactive development of producer services and manufacturing. Hoekman (2006) and Hoekman (2006) used India as an example to examine the impact of the existence of commercial trade in services in the finance, telecommunications, and transportation sectors on the competitiveness of the goods export sector, and believe that these sectors have been liberalized. The level of soft facilities has been increased, which in turn has greatly reduced the operating costs of the downstream product manufacturing sector, which has increased the export competitiveness. With the inefficiency of the domestic service industry, the unfavorable pattern is reversed with the help of commercial presence of service trade. Feasible choice. Guerrieri et al. (2005) took the EU as the research object and analyzed the role of commercial trade in services for knowledge accumulation and economic growth. The study concluded that the openness of the service market or the relaxation of domesticservice regulations has positively promoted economic growth. It was found that the imported service items may be more able to promote economic growth than the domestic same service items due to high technological content.5 Possible Future Research DirectionsIt is not difficult to find from the above-mentioned documents that since the development of service trade started late, research on the growth of service trade began to rise gradually from the 1980s, and more than 20 years of research in this area is in the ascendant. With the further enhancement of the status of trade in services, the possible directions for future research will generally include the following aspects.From the point of view of research methodology, classification of service trade can be studied. As the theory of goods trade has gradually matured, the development practice of service trade still calls for the birth of the theory of service trade. Helpman and Markusen, international economists, expressed on different occasions that the difficulty in establishing the theoretical system of service trade lies in the fact that there are large differences in various types of service trades, and it is difficult for researchers to overcome the gap between them. Classifying service trade according to certain standards and exploring the impact of various types of service trade on economic growth is a possible direction for future research.From the perspective of the research subjects, it is possible to study China’s service trade and economic growth. China’s GDP has already ranked second in the world. However, the service industry’s added value accounted for only 40% of GDP, which is obviously not commensurate with the status of an economic power. In addition, the trade in services is still relatively small compared to the trade in goods. Under such a realistic background, what is the relationship between China's service trade and economic growth? How will service trade contribute to China's economic growth? What impact will service outsourcing have on China's economy? With China in In the next decade, how will China make service trade an engine of economic growth? From the academic point of view, economists from all countries are paying attention to China’s economic development, and China’s service trade will also be improved. It will become a research hotspot.From the perspective of research topics, it is possible to study the impact of service outsourcing on economic growth. In 2008, the scale of global service outsourcing market has reached 1.5 trillion US dollars. According to the UNCTAD (UNCT AD) speculation, the global service outsourcing market will increase by 30%-40% in the next 5-10 years.The surging service industry outsourcing is a new form of service trade. How does service outsourcing drive economic growth through employment, industrial structure upgrading, and technology spillovers?What are the differences in the impact of contracting and receiving services on economic growth in the service industry? Research on these issues will start with the development of service outsourcing to important theoretical guidance.中文译文国际服务贸易与经济增长理论与实证研究Chakraborty Kavin1 引言国际贸易与经济增长始终是国际经济学最生动的论题之一。
国际经济与贸易外文翻译外文文献英文文献.docx
国际经济与贸易外文翻译外文文献英文文献.docx外文文献翻译The effects of subjective norms on behaviour in the theory of planned behaviour: A meta-analysisMark Manning*University of Massachusetts, Amherst, Massachusetts, USAA meta-analysis investigated the effects of perceived injunctive (IN) and descriptive (DN) norms on behaviour (BEH) within the theory of planned behaviour (TPB) in a sample of 196 studies. Two related correlation matrices (pairwise and listwise) were synthesized from the data and used to model the TPB relations with path analyses.Convergent evidence indicated that the relation between DN and BEH was stronger than the relation between IN and BEH. Evidence also suggested a significant direct relation between DN and BEH in the context of TPB. A suppressor effect of IN on DN in its relation with BEH was also noted? Moderator analyses indicated that the DN-BEH relation was stronger when there was more time between measures of cognition and behaviour, when behaviours were not socially approved, more socially motive and more pleasant: results were mixed in the case of the IN-BEH relation. Results imply that IN and DN are conceptually different constructs?As social beings, normative pressure inevitably affects our behaviour?Social nonns influence the way we dress, how we vote, what we buy, and a host of other behavioural decisions.Social psychologists have been exploring the influence of social norms on behaviour for decades? From AschM and Milgram s conformity- experiments (Asch, 19S6;Milgram, Bickman, & Berkowitz, 1969) through recent work by Cialdini andcolleagues(Cialdini, Reno. & Kallgren, 1990; Reno, Cialdini, & Kallgren, 1993), a substantial body of evidence has demonstrated that people conform to the judgments and behaviours of others.In experiments conducted by Cialdini and his colleagues (Cialdini et al., 1990; Reno et al., 1993), participants inferred behavioural norms for littering from environmental cues and acted in accord with these norms. The results highlight the fact that perceptions of norms, ratber than actual norms, can affect behaviour? Tlie relation between perceived norms and behaviour has receivedmuch empirical support (Borsari & Carey, 2003; Campo, Brossard. Fnizer. Marchell, Lewis, & Talbot, 2003; Gomberg, Schneider, & Dejong, 2(K)I; Grube, Morgan, & MeGree, 1986; Okun, Karoly, & Lutz,2002; Riniai & Real. 2005). However, one ofthc most influential models for predicting behaviour, the thcor>*of planned behaviour (TPB; Ajzcn, 1991), posits that rather than a direct relation between norm and behaviour, perceived nortns influence behaviour indirectly by way of behavioural intentions. Investigating the perceived norm-behaviour relation in tlic context of this theory offers insight not only into the strength of the relation, but also into the extent to which perceived norms may directly influence behaviour counter to theoretical expectations.The present study used mcta-analytic path analyses to examine, the relation between two types of perceived norms (injunctive (IN) and descriptive (DN) norms; described below) and behaviour in the context of the TPB (Ajzcn. 1991). The investigation explored the direct effects of IN and DN on behaviour as well as factors that may moderate the effect of subjective norms (SN) on behaviour?The theory of planned behaviourAccording to the TPB, the immediate antecedent of behaviour is the intention to pertbrm the behaviour (Figure 1). This behavioural intention is in turn a function of three major determinants: attitude towards the behaviour, perceived SN pertaining to the behaviour, and perceived degree of control over engaging in and ctJmpleting the behaviour (perceived behavioural control).The formation of attitudes (ATT), SN and perceived behavioural control (PBC) are respectively functions of behavioural beliefs, normative beliefs and control beliefs that a person holds with regards to the behaviour? Concerning ATT, the set of accessible beliefs that a person holds about the outcome of a behaviour will determine the evaluation of the behaviour, and thus influence the strength and direction of the ATT towards the behaviour.SN are a function of the normative beliefs that people relevant to the individual are perceived as having towards tbe behaviour coupled with the motivation of the individual to comply with the expected notins of these relevant persons? PBC is a function of the perceived factors that will influence the ability to engage in the behaviour coupled with the perception as to whether or not these factors will be present.In short, the TPB holds that favourable ATT, SN. And perceptions of control will lead to favourable intentions to engage in a given behaviour. Actual control over engaging in the behaviouris itself an important determinant? To the extent that individuals realistically appraise the amount of control that they have over the behaviour, the measure of PBC; can serve as a proxy for actual control. Perceived control is expected to have amoderating effect such that intentions will be reflected in actual behaviour to the extent that perceived control is high.The TPB has been applied successfully to a wide range of behaviours accounting for a sizable amount of variance (Armitage & Ckmner, 2001: Bamberg, Ajzen, & Schmidt,2003; Hardeman. Johnston. Johnston, Bonetti, Wareham, & Kinmonth. 2002; Povey.Wellens, & Conner, 2001; Rise. Thompson. & Verplanken, 2003). Regarding the SN construct, the theory holds that the effect of SN on behaviour is fully mediated by behavioural intentions? In other words, SN are not expected to have a direct effect (DE)on behaviour but instead influetice behaviours indirectly through their effect on intentions.Descriptive and injunctive normsTwo types of SN can be distinguished. IN are social pressures to engage in a behaviour based on the perception of what other people want you to do whereas DN are social pressures based on the observed or inferred behaviour of others? Tliis distinction has been empirically supported (Cialdini et al .,1990; Deutsch & Gerard.1955; Grube et al., 1986; Larimer & Neighbours, 2005; Larimer. Turner, Mallett. & Geisner, 2004; Reno et al.,1993; Rhodes & Courneya, 2003; White, Terry, & Hogg, 1994). Within the TPB, the SN construct was originally conceptualized as an injunctive norm (Ajzen, 1991). More recently, however, Ajzen and Fishbein (200S) have recommended including both types of normative measures in constructing planned behaviour stirveys? DN and IN will therefore be considered separately in the analyses to follow. Subjective norms-behaviour relationIn reviewing the SN construct in the planned behaviour context, Conner and Armitage(1998) have noted the lack of predictive power of the IN construct when predicting intention.Due to the paucity- of studies including DN in the planned behaviour context,conclusions regarding DN in this context are sparser. Recently, several investigators have included DN as predictors of intentions in the planned behaviour model (PBM;Fekadu &Kraft, 2002; MCiMUlan & Conner, 2(K)3; Okun et al.. 2002: Sheeran & Orbell, 1999b). Rivis and Sbeeran (2003) conducted a meta-analysis of DN in the planned behaviour context. Their analysis, based on 18 studies, demonstrated a significant relationship between DN and intention when controlling for otlier variables in the TPB.In that, these previous studies have investigated theeffects of SN on intentions, to date,no planned behaviour mcta-ana lysis has explored the potential for differences in the effects of SN on behaviour in the planned behaviour context.Deutsch and Gerard (1955) have suggested that DN and IN refer to different sources of motivation. Regarding DN, it has been shown that perceptions of behaviours of others lead one to behave in similar manners (Asch, 1956;Milgram et al., 1969). Descriptive normative information functions as a heuristic with regards to behavioural decisions offering cues as to what is appropriate behaviour iii a given situation (Cialdini et al., 1990; van Knippenberg, 2000). IN on the other iiand operate more through the role of motivation to comply with social sanctions (Ajzen, 1991;Lapinski & Rimal, 2005). To the extent that individuals are motivated to comply with perceived behavioural expectations of relevant referents, they avoid social sanctions?Though several studies have looked at the effect of one or botli types of norms on particular behaviours, there has yet to be a single meta-analytical review that compares the relationshipbetween the two types of norms and behaviours across a spectrum of behaviours. Consequently, on a general level it is unknown whether one type of norm has a stronger effect on behaviour than the other it may be hypothesized that DN have a stronger effect on behaviour than IN because DN are activated in the immediate behavioural situation. Furthermore, processing of DN for behavioural decisions may require less cognitive effort relative to the processing of IN, in that DN may rely more on heuristic than systematic informatioprocessing?Perhaps, this advantage contributes to efficient behavioural decision?making in line with descriptive normative information. In fact, researchers have shown that conditions that facilitate the use of heuristic information-processing lead participants to act more in line with DN (Hertel, Neuhof, Theucr, & Kerr, 2000). It is expected therefore, that DN will have a stronger effect on behaviour relative to IN.Direct effect ofSN on behaviourThe TPB posits that the relationship between SN and behaviour is fully mediated by behavioural intentions (Ajzen, 1991; Ajzen & Fishbein, 1973)? However, a number of planned behaviour studies that have included normative constructs as a behavioural predictor have found direct effects of SN on behaviour (Christian & Abrams, 2004 -Study 2; Christian & Arm 让age, 2002; Christian, Armitage, & Abrams, 2003; Okun et al.,2002; Trafimow & Finlay, 2001). In most research with the TPB, the effect of the normative component on intentions has received most attention (Armitage & Conner,2001; Rivis & Sheeran, 2003) while the potential for a DE of SN onbehaviour has received little empirical or meta-analytical scrutiny.One reason to explore, the potential for a DE may be the hypothetical nature under which most people report cognitionspertaining to behaviour in planned behaviour studies? Hypothetical contexts may not accurately reflect the relations between cognitions and behaviours that are evident in real behavioural contexts (Ajzen, Brown, & Carvajal, 2004). Furthermore, when an individual reports an intention to engage in a particular behaviour in one instance, that behavioural intention may be subject to change from the instance it is formed to the moment when an opportunity for behavioural engagement arises (Ajzen, 1991).For example, in the classic linn (1965) study, hotel managers expressed little intent to allow Chinese couples to stay in their hotels, however allowed them to do so when the instance arose? It is less likely that perceptions of norms related to the behaviour will change over time. Consequently, there is the potential for reported normative perceptions to have stronger relations with behaviour compared with relations between reported behavioural intentions and behaviour. This may be reflected in the presence of a DE of SN on the particular behaviour. The present meta-analjtical synthesis provides the opportunity* to gauge the potential for a direct relation between SN and behaviour in the context of the TPB.Variation in the magnitude of the SN^ehaviour relationship The possibility of a DE of SN on behaviour within the TPB implies that there are two ways in which SN can affect behaviour. There can be the theoretically posited indirect effect on behaviour mediated through intentions, and there may be a DE on behaviour. The total effect therefore is the sum of these two effects? In accord with the prediction that DN have a stronger relation with behaviours compared to the IN-behaviour relation, it is expected that the total effect of DN on behaviour is greater than the total effect of IN on behaviour. In addition to predicteddifferences between DN and IN in their effects on behaviour, there is the potential for differences in the magnitude of the effect within each type of norm. Compatibility* between measures of cognition and behaviour and the time between measurement of cognitions and behaviour are expected to lead to differences in the magnitudes of the effects of SN on behaviour. Additionally, the potential moderating effect of three further variables will be explored;the level of social approval of the behaviour, the extent to which social motives underlie behaviour, and the extent to which a behaviour is uselial versus pleasant may all contribute to variance in the relationship between norms and behaviour.CompatibilityElements of a particular behaviour can be defined in terms of the behavioural target, the action involved in the behaviour, the context in which the behaviour is performed, and the time at wliich it is performed. The relationship between cognitive predictors of a particular behaviour and engagement in the behaviour will be stronger if behavioural elements and cognitive assessment of the behaviour are compatible (Ajzen, 1996; Ajzen & Fishbein. 1977). That is to say., for instance, that if an investigator would tike to pretlict someone's propensity* to exercise 3 days a week for half an hour, measures should assess cognitions regarding exercising 3 days a week for half an hour rather than cognitions to be healthy, or some other general cognition regarding exercise?Tenned the ”principle of compatibility0, it holds that measurements of planned behaviour variables must be compatible with the target behaviour in terms of target, action, context, and time. Given the effect of compatibility and the magnitude of the correlations betweenplanned behaviour variables and behavioural measures, it is expected that studies where the cognitive and behavioural measures are fully compatible will feature stronger relations between SN and behaviour. It is also expected that among studies where measures are more compatible, the intention mediated relation between SN and behaviour will be stronger than any unmediated relation, in line with theoretical dictates, whereas among studies that are less compatible there will potentially be greater direct effects of SN on behaviour.Time interval between measures of SN and behaviourAccording to Ajzen ( 1991 ). cognitive precursors of behaviour that are measured closer to the target behaviour should be more predictive of behavioural engagement. Due to motivational considerations, measures of the intention to engage in a particular behaviour will vary as a function of proximity to behavioural engagement (Bandura & Schunk. 1981; Kamiol & Ross, 1996; Steel & Konig, 2006) in that tlie ftirther in the future is the potential behavioural engagement, the less predictive are intentions to engage in this behaviour. As Ibe relation between stated intentions and actual behaviour decreases over time, the potential exists for SN to be relatively more predictive of behaviour. This potential is evident in light of the argument outlined above wherein SN pertaining to a behaviour are less likely to change over time compared to behavioural intentions. As such, it is expected that as the time between measurement of cognitions and behaviour increases, SN will be reflected to a greater extent in actual behaviour.Furthermore, as the relation between intentions and behaviour diminishes, it is likely that the DE of SN on behaviour will be stronger as more time passes between measures of cognition and behaviour.。
WTO,国际贸易,争端,英文文献
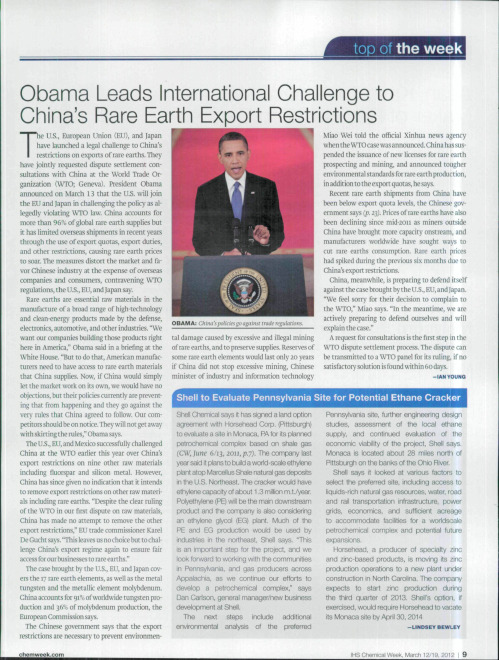
Shell to Evaluate Pennsylvania Site for Potential Ethane Cracker
Shell Chemical says it has signed a land option agrœment with Horsehead Corp. (Pittsburgh) to evaluate a site in Monaca, PA for its planned petrochemical complex based on shale gas (C\V,]une 6/13, 2011, p.j). The company last year said it pians to buiid a world-scale efhylene plant atop Marcellus Shale natural gas deposits in the U.S. Northeast. The cracker would have ethylene capacity of about 1.3 million m.t./year. Polyethylene (PE) will be the main downstream product and the company is also considering an ethylene glycol (EG) plant. Much of the PE and EG production wouid be used by industries in the northeast, Shell says. "This is an important step for the project, and we look forward to working with the communities in Pennsyivania, and gas producers across Appalachia, as we continue our efforts to develop a petrochemical complex," says Dan Carlson, general manager/new business development at Shell. The next environmental steps include additional analysis of the preferred Pennsylvania site, further engineering design studies, assessment of the iocai ethane supply, and continued evaluation of the economic viability of the project, Sheii says. Monaca is iocated about 28 miles north of Pittsburgh on the banks of the Ohio River. Shell says it looked at various factors to select the preferred site, including access to liquids-rich natural gas resources, water, road and rail transportation infrastructure, power grids, economics, and sufficient acreage to accommodate facilities for a worldscale petrochemical complex and potential future expansions. Horsehead, a producer of speciaity zinc and zinc-based products, is moving its zinc production operations to a new plant under construction in North Carolina. The company expects to start zinc production during the third quarter of 2013. Shell's option, if exercised, would require Horsehead to vacate its Monaca site by April 30, 2014
国贸毕业外文文献及其翻译

China’s Competitive Performance: A Threat To East Asian Manufactured Exports?There is growing concern in Southeast and East Asia about the competitive threat posed by China’s burgeoning exports, exacerbated by its accession to the WTO. The threat is not confined to labor-intensive products but spans the whole technological and skill range. At the same time, China is rapidly raising its imports from the region, and it is not clear whether its burgeoning exports will damage its neighbors. We examine the dime nsions of China’s competitive threat in the 1990s, benchmarking competitive performance by technology and market, and finds that market share losses are so far mainly in low technology products, with Japan being the most vulnerable market. We analyze market share changes and highlight product groups that are directly or indirectly exposed to a competitive threat. We examine intra-regional trade and find that China and its neighbors are raising high technology exports in tandem: the nature of the international production systems involved lead to complementarily rather than confrontation. China is thus acting as an engine of export growth for its neighbors in terms of direct trade. However, this will change as China moves up the value chain and takes on the activities that have driven East Asian export growth.IntroductionConcern about China’s competitive threat is widespread (in developed economies like US as well as developing ones like Mexico), but is strongest in East and Southeast Asia. China’s burgeoning exports–backed by cheap and productive labor, a large stock of technical manpower, huge and diversified industrial sector, attractiveness to foreign investors, pragmatic use of industrial policy, and, now, freer access to world markets under WTO – lead to apocalyptic visions of export losses.2 China is most threatening to neighbors that rely primarily on low wages for their export advantage. However, as it upgrades its export structure, the more advanced economies (Singapore, Hong Kong, Korea and Taiwan) also fear for their competitiveness. The current hollowing out of their low-end manufacturing may soon extend to complex production, design, development and related services. Domestic markets are also threatened by China, but so far most attention seems to have been on exports.Offsetting this threat are the promise of the giant Chinese market (WTOaccession is only one of several initiatives to liberalize regional trade) and the potential for collaboration with it in exporting to the rest of the world. Trade within the East Asian region is flourishing. China is a growing importer from the region of natural resources that it does not possess. It is also raisin g imports of manufactured products. Its advanced neighbors are selling it sophisticated consumer and producer goods, and using it as a base for processing exports to third countries. The multinational companies (MNCs) that now account for around half of Chinese exports (and far more of its high technology exports, UNCTAD,2002) are incorporating China into production systems spanning the region (‘fragmentation’ and‘segmentation’ are used to describe this phenomenon3), so promoting considerable intra-firm trade with other regional bases. China’s own enterprises are likely to specialize with respect to reg ional counterparts and so raise intra-industry trade in differentiated products. Perhaps worryingly for competitors in other regions, such integration can lead China to complement regional competitiveness as a whole, rather than substitute its exports for those of its neighbors.It is difficult to assess, however, whether complementarily between China and the regional economies will fully offset its competitive threat. The dynamics and complexity of the interactions make it impossible to quantify the outcome, even to predict broad directions. The basic issue is whether China’s higher wage neighbors can move into more advanced export activities or functions rapidly enough to permit continued export expansion. If they can, they can continue with export-led growth. If they cannot, they will suffer export deceleration and/or a shift in specialization towards primary products or slow-growing segments of manufactured exports. The outcome, in other words, will depend on the relative growth of technological and other capabilities in Chinese and regional enterprises, with the former having such advantages as lower wages, larger scale economies, greater industrial depth, pools of technical skill and a proactive government. However, as East Asian countries differ widely in these factors (Lall, 2001), they face different kinds and intensity of competitive threat. The nature of the threat depends, moreover, on the organization of the production and marketing system: independent local firms are likely to compete more directl y than affiliates of thesame MNC spread over different countries in an integrated system.This paper does not try to measure China’s competitive threat or its effects, but to map relative export performance in the 1990s by technology and destination and so assess where the threat appears most intense. We focus on major East Asian exporters5 and on exports to third markets, but we also analyses complementarities between China and East Asia, particularly in electronics, the region’s largest export and the one where MNC systems dominate. As the 1990s predate China’s WTO accession, we do not go into the implications of this accession; however, the analysis of competitive trends has implications for the evolution of future trade by the region as liberalization grows.Background on Chinese export performanceChinese manufactured exports grew by 16.9% per annum over 1990-2000, compared to 6.4% for the world, 12.0% for all developing countries and 10.3% for the rest of East Asia. Its share of world manufactured exports rose from 1.7% to 4.4% over the decade and continued rising rapidly. 6 Thus, by 2002 China accounted for 5.1% of world merchandise exports; it was then the fifth largest exporter (after USA, Germany, Japan and France, and ahead of the UK). China’s share of developing world manufactured exports rose from 11% to 20% over the 1990s and of the East Asian region excluding China from 18.7% to 41.8%. Its export gains (see below) spanned the entire technological spectrum, and were most dynamic in the complex end of the range, in products that have recently driven the export growth of the rest of East Asia.This export surge is likely to be sustained for some time to come. China has ‘spare capacity’ in that its per capita exports are still relatively small,7 wages are much lower than in its main neighbors and it has large reserves of cheap and disciplined labor (though drawing it into exports will involve the cost of building links with the interior).8 More importantly, its advantages are not static (confined to cheap labor); they are upgrading rapidly. China is investing heavily in technology and advanced skills; for example, the share of the relevant age group enrolled in tertiary education rose from 9 percent in 1997 to 13 percent in 2000 (UNESCO website). It is exploiting the scale offered by its giant market to become competitive in capital-intensive activities beyond the reach of manyneighbors. It is using its diverse industrial base to deepen local content. It is drawing in export-oriented FDI at an impressive rate, using its market attractions to induce investors to raise local R&D and linkages; till now it has been able to impose performance requirements of the type soon to be banned under WTO rules.WTO accession may constrain China’s ability to use indust rial policy (Nolan, 2001) but it will also open up new export opportunities, particularly in textiles and garments.9 Accession may also enhance its domestic competitiveness: it will improve the investment climate for FDI, make imported inputs cheaper (for enterprises outside special export regimes) and induce faster restructuring of domestic enterprises (Ianchovichinaetal, 2003, and Lemoyne and Unal-Kesenci, 2002).Market share changes in major developed country marketsWe analyze market shares of China and its neighbors in three major markets: Japan, the US and West Europe, according to technology categories (Annex Table 1). In terms of value, the most important market for China in 2000 is the US ($49 billion), followed by Japan ($36 billion) and West Europe ($38 billion). However, the rest of the world is almost as large a destination for Chinese exports as these together ($106 billion in 2000) and within this the rest of East Asia is larger than any major OECD market by itself ($74.6 billion).The competitive position of each country can be analyzed in terms of the market share in 1990 and 2000 and the change over the decade. The annex table shows the following:Total manufactured exports: China does best in Japan, followed at some distance by the US. In common with most neighbors, its market share gain is weakest in West Europe. Korea loses market shares in both Japan and US, while Taiwan loses only in the US. Hong Kong’s loses market shares in all markets, particularly in the US and Japan. Like Taiwan, Singapore loses only in the US. The new Tigers gain share in all markets. With the exception of Indonesia, with a rather tepid performance, the others all gain most share in the Japanese market. Resource based products: China again leads the region in terms of market share increases, with a pattern similar to that for total exports. However, Korea has alarge gain in Japan, in contrast to Taiwan and Singapore, which lose shares; the latter two also lose in the US. Thailand is a big gainer in Japan while Indonesia and the Philippines lose out in the US. Low technology products: China’s massive market share gains are again concentrated in Japan. The four mature Tigers generally suffer losses in market share, but Singapore sees an increase in Japanese market share. The best overall performance among the new Tigers is by Indonesia.Medium technology products: While the Chinese pattern of success recurs, the new Tigers make significant gains in Japan and Korea incurs a significant loss. Taiwan and Singapore suffer losses in the US market. High technology exports: Taiwan again diverges from Korea in its performance in Japan, the former showing the second largest gain in the group (after China) and the latter the largest loss. In the US market, the situation is reversed, with Singapore joining Taiwan in losing market shares. Among the new Tigers, Malaysia and the Philippines are the big gainers in Japan, but the other two also benefit significantly. The Philippines is the second largest winner in the group in the US market. In sum, China’s main market share gains in the developed world are concentrated in Japan (though the US accounts for a larger dollar value of export growth). This is also true of its neighbors with the exceptions of Korea and Indonesia (Hong Kong was an all-round loser). To the extent that we can interpret market share changes to be causally related to China’s export surge, it would seem that the mature Tigers suffered the most from Chinese competition. The largest such loss is in low technology products, which is to be expected, but this not take into account the growth of LT exports by Korea and Taiwan to China. The relatively low gains by the lower-income new Tigers in LT may also reflect the impact of Chinese competition – without the offsetting increase in exports of intermediates to China.ConclusionsChina’s export surge has raised grave concerns in the region. While some of the apocalyptic predictions may have been overdone, it is certainly possible that rapid export growth by such a massive entrant will adversely affects export growth in its neighbors. As this analysis shows,however, the outcome is complex.For a start, the rise in China’s exports is matched by that in its imports – within the region its import growth outpaces its export growth. With appropriate restructuring of activities to match new competitive needs, its neighbors should be able to maintain high rates of export growth.There are two main drivers of regional exports to China. The first is to meet its burgeoning demand for imported products: primary products and resource-based manufactures that it cannot produce capital goods and intermediates for domestic -oriented production and more sophisticated consumer goods than its industry can currently provide. The second is to meet the needs of its export industries. This has two components: ‘processing’ activity in special economic zones that use imported inputs for export activities, and other exporters that also need imports. Processing activity is increasingly organized as part of integrated production systems, particularly its high technology segments, though some domestic oriented industries are also being plugged into this system as they realize scale and learning economies and become globally competitive. Both drivers are likely to continue into the foreseeable future, though their composition will change as Chinese and regional capabilities develop.中国竞争力的表现:是对东亚制成品出口的威胁吗?越来越多的东南亚和东亚地区关注中国出口的迅速增长所带来的竞争威胁,中国加入WTO后,更加剧了这种情况。
国贸专业外文文献翻译

外文文献原稿和译文原稿Introduction2010,Risks in Global MarketWhere there’s an opportunity,there’s a risk.Traders always face risks in any market,from the richest countries to the least developed economies. And as the global economic crisis changed markets,some risks for international trades might have been unveiled or worsened.The risks,which derive from the diversity and vicissitude of market structures,jurisdictions,commerce rules, cultures,languages,and even psychosociological factors,may exist in any sector and stage of the trade process,such as destination marketing,customs clearance,financial support,debts and solvencies,and adherence to WTO rules.A report by the Ministry of Commerce of China specified the risks of investing and doing business in many countries.Zhou Mi,an expert on the research panel,argued that the global market is undergoing a wave of restructuring and rebalancing because consumption in developed countries has waned and the emerging economies will accordingly wield greater influence in the world economy.The newest updates of this report will reveal more specifics, and some of them are listed here in advance.A senior manager from Ernst& Young analyzes the effect that corporate reshaping could have on customs clearance.China Export&Credit Insurance Corporation evaluates the risk factors in the financial systems and debt structures of some important markets.An expert from China’s Economic Diplomacy defines some risks created by WTO rules and offers advice on how to handle the risks.译文介绍2010年,在全球市场的风险那里是一个机会,还有一个风险。
国际贸易案例分析论文 英文版

Contents1.Introduction (1)2. The gains of International trade to the involved countries………………….……1.3.The effect of international trade (2)4.Negative impacts of International trade (3)5.Conclusion (3)6.Reference (4)1.IntroductionTo start with the issue, it’s necessary to know what is International trade at the very first beginning. International trade refers to those transactions that including the exchange of any kinds of sources among nations. The most possibly trading content is those what a country did not produce while its citizens have the demand of it .The demand for such goods has finally becomes a big net all over the world. It’s called International trade in modern society. Ancient people tried many ways to exchange from others, and till now International trade is still one of the main form of communications.2.The gains of International trade to the involved countriesAs the case showed, it’s easier to get touch with other country’s leader in nowadays. People have more opptunity to communicate with others outside nationwide. In order to cater the citizens’ demand for goods, governing class has th e responsibility to find the right international trade partners to bring benefits to it’s own people. The case said that with the increasing investment in Cambodia, both side were pleased about the result, such as a decreasing percentage of unemployed (for Cambodia, the exporting country), a movement of domestic economy and a better social life environment (for Singarpore, the importing country). (Ecological Economics,2012)The gains from international trade were not only in economy, but also in culture area. The exchange of goods brings the communications of different lifestyle. People from both sides could have a better understanding of each other that could strengthen the relationships between countries.In addiction, the exchange of service and technology accelerates the less developed countries to become more competitive in the world. On the other hand, those technologies could be transferred into resources for the exporting countries in theaction of trading. This relationship could be easily revealed in the case.3.The effect of international tradeInternational trade is not a politic issue, it reveals in people’s everyday life. Try to imagine that you could buy a tasty American fruit just in a nearby supermarket, or use a advanced computer you just see in a Japanese movie. It is even impossible to get an iPhone if there is no International trade! In order to get those goods outside the country, it is important to develop domestic industries so that the country could get things that its citizens want. By trading to other countries, the opportunities of self-development becomes easier than before. Numerous resources could be imported, in the process; citizens could get a better education environment and catch up new technologies just by a click. One has more choices in life and work. The world was connected as a whole.GDP, a numbers shows the income of production in nation, is an effective way to evaluate a nation’s competitive power. While a country was involved into International trade, the creation of national output and income is defiantly important to it. This could directly influence the sense of citizens’ happiness and satisfaction. (Journal of Cultural Economics, 1999) A country develops its main industries could exchange more valuable source from other countries.International Trade also influences the relationships over countries. Cooperation was placed in the first stage. The import and export actions shows the how the relationships between areas. It contributes to world peace and area development, solves the shortage and surplus problems. The case tells that Singapore’s investment increase causes a corresponding raising import from Cambodia, so the investment in Cambodia is worth doing for Singapore.4.Negative impacts of International tradeIn many aspects, International trade plays a key role in social life, otherwise, there were negative impacts to a country .The most remarkable phenomenon is protectionism. Many countries charges a high tariff to the imported, as a result, the price of imported goods would be raise. When citizens were choosing what to buy, the cheaper home goods would possibly be their choice, and the International trade would be restricted, though domestic industries have got protected, it is harmful to the free market. At this point, Singapore has little protectionism and most import goods were duty-free in nation. Trading protection is not only a disaster in political communication, but also a disaster for the domestic industries. The development of native industries would be slow down or stopped. The consequence could separate in many fields.As mentioned above, protectionism is not fit to the principle of comparative advantages, while a phenomenon called dumping is also remarkable. Governments noticed that this phenomenon should be controlled in a rational level, many countries even set laws to punish those companies which dumping goods in others areas. Dumping would cause the importing country suffer from the unfair economic competition, many native labors would lie out from their positions, GDP may decrease and the development of the country would be limited (Smith Thomas, 1998) The negative impacts sometimes hide behind short-time benefit. Some laws works only in a very short period and then cause big problems. Refer s to Singapore’s attitude towards trade policy, there was little possibility to cause such negative result. An open market is always welcomed and safe in any situations.5.ConclusionHaving been pointed out so many views about International trade, and connecting tothe case given above, it is obviously to see that Mr. S.Iswaran’s trip to Cambodia would works well on strengthening two sides’ business ties. With a more frequent communication and an increasing investment in Cambodia, this kind of International trade could bring both economic and cultural benefits to the people from each side. As the statement said in the case, the rising data showing that two countries were enjoy the achievement from International trade. Singapore’s trade policy should be an example to other countries. Over International trade, a less development country could become a unit that dependent on itself. (Advanced International Trade, 2001). On the long run, it is believed that two countries would develop their advantages in the process as the business ties becoming more and more tight.ReferencesSmith, Thomas (1998)“The Addiction to Culture”. Paper presented on the biannual meeting of the Association for Cultural Economics International in Barcelona, June14–17,1998.Harken, P. (2010). The ecology of commerce: A declaration of sustainability. Harper Business.7(1),43-1Throsby, David (1999) Cultural Capital. Journal of Cultural Economics 23: 3-12(this issue).Tinbergen, Jan (1962)Shaping the World Economy: Suggestion for an International Economic Policy. Twentieth Century Fund, New York.Robert C. Fenestra (2001), Advanced International Trade.。
国际贸易英文文献
Strategic transformations in Danish and Swedish big business in an era of globalisation, 1973-2008The Danish and Swedish contextIn the difficult inter-war period, a state-supported, protected home market orientation had helped stabilise both Denmark’s and Sweden’s economies, but after WorldWar II priorities changed. Gradually and in accordance with the international economic development, restrictions on foreign trade were removed, and Danish and Swedish industry was exposed to international competition. As a consequence, several home market oriented industries –such as the textile and the shoe industry –were more or less outperformed, while in Sweden the engineering industry soon became the dominant leader of Swedish industry, with companies such as V olvo, Ericsson, Electrolux, ASEA and SKF. In the Danish case, the SMEs continued to be dominant but in combination with expanding export oriented industrial manufacturers such as Lego, Danfoss, Carlsberg and the shipping conglomerates ok and A.P. moller-Marsk.In Sweden and Denmark stable economic growth continued into the 1970s, but due to the problems during the oil crises, the economies came into fundamental structural troubles for the first time since World War II. In the beginning this was counteracted by traditional Keynesian policy measures. However, because of large budget deficits, inflation and increasing wages, both the Danish economy from 1974 and the Swedish economy from 1976 encountered severe problems. Towards the late 1970s Denmark’s and Sweden’s economic policies were thus increasingly questioned. It was clear that Keynesian policy could not solve all economic problems. Expansive fiscal policies in terms of continued deficits on the state budget could not compensate for the loss of both national and international markets and step by step the Keynesian economic policy was abandoned.The increased budget deficit also made it difficult for the state to support employment and regional development. These kinds of heavy governmental activities were also hardly acceptable under the more market oriented policy that developed first in Great Britain and the USA, but in the 1980s also in Denmark and Sweden (Iversen & Andersen, 2008, pp. 313–315; Sjo¨ gren, 2008, pp. 46–54).These changes in political priorities were especially noticeable in the financial market. After being the most state regulated and coordinated sector of the economy since the 1950s, then between 1980 and 1985 the Danish and Swedish financial markets underwent an extensive deregulation resulting in increased competition. Lending from banks and other credit institutes was no longer regulated, and neither were interest rates. The bond market was also opened as the issuance of new bond loans was deregulated in Sweden in 1983. When the control of foreign capital flows was liberalised in the late 1980s the last extraordinary restriction was now gone. Together with the establishment of the new money market with options and derivates, this opened up to a much larger credit market and the possibility for companies to finance investments and increase business domestically as well as abroad (Larsson, 1998, pp. 205–207).Another important part of the regulatory changes in the early 1980s were new rules for the Copenhagen and Stockholm stock exchanges. Introduction on the stock exchange was made mucheasier, which enabled small and medium sized companies as well as newly established companies to enter the stock exchange. This resulted in a sharp increase in turnover at the stock exchange, encompassing both newly established companies and the traditional big enterprises. This helped undermine the bank oriented financial system that had been established in the late nineteenth century. However, the strong connections between the largest industrial companies and the dominating domestic commercial banks prevailed in the 1980s and 1990s.The change in political priorities was also seen in the handling of state-owned companies. In Sweden, the general economic crisis of the 1970s resulted in the takeover of several large companies by the state. Even the liberal and conservative parties – who were in cabinet towards the end of the 1970s –supported this policy.But with the return of the social democrats to government, this part of state ownership was questioned and a slow privatisation began. The introduction of Sweden’s new economic market oriented regime was certain in 1995, when the country became a member of the European Union.In contrast to Sweden, the economic crisis of the 1970s had not led to any increase in Danish state ownership. The separation between private industrial ownership and public state functions was deeply rooted in Danish capitalism. Denmark became a member of the European Community on 1 January 1973 even though the membership had few political–economic consequences until the early 1980s when a new dynamic phase in European integration began.With a growing international market and less restrictive national regulation – especially on the financial market – it became possible for the largest Danish and Swedish companies to increase their investments in foreign markets. In the Swedish case several were members of the two dominating banking groups. As a consequence, the share of these groups in total industrial employment increased to over 50% in the late 1980s (Lindgren, 2011). In Denmark the ratio between the revenue of the 10 largest corporations and GDP was 0.47 in 2006, while the ratio was only 0.23 in 1994 and 0.11 in 1982. These statistics illustrate the importance of large companies in the industrial sector in both countries. In Denmark, the growth of these largest internationalised corporations took place simultaneously with a continued importance of small and medium sized enterprises. The Swedish industrial structure was, on the other hand, marked by comparatively few medium sized companies and a bulk of small-scale companies with one or only a few employees. In the 2008 FT Global 500 ranking, Denmark had two companies while Sweden had six. This can be compared with 10 in Italy and 26 in the United Kingdom. Both these countries are more than six times larger –in population –than Sweden, which highlights the role of big business in Sweden.A new category of Danish and Swedish companies managed to establish themselves as global enterprises in the 1980s and 1990s. For example, the Swedish giants IKEA and H&M increased their positions with the help of comparatively cheap products and new ways of organising distribution, while the global Danish Business History 123 Downloaded By: [2011 DRAA SSH Free Trial Consortium] At: 13:29 16 June 2011 brewing company Carlsberg and the leading North European dairy ARLA Foods grew primarily through cross-border mergers and acquisitions. Since these companies were established in non-traditional areas for Danish and Swedish big business and also based on international production networks, they stand out as representatives for the new type of enterprise that could benefit from Denmark’s and Sweden’s new economic policy and integration in the global economy. This article concerns the strategic development and growth ofthis new type of enterprise, considered in the light of economic integration and the new political regime.Analysis of changing growth strategies and ownership regimes, 1973–2008 Sample selection, sources and definitionsThe following analysis is focused on the changing growth strategies of the 25 largest Swedish and Danish non-financial corporations measured by revenue. The analysis provides for an inclusive approach. The original Harvard Program and Whittington and Mayer’s (2000) study concerned manufacturing enterprises, and this approach made sense in the 1960s and 1970s when the relative importance of the service sector was less significant.5 We define Danish and Swedish corporations in a similarly inclusive way as any corporation registered in the country at the given time. This approach also contrasts the samples of Whittington and Mayer and the Dutch chapter in this special issue.We have decided to include foreign-owned corporations, as the increasing economic integration process also encompasses new non-national ownership regimes, which is very much the case of large foreign subsidiaries and in later years also ownership by foreign private equity funds. The assumption is that by registering large corporations in the national context of Denmark and Sweden, these corporations mirror the specific structure of a corporate landscape. That landscape might be dominated by international subsidiaries – see for instance Binda and I versen’s (2007) similar study of the Spanish development.The analysis covers the period from 1973 to 2008 and we have chosen five benchmark years: 1973, 1983, 1993, 2003 and 2008. This selection makes it possible to compare our results with the findings of Whittington andMayer (2000) and Binda and Iversen (2007). The data consists of a combination of annual reports, the database ‘Mapping Corporate Denmark’ and various written overviews of the corporate annual accounts.The selection of the 25 largest companies has been made from published secondary compilations based on annual reports. The majority of the information concerning specific companies is based on annual reports, which in general are both extensive and reliable. Thus, they contain information about the turnover in national markets as well as different international markets. This information is essential for the analysis of the geographical market structure of the different companies. The companies have been divided into four internationalisation categories defined as follows: home market orientation implies less than 10% activities abroad; partly home market orientation, foreign sales 10–50%; partly internationally oriented, 50–90%; while the foreign revenues of an internationally oriented company exceed 90%.The annual reports are also quite extensive in describing the turnover of the companies for different business activities. From this information calculations have been made to evaluate the size of diversification for each company. Four strategic categories of diversification have been used. The first category contains companies where the core business accounts for at least 95% of the firm’s turnover. We have124 M.J. Iversen and M. Larsson Downloaded By: [2011 DRAA SSH Free Trial Consortium] At: 13:29 16 June 2011 defined the critical term ‘single type of business activity’ in accordance with the twodigit ISIC Rev. 3.1 code.7 Dominant business strategy implies a core business accounting for 70–95% of total turnover. Firms with a related or unrelated business have no single business larger than 70% of total turnover. Unrelated implies that there is no relation to the original business area which we have defined as an activity within adifferent ISIC Rev. one-digit code which separates sectors such as manufacturing, transport and construction.In the cases of company ownership, information in annual reports is fragmented and calculations have been done by using other sources. For the Swedish companies, information has been gathered from annual compilations made by Sundqvist, while the Danish information is based upon the Copenhagen Business School database ‘Mapping Corporate Denmark, 1970–2003’.8The analysis of ownership is broadly divided into two categories: dispersed and concentrated. Dispersed ownership is defined as no shareholder controlling more than 10% of the voting stocks.9 The concentrated ownership group (companies with single owners above 10% of the voting stocks) is divided into seven sub-categories in which the corporation is catalogued in accordance to the single largest shareholder: Personal, Bank-Financial, State, Firm, Foreign, Cooperative and Foundation.Changing ownership structuresChanging ownership structure in Sweden, 1973–2008Ownership in Swedish industry has previously been analysed basically from a company perspective, but among those few overarching studies which scrutinize different owners from a macro perspective, the studies by Glete (1987, 1994) are probably the most important. In his study from 1994 he defines three major owner groups in the Swedish economy: the banking groups, the large financial families and big private companies engaged in the establishment of large conglomerates. Among these different owners, the Wallenberg family held a special role in the Swedish private economy and their situation has been and is unique. As the controlling owner of the SEB bank, and several investment companies of which Investor is currently the most important, the Wallenberg family has played a decisive role for Swedish big business since the early twentieth century.10Family groups have been the most important owners among the largest companies, seen over the whole period (Figure 1). The Wallenberg group also holds the strongest position among the family-owned companies. Between four and six of the 25 largest companies each year were controlled by the Wallenberg family, with a voting share of 28–36% on average in the controlled companies. Among these companies we especially find companies from the engineering industry, such as ASEA/ABB, Atlas Copco, Electrolux and Saab-Scania. This gave the family a comparatively strong position in the Swedish economy. However, with the deregulation of the financial market and altered rules on the Stockholm Stock Exchange, it became financially possible for new capitalists to challenge the position of the Wallenbergs.Despite new regulations and a global economy, family ownership has managed to survive. Strong holdings, not only by the Wallenberg’s but also other large family groups, made it possible to maintain family ownership as a foundation for the Swedish economy. The important role of strong owners in Swedish big business is also shown in the relatively few companies with dispersed ownership.Another important trend in the development among Swedish large corporations has been the increasing role of the state as a major owner. Part of the reason for this was the increased nationalisation activity due to the crisis in the 1970s where several private companies encountered economic problems. The problems especially hit the iron and steel industry and the large shipyards, and to avoid liquidations and high regional unemployment rates, the government decided to takeover these activities. Thus, two new large state-owned companies were created to run these businesses –Svenska Varv (shipyards) and SSAB (steel) –and they were both among the 25 largest companies in 1983. However, the state-owned sector did not only expand as an effect of the crises. During the first half of the 1980s, state-owned activities were gradually removed from the state budget and instead formed as separate corporations. This was the first step towards a privatisation of the public sector, and thus a part of the general regime change in the 1980s.Another fundamental change in the ownership structure of large Swedish companies is the growing importance of foreign owners. Sweden went from predominantly being a net capital exporter, to becoming an increasingly attractive country for foreign direct investments in the latter half of the 1990s. Several mergers took place which resulted in the dominance of foreign ownership in previously Swedish-owned companies, and global companies were established on the Swedish market. Among these companies we find.。
世界贸易和国际贸易外文文献及中文翻译
World Trade and International TradeIn today’s complex economic world, neither individuals nor nations are self-sufficient. Nations have utilized different economic resources; people have developed different skills. This is the foundation of world trade and economic activity. As a result of this trade and activity, international finance and banking have evolved.For example, the United States is a major consumer of coffee, yet it does not have the climate to grow any or its own. Consequently, the United States must import coffee from countries (such as Brazil, Colombia and Guatemala) that grow coffee efficiently. On the other hand, the United States has large industrial plants capable of producing a variety of goods, such as chemicals and airplanes, which can be sold to nations that need them. If nations traded item for item, such as one automobile for 10,000 bags of coffee, foreign trade would be extremely cumbersome and restrictive. So instead of batter, which is trade of goods without an exchange of money, the United State receives money in payment for what it sells. It pays for Brazilian coffee with dollars, which Brazil can then use to buy wool from Australia, which in turn can buy textiles Great Britain, which can then buy tobacco from the United State.Foreign trade, the exchange of goods between nations, takes place for many reasons. The first, as mentioned above is that no nation has all of the commodities that it needs. Raw materials are scattered around the world. Large deposits of copper are mined in Peru and Zaire, diamonds are mined in South Africa and petroleum is recovered in the Middle East. Countries that do not have these resources within their own boundaries must buy from countries that export them.Foreign trade also occurs because a country often does not have enough of a particular item to meet its needs. Although the United States is a major producer of sugar, it consumes more than it can produce internally and thus must import sugar.Third, one nation can sell some items at a lower cost than other countries. Japan has been able to export large quantities of radios and television sets because it can produce them more efficiently than other countries. It is cheaper for the United States to buy these from Japan than to produce them domestically. According to economic theory, Japan should produce and export those items from which it derives a comparative advantage. It should also buy and import what it needs from those countries that have a comparative advantage in the desired items.Finally, foreign trade takes place because of innovation or style. Even though the United States produces more automobiles than any other country, it still imports large numbers of autos from Germany, Japan and Sweden, primarily because there is a market for them in the United States.For most nations, exports and imports are the most important international activity. When nations export more than they import, they are said to have a favorable balance of trade. When they import more than they export, an unfavorable balance of trade exists. Nations try to maintain a favorable balance of trade, which assures them of the means to buy necessary imports.International trade is the exchange ofgoods and services produced in one country for goods and services produced in another country. There are several reasons for it.The distribution lf natural resources around the world is somewhat haphazard: some nations possess natural deposits in excess of their own requirements while other nations have none. For example, Britain has large reserves of coal but lacks many minerals such as nickel, copper, aluminum etc, whereas the Arab states have vast oil deposits but little else. In the cultivation of natural products climates whereas others, such as citrus fruits, require a Mediterranean climate. Moreover, some nations are unable to produce sufficient of a particular product to satisfy a large home demand, for example, Britain and wheat. These are the reasons why international trade first began.With the development of manufacturing and technology, there arose another incentive for nations to exchange their products. It was found that it made economic sense for a nation to specialize in certain activities and produce those goods for which it had the most advantages, and to exchange those goods for the products of other nations which and advantages in different fields. This trade is based on the principle of comparative advantage.The theory of comparative advantage, also called the comparative cost theory, was developed by David Ricardo, and other economists in the nineteenth century. It points out that trade between countries can be profitable for all, even if one of the countries can produce every commodity more cheaply. As long as there are minor, relative differences in the efficiency of producing a commodity even the poof country can have a comparative advantage in producing it. The paradox is best illustrated by this traditional example: the best lawyer in town is also the best typist in town. Since this lawyer cannot afford to give up precious time from legal and typing matters. But the typist’s comparative disadvantage is least in typing. Therefore, the typist has a relative comparative advantage in typing.This principle is the basis of specialization into trades and occupations. At the same time, complete specialization may never occur even when it is economically advantageous. For strategic or domestic reasons, a country may continue to produce goods for which it does not have an advantage. The benefits lf specialization may also be affecting by transport costs: goods and raw materials have to be transported around the world and the cost of the transport narrows the limits between which it will prove profitable to trade. Another impediment to the free flow of goods between nations is the possible introduction of artificial barriers to trade, such as tariffs or quotas.In addition to visible trade, which involves the import and export lf goods and merchandise, there is also invisible trade, which involves the exchange of services between nations.Nations such as Greece and Norway have large marine fleets and provide transportation service. This is a kind of invisible trade. When an exporter arranges shipment, he rents space in the cargo compartment or a ship.The prudent e xporter purchases insurance for his cargo’s voyage. While at sea, a cargo is vulnerable to many dangers. Thus, insurance is another service in which some nations specialize. Great Britain, becauseof the development of Lloyd’s of London, is a leading expor ter of this service, earning fees for insuring other nations’ foreign trade.Some nations possess little in the way of exporter commodities or manufactured goods, but they have a mild and sunny climate. During the winter, the Bahamas attract large numbers of countries, who spend money for hotel accommodations, meals, taxis, and so on. Tourism, therefore, is another form of invisible trade.Invisible trade can be as important to some nations as the export of raw materials or commodities is to other. In both cases, the nations as the export of raw materials or commodities is to other. In both cases, the nations earn money to buy necessities.International trade today little resembles European commerce as it existed between the 16th century and the 19th century. Trade in earlier times was conducted largely between a mother country and its colonies. It was conducted according to strict mercantilist principles. The colonies were supposed to supply the mother country with raw materials, and they were expected to buy all finished goods from the mother country. Other forms of trade were forbidden to the colonies, but many of them evaded these restrictions.A result of the Industrial Revolution, which began in England in the 18th century, was the transformation of trade from a colonial exchange into a many sided international institution. Cottage industries gave way to mass production in factories. Railroads and steamships lowered the cost of transportation at the same time that new markets were being sought for the expanding output of goods.The Industrial Revolution also brought an end to mercantilist policies. The laissez-faire attitudes that emerged in their stead permitted businessmen to manufacture what they pleased and to trade freely with other nations. Trade was also stimulated by the growth of banking facilities, insurance companies, and improved commercial shipping and communications.The repeal of the Corn Laws by Great Britain in 1846 ended Britain’s longstanding policy of protectionism. During the 19th century, many European nations made commercial agreements with each other easing their tariff rates. Lower tariffs and the growth of population and industry caused trade to soar in the 19th century.In the 20th century two world wars and a major depression caused severe disturbances in international trade. Nations, sensing a threat to their domestic economies, sought to protect themselves from further disturbances by erecting various barriers to trade.The situation became even worse after Great Britain abandoned the gold standard. The nations that were closely related to Britain, including most of the members of the Commonwealth of gold standard. As the means of making international payments broke down and trade restrictions increased, some countries had to resort to barter to obtain foreign goods.International trade was in such severe straits during the depression that a World Economic Conference was held in 1933. This conference, however, was unable to halt a rash of currency devaluations, tariff increases, and quota arrangements.In 1934, U.S. Secretary of State Cordell Hull persuaded Congress to pass the Reciprocal Trade Agreements Act. This law authorized the President to negotiate tariff cuts with other nations. The Reciprocal Trade Act provided for protection of U.S. industries in the event foreign imports increased to such a degree that U.S. businesses were injured. This protection included peril point and escape clauses under which tariff cuts could by refused of rescinded if a U.S. industry suffered economic hardship. Despite the protectionist clauses in the act, U.S. tariffs were substantially reduced.Shortly before the end of World War Ⅱ, members of the United Nations met at Bratton Woods, N.H. to discuss ways of reducing the financial barriers to international trade. The International Monetary Fund was established as a result of the conference. The fund was designed to encourage the growth of international trade by stabilizing currencies and their rate of foreign exchange.In the early postwar period, more than 20 nations met in Geneva, Switzerland, to negotiate tariff reductions. When any two nations reached an agreement to reduce tariffs on a product, the benefits were extended to all participating nations. This was an application of the so-called most favored nation clause.The Geneva tariff agreements were written into the General Agreement on Tariffs and Trade (GATT). GATT also established standards for the conduct of international trade. Fox example, the agreement prohibits nations from placing quotas of limits on imports, except under very special circumstances.After World War Ⅱ a number of free trade areas were formed to solve trade problems on a regional basis. Tariffs on goods moving within these areas were to be abolished. Some of the groups also erected a single tariff on the goods of outsiders coming into their common area. Such groups are called customs unions. The goal of all trade blocs was to merge small political units into large geographic entities in which goods could be freely manufactured and sold. A large market area greatly stimulates economic growth and prosperity. These trade blocs are: Benelux, The European Coal and Steel Community (ECSC), the European Economic Community (EEC or Common Market), the European Free Trade Association (EFTA), the Council for Mutual Economic Assistance (COMECOM), the Latin American Free Trade Association (LAFTA), the Central American Common Market (CACM), the Caribbean Free Trade Area (CARIFTA), the Caribbean Community and Common Market (CARICOM).世界贸易和国际贸易在当今复杂的经济世界个人和国家都不是自给自足。
- 1、下载文档前请自行甄别文档内容的完整性,平台不提供额外的编辑、内容补充、找答案等附加服务。
- 2、"仅部分预览"的文档,不可在线预览部分如存在完整性等问题,可反馈申请退款(可完整预览的文档不适用该条件!)。
- 3、如文档侵犯您的权益,请联系客服反馈,我们会尽快为您处理(人工客服工作时间:9:00-18:30)。
Strategic transformations in Danish and Swedish big business in an era of globalisation, 1973-2008The Danish and Swedish contextIn the difficult inter-war period, a state-supported, protected home market orientation had helped stabilise both Denmark’s and Sweden’s economies, but after WorldWar II priorities changed. Gradually and in accordance with the international economic development, restrictions on foreign trade were removed, and Danish and Swedish industry was exposed to international competition. As a consequence, several home market oriented industries –such as the textile and the shoe industry –were more or less outperformed, while in Sweden the engineering industry soon became the dominant leader of Swedish industry, with companies such as V olvo, Ericsson, Electrolux, ASEA and SKF. In the Danish case, the SMEs continued to be dominant but in combination with expanding export oriented industrial manufacturers such as Lego, Danfoss, Carlsberg and the shipping conglomerates ok and A.P. moller-Marsk.In Sweden and Denmark stable economic growth continued into the 1970s, but due to the problems during the oil crises, the economies came into fundamental structural troubles for the first time since World War II. In the beginning this was counteracted by traditional Keynesian policy measures. However, because of large budget deficits, inflation and increasing wages, both the Danish economy from 1974 and the Swedish economy from 1976 encountered severe problems. Towards the late 1970s Denmark’s and Sweden’s economic policies were thus increasingly questioned. It was clear that Keynesian policy could not solve all economic problems. Expansive fiscal policies in terms of continued deficits on the state budget could not compensate for the loss of both national and international markets and step by step the Keynesian economic policy was abandoned.The increased budget deficit also made it difficult for the state to support employment and regional development. These kinds of heavy governmental activities were also hardly acceptable under the more market oriented policy that developed first in Great Britain and the USA, but in the 1980s also in Denmark and Sweden (Iversen & Andersen, 2008, pp. 313–315; Sjo¨ gren, 2008, pp. 46–54).These changes in political priorities were especially noticeable in the financial market. After being the most state regulated and coordinated sector of the economy since the 1950s, then between 1980 and 1985 the Danish and Swedish financial markets underwent an extensive deregulation resulting in increased competition. Lending from banks and other credit institutes was no longer regulated, and neither were interest rates. The bond market was also opened as the issuance of new bond loans was deregulated in Sweden in 1983. When the control of foreign capital flows was liberalised in the late 1980s the last extraordinary restriction was now gone. Together with the establishment of the new money market with options and derivates, this opened up to a much larger credit market and the possibility for companies to finance investments and increase business domestically as well as abroad (Larsson, 1998, pp. 205–207).Another important part of the regulatory changes in the early 1980s were new rules for the Copenhagen and Stockholm stock exchanges. Introduction on the stock exchange was made mucheasier, which enabled small and medium sized companies as well as newly established companies to enter the stock exchange. This resulted in a sharp increase in turnover at the stock exchange, encompassing both newly established companies and the traditional big enterprises. This helped undermine the bank oriented financial system that had been established in the late nineteenth century. However, the strong connections between the largest industrial companies and the dominating domestic commercial banks prevailed in the 1980s and 1990s.The change in political priorities was also seen in the handling of state-owned companies. In Sweden, the general economic crisis of the 1970s resulted in the takeover of several large companies by the state. Even the liberal and conservative parties – who were in cabinet towards the end of the 1970s –supported this policy.But with the return of the social democrats to government, this part of state ownership was questioned and a slow privatisation began. The introduction of Sweden’s new economic market oriented regime was certain in 1995, when the country became a member of the European Union.In contrast to Sweden, the economic crisis of the 1970s had not led to any increase in Danish state ownership. The separation between private industrial ownership and public state functions was deeply rooted in Danish capitalism. Denmark became a member of the European Community on 1 January 1973 even though the membership had few political–economic consequences until the early 1980s when a new dynamic phase in European integration began.With a growing international market and less restrictive national regulation – especially on the financial market – it became possible for the largest Danish and Swedish companies to increase their investments in foreign markets. In the Swedish case several were members of the two dominating banking groups. As a consequence, the share of these groups in total industrial employment increased to over 50% in the late 1980s (Lindgren, 2011). In Denmark the ratio between the revenue of the 10 largest corporations and GDP was 0.47 in 2006, while the ratio was only 0.23 in 1994 and 0.11 in 1982. These statistics illustrate the importance of large companies in the industrial sector in both countries. In Denmark, the growth of these largest internationalised corporations took place simultaneously with a continued importance of small and medium sized enterprises. The Swedish industrial structure was, on the other hand, marked by comparatively few medium sized companies and a bulk of small-scale companies with one or only a few employees. In the 2008 FT Global 500 ranking, Denmark had two companies while Sweden had six. This can be compared with 10 in Italy and 26 in the United Kingdom. Both these countries are more than six times larger –in population –than Sweden, which highlights the role of big business in Sweden.A new category of Danish and Swedish companies managed to establish themselves as global enterprises in the 1980s and 1990s. For example, the Swedish giants IKEA and H&M increased their positions with the help of comparatively cheap products and new ways of organising distribution, while the global Danish Business History 123 Downloaded By: [2011 DRAA SSH Free Trial Consortium] At: 13:29 16 June 2011 brewing company Carlsberg and the leading North European dairy ARLA Foods grew primarily through cross-border mergers and acquisitions. Since these companies were established in non-traditional areas for Danish and Swedish big business and also based on international production networks, they stand out as representatives for the new type of enterprise that could benefit from Denmark’s and Sweden’s new economic policy and integration in the global economy. This article concerns the strategic development and growth ofthis new type of enterprise, considered in the light of economic integration and the new political regime.Analysis of changing growth strategies and ownership regimes, 1973–2008 Sample selection, sources and definitionsThe following analysis is focused on the changing growth strategies of the 25 largest Swedish and Danish non-financial corporations measured by revenue. The analysis provides for an inclusive approach. The original Harvard Program and Whittington and Mayer’s (2000) study concerned manufacturing enterprises, and this approach made sense in the 1960s and 1970s when the relative importance of the service sector was less significant.5 We define Danish and Swedish corporations in a similarly inclusive way as any corporation registered in the country at the given time. This approach also contrasts the samples of Whittington and Mayer and the Dutch chapter in this special issue.We have decided to include foreign-owned corporations, as the increasing economic integration process also encompasses new non-national ownership regimes, which is very much the case of large foreign subsidiaries and in later years also ownership by foreign private equity funds. The assumption is that by registering large corporations in the national context of Denmark and Sweden, these corporations mirror the specific structure of a corporate landscape. That landscape might be dominated by international subsidiaries – see for instance Binda and I versen’s (2007) similar study of the Spanish development.The analysis covers the period from 1973 to 2008 and we have chosen five benchmark years: 1973, 1983, 1993, 2003 and 2008. This selection makes it possible to compare our results with the findings of Whittington andMayer (2000) and Binda and Iversen (2007). The data consists of a combination of annual reports, the database ‘Mapping Corporate Denmark’ and various written overviews of the corporate annual accounts.The selection of the 25 largest companies has been made from published secondary compilations based on annual reports. The majority of the information concerning specific companies is based on annual reports, which in general are both extensive and reliable. Thus, they contain information about the turnover in national markets as well as different international markets. This information is essential for the analysis of the geographical market structure of the different companies. The companies have been divided into four internationalisation categories defined as follows: home market orientation implies less than 10% activities abroad; partly home market orientation, foreign sales 10–50%; partly internationally oriented, 50–90%; while the foreign revenues of an internationally oriented company exceed 90%.The annual reports are also quite extensive in describing the turnover of the companies for different business activities. From this information calculations have been made to evaluate the size of diversification for each company. Four strategic categories of diversification have been used. The first category contains companies where the core business accounts for at least 95% of the firm’s turnover. We have124 M.J. Iversen and M. Larsson Downloaded By: [2011 DRAA SSH Free Trial Consortium] At: 13:29 16 June 2011 defined the critical term ‘single type of business activity’ in accordance with the twodigit ISIC Rev. 3.1 code.7 Dominant business strategy implies a core business accounting for 70–95% of total turnover. Firms with a related or unrelated business have no single business larger than 70% of total turnover. Unrelated implies that there is no relation to the original business area which we have defined as an activity within adifferent ISIC Rev. one-digit code which separates sectors such as manufacturing, transport and construction.In the cases of company ownership, information in annual reports is fragmented and calculations have been done by using other sources. For the Swedish companies, information has been gathered from annual compilations made by Sundqvist, while the Danish information is based upon the Copenhagen Business School database ‘Mapping Corporate Denmark, 1970–2003’.8The analysis of ownership is broadly divided into two categories: dispersed and concentrated. Dispersed ownership is defined as no shareholder controlling more than 10% of the voting stocks.9 The concentrated ownership group (companies with single owners above 10% of the voting stocks) is divided into seven sub-categories in which the corporation is catalogued in accordance to the single largest shareholder: Personal, Bank-Financial, State, Firm, Foreign, Cooperative and Foundation.Changing ownership structuresChanging ownership structure in Sweden, 1973–2008Ownership in Swedish industry has previously been analysed basically from a company perspective, but among those few overarching studies which scrutinize different owners from a macro perspective, the studies by Glete (1987, 1994) are probably the most important. In his study from 1994 he defines three major owner groups in the Swedish economy: the banking groups, the large financial families and big private companies engaged in the establishment of large conglomerates. Among these different owners, the Wallenberg family held a special role in the Swedish private economy and their situation has been and is unique. As the controlling owner of the SEB bank, and several investment companies of which Investor is currently the most important, the Wallenberg family has played a decisive role for Swedish big business since the early twentieth century.10Family groups have been the most important owners among the largest companies, seen over the whole period (Figure 1). The Wallenberg group also holds the strongest position among the family-owned companies. Between four and six of the 25 largest companies each year were controlled by the Wallenberg family, with a voting share of 28–36% on average in the controlled companies. Among these companies we especially find companies from the engineering industry, such as ASEA/ABB, Atlas Copco, Electrolux and Saab-Scania. This gave the family a comparatively strong position in the Swedish economy. However, with the deregulation of the financial market and altered rules on the Stockholm Stock Exchange, it became financially possible for new capitalists to challenge the position of the Wallenbergs.Despite new regulations and a global economy, family ownership has managed to survive. Strong holdings, not only by the Wallenberg’s but also other large family groups, made it possible to maintain family ownership as a foundation for the Swedish economy. The important role of strong owners in Swedish big business is also shown in the relatively few companies with dispersed ownership.Another important trend in the development among Swedish large corporations has been the increasing role of the state as a major owner. Part of the reason for this was the increased nationalisation activity due to the crisis in the 1970s where several private companies encountered economic problems. The problems especially hit the iron and steel industry and the large shipyards, and to avoid liquidations and high regional unemployment rates, the government decided to takeover these activities. Thus, two new large state-owned companies were created to run these businesses –Svenska Varv (shipyards) and SSAB (steel) –and they were both among the 25 largest companies in 1983. However, the state-owned sector did not only expand as an effect of the crises. During the first half of the 1980s, state-owned activities were gradually removed from the state budget and instead formed as separate corporations. This was the first step towards a privatisation of the public sector, and thus a part of the general regime change in the 1980s.Another fundamental change in the ownership structure of large Swedish companies is the growing importance of foreign owners. Sweden went from predominantly being a net capital exporter, to becoming an increasingly attractive country for foreign direct investments in the latter half of the 1990s. Several mergers took place which resulted in the dominance of foreign ownership in previously Swedish-owned companies, and global companies were established on the Swedish market. Among these companies we find.。