外文翻译
本科毕业论文外文翻译【范本模板】

本科毕业论文外文翻译外文译文题目:不确定条件下生产线平衡:鲁棒优化模型和最优解解法学院:机械自动化专业:工业工程学号: 201003166045学生姓名: 宋倩指导教师:潘莉日期: 二○一四年五月Assembly line balancing under uncertainty: Robust optimization modelsand exact solution methodÖncü Hazır , Alexandre DolguiComputers &Industrial Engineering,2013,65:261–267不确定条件下生产线平衡:鲁棒优化模型和最优解解法安库·汉泽,亚历山大·多桂计算机与工业工程,2013,65:261–267摘要这项研究涉及在不确定条件下的生产线平衡,并提出两个鲁棒优化模型。
假设了不确定性区间运行的时间。
该方法提出了生成线设计方法,使其免受混乱的破坏。
基于分解的算法开发出来并与增强策略结合起来解决大规模优化实例.该算法的效率已被测试,实验结果也已经发表。
本文的理论贡献在于文中提出的模型和基于分解的精确算法的开发.另外,基于我们的算法设计出的基于不确定性整合的生产线的产出率会更高,因此也更具有实际意义。
此外,这是一个在装配线平衡问题上的开创性工作,并应该作为一个决策支持系统的基础。
关键字:装配线平衡;不确定性; 鲁棒优化;组合优化;精确算法1.简介装配线就是包括一系列在车间中进行连续操作的生产系统。
零部件依次向下移动直到完工。
它们通常被使用在高效地生产大量地标准件的工业行业之中。
在这方面,建模和解决生产线平衡问题也鉴于工业对于效率的追求变得日益重要。
生产线平衡处理的是分配作业到工作站来优化一些预定义的目标函数。
那些定义操作顺序的优先关系都是要被考虑的,同时也要对能力或基于成本的目标函数进行优化。
就生产(绍尔,1999)产品型号的数量来说,装配线可分为三类:单一模型(SALBP),混合模型(MALBP)和多模式(MMALBP)。
外文翻译中英文对照

Strengths优势All these private sector banks hold strong position on CRM part, they have professional, dedicated and well-trained employees.所以这些私人银行在客户管理部分都持支持态度,他们拥有专业的、细致的、训练有素的员工。
Private sector banks offer a wide range of banking and financial products and financial services to corporate and retail customers through a variety of delivery channels such as ATMs, Internet-banking, mobile-banking, etc. 私有银行通过许多传递通道(如自动取款机、网上银行、手机银行等)提供大范围的银行和金融产品、金融服务进行合作并向客户零售。
The area could be Investment management banking, life and non-life insurance, venture capital and asset management, retail loans such as home loans, personal loans, educational loans, car loans, consumer durable loans, credit cards, etc. 涉及的领域包括投资管理银行、生命和非生命保险、风险投资与资产管理、零售贷款(如家庭贷款、个人贷款、教育贷款、汽车贷款、耐用消费品贷款、信用卡等)。
Private sector banks focus on customization of products that are designed to meet the specific needs of customers. 私人银行主要致力于为一些特殊需求的客户进行设计和产品定制。
毕业论文外文翻译格式【范本模板】

因为学校对毕业论文中的外文翻译并无规定,为统一起见,特做以下要求:1、每篇字数为1500字左右,共两篇;2、每篇由两部分组成:译文+原文.3 附件中是一篇范本,具体字号、字体已标注。
外文翻译(包含原文)(宋体四号加粗)外文翻译一(宋体四号加粗)作者:(宋体小四号加粗)Kim Mee Hyun Director, Policy Research & Development Team,Korean Film Council(小四号)出处:(宋体小四号加粗)Korean Cinema from Origins to Renaissance(P358~P340) 韩国电影的发展及前景(标题:宋体四号加粗)1996~现在数量上的增长(正文:宋体小四)在过去的十年间,韩国电影经历了难以置信的增长。
上个世纪60年代,韩国电影迅速崛起,然而很快便陷入停滞状态,直到90年代以后,韩国电影又重新进入繁盛时期。
在这个时期,韩国电影在数量上并没有大幅的增长,但多部电影的观影人数达到了上千万人次。
1996年,韩国本土电影的市场占有量只有23.1%。
但是到了1998年,市场占有量增长到35。
8%,到2001年更是达到了50%。
虽然从1996年开始,韩国电影一直处在不断上升的过程中,但是直到1999年姜帝圭导演的《生死谍变》的成功才诞生了韩国电影的又一个高峰。
虽然《生死谍变》创造了韩国电影史上的最高电影票房纪录,但是1999年以后最高票房纪录几乎每年都会被刷新。
当人们都在津津乐道所谓的“韩国大片”时,2000年朴赞郁导演的《共同警备区JSA》和2001年郭暻泽导演的《朋友》均成功刷新了韩国电影最高票房纪录.2003年康佑硕导演的《实尾岛》和2004年姜帝圭导演的又一部力作《太极旗飘扬》开创了观影人数上千万人次的时代。
姜帝圭和康佑硕导演在韩国电影票房史上扮演了十分重要的角色。
从1993年的《特警冤家》到2003年的《实尾岛》,康佑硕导演了多部成功的电影。
毕业论文 外文翻译格式

毕业论文外文翻译格式毕业论文外文翻译格式在撰写毕业论文时,外文翻译是一个重要的环节。
无论是引用外文文献还是翻译相关内容,都需要遵循一定的格式和规范。
本文将介绍一些常见的外文翻译格式,并探讨其重要性和应用。
首先,对于引用外文文献的格式,最常见的是使用APA(American Psychological Association)格式。
这种格式要求在引用外文文献时,先列出作者的姓氏和名字的首字母,然后是出版年份、文章标题、期刊名称、卷号和页码。
例如:Smith, J. D. (2010). The impact of climate change on biodiversity. Environmental Science, 15(2), 145-156.在翻译外文文献时,需要注意保持原文的准确性和完整性。
尽量避免意译或添加自己的解释,以免歪曲原文的意思。
同时,还需要在翻译后的文献后面加上“译者”和“翻译日期”的信息,以便读者可以追溯翻译的来源和时间。
其次,对于翻译相关内容的格式,可以参考国际标准组织ISO(International Organization for Standardization)的格式。
这种格式要求在翻译相关内容时,先列出原文,然后是翻译后的文本。
例如:原文:The importance of effective communication in the workplace cannot be overstated.翻译:工作场所有效沟通的重要性不容忽视。
在翻译相关内容时,需要注意保持原文的意思和语气。
尽量使用准确的词汇和语法结构,以便读者能够理解和接受翻译后的内容。
同时,还需要在翻译后的文本后面加上“翻译者”和“翻译日期”的信息,以便读者可以追溯翻译的来源和时间。
此外,对于长篇外文文献的翻译,可以考虑将其分成若干章节,并在每个章节前面加上章节标题。
这样可以使读者更容易理解和阅读翻译后的内容。
外文翻译及原文

Pyrolysis of oil sludge first by thermogravimetry/mass spectroscopy (TG/MS) and then in a horizontal quartz reactor with an electrical laboratory furnace under different pyrolysis conditions was carried out. The influence of heating rate from 5 to 20 °Camin-1, final pyrolysis temperature from 400 to 700 °C, various interval holding stage, and catalyst on the products were investigated in detail. The TG/MS results show that pyrolysis reaction of oil sludge starts at a low temperature of about 200 °C, and the maximum evolution rate is observed between the temperatures of 350-500 °C. A higher final pyrolysis temperature, an interval holding stage, and adding catalyst can promote the pyrolysis conversion (in terms of less solid residue production). In all parameters, an interval holding stage for 20 min near the peak temperature of 400 °C can enhance the yield of oil and improve its quality. Three additives used in this work as catalysts do not improve oil product quality markedly in spite of increasing pyrolysis conversion greatly.油泥的裂解首先通过热重/质谱分析(TG / MS),然后在水平石英反应器中具有不同热解条件下的电气实验室炉进行。
外文翻译及中文译文

车床用于车外圆、端面和镗孔等加工的机床称作车床。
车削很少在其他种类的机床上进行,因为其他机床都不能像车床那样方便地进行车削加工。
由于车床除了用于车外圆还能用于镗孔、车端面、钻孔和铰孔,车床的多功能性可以使工件在一次定位安装中完成多种加工。
这就是在生产中普遍使用各种车床比其他种类的机床都要多的原因。
两千多年前就已经有了车床。
现代车床可以追溯到大约1797年,那时亨利•莫德斯利发明了一种具有把主轴和丝杆的车床。
这种车床可以控制工具的机械进给。
这位聪明的英国人还发明了一种把主轴和丝杆相连接的变速装置,这样就可以切削螺纹。
车床的主要部件:床身、主轴箱组件、尾架组件、拖板组、变速齿轮箱、丝杆和光杆。
床身是车床的基础件。
它通常是由经过充分正火或时效处理的灰铸铁或者球墨铸铁制成,它是一个坚固的刚性框架,所有其他主要部件都安装在床身上。
通常在球墨铸铁制成,它是一个坚固的刚性框架,所有其他主要部件都安装在床身上。
通常在床身上面有内外两组平行的导轨。
一些制造厂生产的四个导轨都采用倒“V”,而另一些制造厂则将倒“V”形导轨和平面导轨结合。
由于其他的部件要安装在导轨上并(或)在导轨上移动,导轨要经过精密加工,以保证其装配精度。
同样地,在操作中应该小心,以避免损伤导轨。
导轨上的任何误差,常常会使整个机床的精度遭到破坏。
大多数现代车床的导轨要进行表面淬火处理。
以减少磨损和擦伤,具有更大的耐磨性。
主轴箱安装在床身一端内导轨的固定位置上。
它提供动力。
使工件在各种速度下旋转。
它基本上由一个安装在精密轴承中的空心轴和一系列变速齿轮---类似于卡车变速箱所组成,通过变速齿轮,主轴可以在许多中转速的旋转。
大多数车床有8~18中转速,一般按等比级数排列。
在现代车床上只需扳动2~4个手柄,就能得到全部挡位的转速。
目前发展的趋势是通过电气的或机械的装置进行无级变速。
由于车床的精度在很大程度上取决于主轴,因此主轴的结构尺寸较大,通常安装在紧密配合的重型圆锤滚子轴承或球轴承中。
外文翻译原文
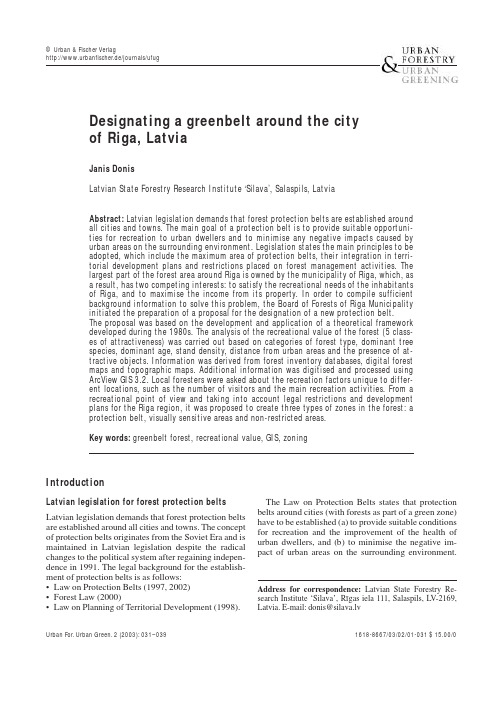
IntroductionLatvian legislation for forest protection belts Latvian legislation demands that forest protection belts are established around all cities and towns. The concept of protection belts originates from the Soviet Era and is maintained in Latvian legislation despite the radical changes to the political system after regaining indepen-dence in 1991. The legal background for the establish-ment of protection belts is as follows:•Law on Protection Belts (1997, 2002)•Forest Law (2000)•Law on Planning of Territorial Development (1998).Designating a greenbelt around the city of Riga, LatviaJanis DonisLatvian State Forestry Research Institute ‘Silava’, Salaspils, LatviaAbstract: Latvian legislation demands that forest protection belts are established around all cities and towns. The main goal of a protection belt is to provide suitable opportuni-ties for recreation to urban dwellers and to minimise any negative impacts caused by urban areas on the surrounding environment. Legislation states the main principles to be adopted, which include the maximum area of protection belts, their integration in terri-torial development plans and restrictions placed on forest management activities. The largest part of the forest area around Riga is owned by the municipality of Riga, which, as a result, has two competing interests: to satisfy the recreational needs of the inhabitants of Riga, and to maximise the income from its property. In order to compile sufficient background information to solve this problem, the Board of Forests of Riga Municipality initiated the preparation of a proposal for the designation of a new protection belt.The proposal was based on the development and application of a theoretical framework developed during the 1980s. The analysis of the recreational value of the forest (5 class-es of attractiveness) was carried out based on categories of forest type, dominant tree species, dominant age, stand density, distance from urban areas and the presence of at-tractive objects. Information was derived from forest inventory databases, digital forest maps and topographic maps. Additional information was digitised and processed using ArcView GIS 3.2. Local foresters were asked about the recreation factors unique to differ-ent locations, such as the number of visitors and the main recreation activities. From a recreational point of view and taking into account legal restrictions and development plans for the Riga region, it was proposed to create three types of zones in the forest: a protection belt, visually sensitive areas and non-restricted areas.Key words:greenbelt forest, recreational value, GIS, zoningThe Law on Protection Belts states that protection belts around cities (with forests as part of a green zone)have to be established (a) to provide suitable conditions for recreation and the improvement of the health of urban dwellers, and (b) to minimise the negative im-pact of urban areas on the surrounding environment.Urban For.Urban Green.2 (2003):031–0391618-8667/03/02/01-031 $ 15.00/0Address for correspondence:Latvian State Forestry Re-search Institute ‘Silava’, Rı¯gas iela 111, Salaspils, LV-2169,Latvia. E-mail: donis@silava.lv© Urban & Fischer Verlaghttp://www.urbanfischer.de/journals/ufugRegulation nr 263 (19.06.2001) on the ‘Methodology for the establishment of forest protection belts around towns’issued by the Cabinet of Ministers (CM) states: (a) The area of a protection belt depends on the numberof inhabitants in the town: towns with up to 10,000 inhabitants should have a maximum of 100 ha of protection belt, those with between 10,000 and 100,000 inhabitants a maximum of 1,500 ha, and towns with more than 100,000 inhabitants a maxi-mum of 15,000 ha;(b) the borders of protection belts have to be able to beidentifiable on the ground, using features such as roads, ditches, power lines, and so forth;(c) protection belts have to be recorded in the territorialplans of regions adjacent to the town or city; and (d) establishment of protection belts has to be agreedupon by local municipalities.According to law, protection belts should be man-aged using adapted silvicultural measures. Clear-cut-ting, for example, is prohibited in a protection belt to mitigate any negative impacts of the city on the sur-rounding environment. The Forest Law of 2000 and subsequent regulations including the Regulation on Cutting of Trees, and the Regulation on Nature Conser-vation in Forestry define clear-cuts as felled areas larg-er than 0.1 ha where the basal area is reduced below a critical level in one year. These regulations also state the permitted intensity and periodicity of selective cut-ting (30–50%, at least 5 years between entries).The third element of the legal framework relevant for protection belts in Latvia is the Law on Planning of Territorial Development (1998). It defines:(a) Principles and responsibilities of the different or-ganisations involved;(b) the contents of territorial plans;(c) the procedures for public hearing; and(d) the procedures for the acceptance of plans.The law also states that protection belts around towns have to be designated in territorial plans. Thus, the legislation gives very detailed descriptions of the restrictions to maximum area, activities and guidelines for delineation and so forth, while there are no ‘rules’for the choice of what areas are to be included in pro-tection belts. It is up to territorial planners to propose what areas to include and for negotiation among mu-nicipalities to approve the selection.Protection belt for the city of RigaRiga and the Riga region are situated in the Coastal Lowland of Latvia within the Gulf of Riga. The main landform types are the Baltic Ice Lake plain, the Litto-rina Sea plain and the Limnoglacial plain and bog plain. The total area of the administrative area of the City of Riga covers 307.2 km2, and that of the Riga re-gion 3,059 km2. In 2000 the city of Riga had 815,000 inhabitants, while an additional 145,000 people resided in the greater Riga region. During the last decade the number of inhabitants in Riga decreased by 10.5%and in Riga region by 5.3%. In the mid-1990s the main types of industry in Riga were food processing, timber and wood processing, metal fabricating and engineer-ing, while in the region agriculture and forestry, wood processing, pharmaceuticals, and the power industry were the main activities. Due to reduced industrial ac-tivities today, the main sources of pollution in Riga re-gion are road transport and households.The greater part of the Riga region is covered by for-est, i.e. 1,642 km2or 53%. About 26% of the land is used for agriculture, 4% is covered by bogs, and 4% by water. The Riga region also has a coastal dune zone of some 30 km along the Gulf of Riga. The main tree species to be found in the Riga region are Scots pine (Pinus sylvestris L.),birch (Betula spp.) and Norway spruce (Picea abies (L.) Karsten) (see Table 1). In the administrative area of the city of Riga, 57 km2 or about 19% of the land area is forest. Scots pine is the domi-nant species, covering approx. 46.9 km2(i.e. 88% of the total forest area).According to the legislation described before, a pro-tection belt around Riga city, with a maximum size of 15,000 ha, could be designated. Moreover, any propos-al has to be agreed upon among 24 local municipalities. The Riga region is divided into 24 administrative units: 7 towns and 17 pagasts or ‘parishes’.Riga municipality currently owns more than 55,600 ha of forests. Most are situated in the vicinity of Riga. Four forest administrative districts lie completely with-in Riga region and close to Riga city (see Fig. 1). The total area of these districts is 44,158 ha out of which forest stands cover 36,064 ha (82%). Thus the Riga municipality forests of those 4 districts cover only 17% of the total forest area of the Region. The dominant tree species in the municipally owned forests are Scots32J.Donis:Designating a greenbelt around the city of Riga,LatviaUrban For.Urban Green.2 (2003)Table 1.Tree species composition in the Riga region Dominant tree Area covered, ha Average age, years species––––––––––––––––––––––––––––––––––––––––––––––––––––––––––––––––––––––––––––––Total Municipa-Total Municipa-lity*lity* Scots pine95,27627,3718581 Norway spruce20,8493,0175139Birch30,5585,1246056 Other10,438552––Total157,12136,0647369*Data only for the 4 forest districts of the Riga city munici-pality that are entirely situated within the Riga region.pine, birch and Norway spruce. These cover 76%, re-spectively 14% and 8% of the forest area. Other species cover less than 2% of the area.Until the re-establishment of Latvian independence almost all forestland was owned by the state but since then many areas have been returned to their former owners and are now privately owned. Current regula-tions state that until the designation of new boundaries for protection belts has been agreed upon, all forests of the previously existing and protected green zone have to remain protected whatever their functional role or ownership status. Consequently almost all forests of the Riga municipality located in the Riga region have management restrictions placed on them, and the same can be said for forests of other owners within the previ-ously existing green zone. Currently, therefore, on the one hand significant recreation opportunities for urban dwellers are provided, while on the other hand forest owners’rights to obtain income from timber harvest in the suburban areas continue to be restricted. Suburban municipalities also lose income because of reduced land taxes from land with management restrictions.The board of Forests of the Municipality of Riga there-fore initiated the preparation of a proposal to designate a new protection belt.Study to support protection belt designation The main objective of the study presented here has been to obtain background information in preparation for further discussions with local municipalities. Stud-ies in Latvia as well as elsewhere have revealed that recreational values of forests depend mainly on forest characteristics, location and level of pollution (Emsis et al. 1979; Emsis 1989; Holgen et al. 2000; Lindhagen & Hörnsten 2000; Rieps ˇas 1994; Su ¯na 1973, 1979). A very important aspect is the distance to the forest from places where people live (e.g. Rieps ˇas 1994). The abil-ity of a forest stand to purify the air by filtering or ab-sorbing dust, micro-organisms, and noxious gases de-pends on tree and shrub species composition, age, tree size and stand density (Emsis 1989). Stands purify the air most effectively at the time of maximum current an-nual volume increment, usually between 30 to 60 years of age in Latvian conditions, depending on species.Recreational value, on the other hand, increases with age (and tree size) and reaches its maximum consider-ably later. Taking into account the peculiarities of the dispersal of pollution as described by Laivin ‚s ˇ et al.(1993) and Za ¯lı¯tis (1993), selective cutting is prefer-able in the vicinity of a pollution source, especially ifJ.Donis:Designating a greenbelt around the city of Riga,Latvia 33Urban For.Urban Green.2 (2003)Fig. 1.Location ofthe Riga municipali-ty forests in the Riga region.the forest consists of a narrow strip between the pollu-tion source and housing. If the distance between a pol-lution source and housing exceeds several kilometres, a patch clear-cut system with stands of different ages is sufficient to provide a reduction in the negative impact of urban areas. Taking into account the fact that closer to residential areas it is more important to consider the visual qualities of the forest (e.g. Tyrväinen et al. 2003), this purification ability can generally be ignored when planning protection belts.MethodsThis study to support the designating of the Riga pro-tection belt used the following data sources for analysis (see Fig. 2): forest inventory databases, digital forest maps of the Riga municipal forests which are situated outside the administrative borders of the city (55,600 ha of which 44,158 ha located in the Riga region) (see Fig. 1), and corresponding topographic maps.The study and its developed proposal are based on an application of a theoretical approach developed during the 1980s by the Latvian State Forestry Research Insti-tute ‘Silava’(Emsis 1989) and the Lithuanian Forestry Research Institute (Riepsˇas 1994). According to the methodology developed by Emsis (1989), the first step in the process is to evaluate the recreational potential of the forest stands. This is carried out by analysing the following factors:• The tolerance of the forest ecosystem to different lev-els of anthropogenic (recreation) loading;• the status of forest ecosystems in terms of the damage or degradation as a result of recreational use;•the suitability of the landscape for non-utilitarian recreation (recreational value); and• the existing and potential levels of recreational loads.The second step involves evaluating the existing andexpected functional roles of the forest.The tolerance of the forest ecosystem to different levels of anthropogenic impact or loading is evaluated using a framework based on a combination of forest type, dominant tree species, dominant age group, soil type and relief, according to the stability of ecosystem. All stands are classified into one of five tolerance classes. The highest score is given to mature deciduous forests on mesotrophic and mesic soils on flat topogra-phy, while the lowest score is given to young pine stands on oligotrophic soils on steep slopes (forests on dunes).In this study ecosystem tolerance could not be evalu-ated, as it was primarily a desk using existing databas-es, and topographic relief maps were not available in digital form. The status of the forest ecosystem in rela-tion to damage or degradation was evaluated in terms of the degree of change in vegetation cover, under-growth, tree root exposure of the and level of littering, classified into three classes.Assessment of the recreational value of the forest stands was calculated using a formula developed by Riepsˇas (1994):Recreational value VR= (VS*kW*kS+VA)*kPWhere VSis stand suitability based on key internal at-tributes of the stand, such as species, age, stand densityand forest type. VSvalues range from 0 for young, high-density grey alder (Alnus incana L.) on wet peat soils, to 100 for average density mature pine stands ondry mineral soils. kwis a coefficient depending on the distance of the stand from watercourses, ranging from0.1 for stands further than 2 km from watercourses to1.0 for stands up to 500 m from watercourses. kSis a coefficient depending on the distance of the stand from urban areas, ranging from 0.1 for stands further than34J.Donis:Designating a greenbelt around the city of Riga,LatviaUrban For.Urban Green.2 (2003)Fig. 2.Structure of data sources used in data ana-lysis.80 km from Riga to 1.0 for stands within 30 km ofRiga. VA is an additional value depending on the pres-ence of attractive features, for example, 25 for forest stands up to 500 m from settlements, including summer cottages, or for areas intensively used for recreation ac-cording to information of local foresters. kP is a coeffi-cient depending on the level of environmental pollu-tion. Its value is 0 if the actual pollution level exceeds limit values, 0.5 if the level of environment pollution is between 50% and 100% of limit values, and 1 if the level of actual pollution is less than 50% of the limit values. In this study a coefficient of 1.0 was used, be-cause SO2and O3concentrations measured by Rigabackground measuring stations did not exceed 50% of the limit values (Fammler et al. 2000).The division of stands into classes of stand suitabili-ty is based on studies of visitors’preferences. Coeffi-cients kw, ksand VAare based on visitors’spatial distri-bution and show the ratio of the number of visitors in different zones. The evaluation of existing and expect-ed recreational loads was carried out by local foresters. They marked existing and potential recreation places on forest maps, including:•Small areas or sites for activities such as swimming, barbecuing, and so forth.•Recreation territories, defined as areas of 20 ha or more where people stay longer periods for walking, jogging, skiing or other forms of both active and pas-sive recreation.•Traditionally popular places for the collection of berries and mushrooms.•Recreational routes, including routes from public transport stops to recreation sites or recreation terri-tories, and between recreation sites and territories. For each recreation site and recreation territory data on the main seasons of use, the periods of use (week-days, weekends), and the average number of people in ‘rush-hours’during good weather conditions was col-lected or estimated.Data processing was carried out using ArcView GIS3.2a, Visual Fox pro and Microsoft Excel. VS values foreach stand were calculated from information in the for-est database using Visual Fox pro. Information collect-ed at a later stage from local foresters was digitised using separate themes (layers) in ArcView GIS 3.2a. Buffer zones along watercourses and water bodies, as well as residential areas, recreation sites and territoriesand recreation routes were created to get kW ,kSand VAvalues for each stand. Then VR values were calculatedfor each stand.A selection of recreation sites and territories was vis-ited by members of the project team in order to evalu-ate the state of the ecosystem with respect to wear and tear arising from different levels of recreational use. An evaluation of the existing functional role of each forest stand was carried out using the existing categories offorest protection. The anticipated future functional role was evaluated by annalysing the recreational value of stands, known expectations in terms of territorial de-velopment, and existing legal restrictions in order to find a compromise between recreation possibilities and other services of the forest. Next, a first draft of the protection belt was drawn according to experts’judge-ment. This draft included forests with high recreational value adjacent to residential areas and summer cot-tages, and larger tracts intensively used for recreation with medium to high recreational value.ResultsAccording to the original forest classification 65% of the total forest land area was designated as a commer-cial greenbelt forest, for which the main management goals are timber production and environmental consid-erations. The remaining 35% were designated as pro-tected (see Table 2). With regards to protected areas in Latvia: the main management goals of nature parks are nature conservation and recreation, including some ed-ucation. The goal for nature reserves is nature conser-vation, while that of the protected greenbelt forests is recreation.While interviewing local foresters it was revealed that they find it difficult to evaluate dispersed recreation loads (for example collection of berries, mushrooms). The assessments of foresters varied greatly and were considered to be unreliable. It was therefore decided to map only the places important for recreation, but not to use the inaccurate estimates of visitor numbers.In Latvia, special investigations have to be carried out in order to develop management objectives and principles for protected forests as part of the preparation of management plans. Pilot studies and visits to some of the recreation areas have revealed that the evaluation of the state of the forest ecosystem is useful only when de-veloping the detailed management plan. Even then, this is only the case for places identified by local foresters as recreation sites or territories, because otherwise it is too time consuming to carry out fieldwork which provides little useful additional information.Calculated VSvalues show that on average the forests studied have a medium suitability value for recreation (average score 47) (see Table 2). There are considerable differences between districts, with aver-age value ranging from 32 points in Olaine to 66 points in the Garkalne district. This indicates that the average stands in the Garkalne district are more suitable for recreation than those in other districts. If other aspects are taken into account, such as distance from wherepeople live, and VRvalues are calculated it can be seenJ.Donis:Designating a greenbelt around the city of Riga,Latvia35Urban For.Urban Green.2 (2003)that the districts are still ranked as follows: Garkalne,Jugla, Tireli and Olaine.Only 10% of the forest owned by Riga municipality within the Riga region were evaluated as having a high or very high recreational value. 12% had medium recreational value, while large areas used for the col-lection of berries and mushrooms were evaluated as having low or very low recreational value (60% of the total forest area) (see Table 3).More than 16% of the area is covered by bogs, for which according to the used methodology, recreational value was not evaluated at all. Some areas were recorded by the local foresters as important places for the collec-tion of berries. However, more valuable from a recre-ational point of view were those forests situated east and north-east of the city (Garkalne and Jugla districts),while the forests to the south (Olaine and Tireli districts)were found to have a lower recreational value (V R ).36J.Donis:Designating a greenbelt around the city of Riga,LatviaUrban For.Urban Green.2 (2003)Table 2.Distribution of forest by forest categories according to the original functional role Forest districtDataFormer forest category Total–––––––––––––––––––––––––––––––––––––––––––––––––––––––––––––––––––––––––––––––––––––––––––––––––––––––––––––––––––––––––––––––––––––––––––––––Commercial Nature Nature Protected greenbelt forests parks reserves greenbelt forestsGarkalneArea, ha521.27,698.78,219.9Average of V S *61.966.566.2Average of V R **59.350.751.4JuglaArea, ha 8,376.74,098.812,475.4Average of V S 45.656.949.1Average of V R 22.034.025.7OlaineArea, ha 11,765.4707.512,473.0Average of V S 31.941.032.6Average of V R 8.527.410.0TireliArea, ha 8,689.5257.91,025.01,016.910,989.3Average of V S 40.666.710.059.342.3Average of V R 17.055.3 1.044.920.6TotalArea, ha 28,831.6779.11,025.013,522.044,157.6Average of V S 39.863.510.061.647.1Average of V R16.357.91.043.725.9* V S Suitability value – based on stand parameters (0–100 points).** V R Recreation value (0–125 points) based on stand parameters, distance to the residential areas, water and other attractive objects.Table 3.Distribution of forest areas by classes of attractiveness and by designated functional role Designated zoneDataClass of attractiveness Total –––––––––––––––––––––––––––––––––––––––––––––––––––––––––––––––––––––––––––––––––––––––––––––––––––––––––––––––––––––––––––––––––––––––––––––––––––––––n.a.Very low Low Medium High Very high 0<2525,1–5051–7575–100100<Protection belt Area, ha76.7560.12,266.42,222.7850.5743.66719.9Average of V R *0.012.036.063.390.0125.053.4Visually sensitive Area, ha 447.64,150.54,157.7853.4847.1179.810636.1Average of V R 0.07.837.460.996.7125.028.5Non-restricted Area, ha 6,664.715,389.12,548.61,090.5874.8234.026801.7Average of V R 0.0 5.234.761.197.2125.015.8TotalArea, ha 7,189.020,099.88,972.74,166.52,572.31,157.344157.6Average of V R0.06.236.362.294.6125.025.9*V R Recreation value (0–125 points) based on stand parameters, distance to the residential areas, water and other attractive objects.Areas along main roads and railways are known to be visually sensitive, because of the large number of peo-ple who can see them during travel. The same is true for forest in the vicinity of small villages. Taking into ac-count the fact that legislation prohibits clear-cuts in pro-tection belts – which is not always necessary in order to maintain the visual quality of the landscape – it was proposed, as part of the zoning strategy, to create so called visually sensitive areas. In these areas the forest owner (Riga municipality) is recommended to use more detailed landscape-planning techniques and to pay more attention to visual aspects during management.As a result of the study, seen from a recreational point of view and taking into account legal restrictions and so forth, it has been proposed to create three zoning categories: (1) protection belts, (2) visually-sensitive areas, and (3) non-restricted areas (see Fig. 3). The protection belt should include:• Forest with high recreational value adjacent to residen-tial areas and summer cottages, to form a 200–500 m wide belt.• Larger tracts of forestland intensively used for recre-ation.The zone of visually-sensitive areas should include:• Forests within the administrative borders of Riga mu-nicipality and in the vicinity of villages (up to 200–500 m distance).• Forests along roads of national and regional impor-tance, railways, watercourses and streams as a protec-tion belt of 100–300 m wide.• Places used for mushroom and berry collection in the original restricted protection belt.• Places that could become important for recreation in the near future.J.Donis:Designating a greenbelt around the city of Riga,Latvia 37Urban For.Urban Green.2 (2003)Table 4.Proposed distribution of forest categories in designated zones (in hectares)Designated zoneFormer forest category Grand Total––––––––––––––––––––––––––––––––––––––––––––––––––––––––––––––––––––––––––––––––––––––––––––––––––––––––––––––––––––––––––––––––––––––––––––––––––––––––––––––––––Commercial Nature Nature Protected greenbelt forests parks reserves greenbelt forests Protection belt355.2779.15,585.76,719.9Visually sensitive areas 3,503.97,132.110,636.1Non-restricted areas 24,972.51,025.0*804.226,801.7Total 28,831.6779.11,025.013,522.044,157.6*Forests within nature reserves are not intended for recreation; their primary management goal is nature conservation.Fig. 3.Proposal for zon-ing of the Riga municipalforests in Riga region.The remaining areas should consequently be classi-fied as non-restricted areas.A revision of the first draft plan was made taking into account the known prospective development plans of Riga and Riga region. As a result, for forests owned by Riga municipality and located in Riga region the pro-posal is to include 6,720 ha in the protection belt (see Table 3). Moreover, it has been suggested to designate 10,636 ha as visually-sensitive areas, but to omit the re-maining 26,802 ha from zoning, as these do not need special management from a recreation point of view. Average recreational values of stands in this area range from 53 (medium), through 28 (low) to 15 points (very low) respectively.As a result, the major part of the forest remains in the same functional category as in the original allocation (see Table 4). As was mentioned above, the classifica-tion described here is only based on recreational as-pects, thus forests in nature reserves are misleadingly shown as non-restricted forests. Only 5,586 ha out of the 13,500 thousand ha of the originally protected greenbelt forests are proposed to be included in the protection belt, while 355 ha of the previous commer-cial greenbelt forests are proposed to be placed under stronger protection.DiscussionForests owned by Riga municipality within the Riga re-gion are divided over 13 rural municipalities. Accord-ing to legislation, revised draft proposals for zoning Riga city forests have to be accepted by Riga munici-pality, while the final decision is up to Riga and the sur-rounding municipalities. The study presented here has provided a tentative estimate of the recreational value and suitability of the forests for recreation and can be used as a starting point for political discussions. At the very beginning the intention was to divide the forests in two categories: the protection belt and the remainder of the forest. During the study it was concluded, however, that a third category would be needed, that of visually sensitive areas. Within this category more attention would have to be paid to the amenity of the landscape, but there would be no need to drastically restrict com-mercial forest management. As nature parks are also designated for recreation, it has been proposed to in-clude all forests of nature parks in the protection belt. It has to be noted that all the forests within the adminis-trative borders of cities, and as such not included in this study, are designated as protected. As a consequence, the forest area available for recreation to the inhabi-tants of Riga would increase to 12,500 ha.Unlike many other European cities, where timber ex-traction is of small importance (Konijnendijk 1999),Riga municipal forests have a considerable economic role. It is estimated that the allowable annual cut in suburban forests amounts to 169,800 m3or 81% of the annual increment (Dubrovskis et al. 2002). It should be kept in mind that income from logging is used for for-est regeneration and tending, forest fire protection and maintenance of recreation facilities.The objective of this study was not to evaluate the precision of the method nor possible errors occurring when applying it. This study revealed, however, the in-completeness of the methodology used. Bogs, which are very sensitive to recreation loads, are ascribed quite a high level of attractiveness from a recreation point of view (for the collection of wild berries), but according to the methodology they are not evaluated at all. All watercourses were assumed to be attractive sites, while the preliminary evaluation of recreation loads showed this not to be true. The use of watercourses is very vari-able and obviously depends on water quality and vege-tation structure of the edges or banks. Another aspect which was not taken into account was that amenity of a forest is not simply the sum of the amenity values of forest stands (Pukkala et al. 1995).It seems that the evaluation based on dominant species is appropriate for screening areas, but for more detailed management plans, species mixture, the number of forest layers, and principles of landscape architecture also have to be taken into account (Bell 1999; Bell & Nikodemus 2000). Various studies have shown that people prefer uneven-aged forests (e.g. Melluma et al. 1982) and uneven-aged stands (e.g. Riepsˇas 1994). The impacts of the screening effect show that there are, even in the visually-sensitive and commercial zones, considerable areas with high and very high recreational value. This is mainly because delineation of zonal boundaries is carried out using easily distinguishable natural lines, and often it is not worth including single stands of high recreational value in the protection belt if, as a consequence, re-strictions on management would be placed over whole compartments of 50 ha.For the preparation of specific management guide-lines detailed field inventories have to be carried out. This has not been done in this study, where more re-liance was placed on the experience of local foresters and existing databases. Detailed economical calcula-tions have yet to be carried out in order to evaluate the direct and indirect value of the forest. These will also assist in obtaining more background information to be used as part of a holistic approach and for development of a decision support system to resolve contradictions between different interest groups.After acceptance of the draft plan by the municipali-ty of Riga, the process of negotiation between Riga and its surrounding municipalities is currently ongoing.38J.Donis:Designating a greenbelt around the city of Riga,Latvia Urban For.Urban Green.2 (2003)。
外文翻译 英文

2. WHAT CONSTITUTES FAIR DEALINGWEINBERGER v. UOP, INC.457 A.2d 701 (Del.Supr.19a3).MOORE, JUSTICE.This post-trial appeal was reheard en banc from a decision of the Court of Chancery. It was brought by the class action plaintiff below, a former shareholder of UOP, Inc., who challenged the elimination of UOP's minority shareholders by a cash-out merger between UOP and its majority owner, The Signal Companies, Inc. Originally, the defendants in this action were Signal, UOP, certain officers and directors of those companies, and UOP's investment banker, Lehman Brothers Kuhn Loeb, Inc. The present Chancellor held that the terms of the merger were fair to the plaintiff and the other minority shareholders of UOP. Accordingly, he entered judgment in favor of the defendants.Numerous points were raised by the parties, but we address only the following questions presented by the trial court's opinion:1) The plaintiffs duty to plead sufficient facts demonstrating the unfairness of the challenged merger;2) The burden of proof upon the parties where the merger has been approved by the purportedly informed vote of a majority of the minority shareholders;3) The fairness of the merger in terms of adequacy of the defendants' disclosures to the minority shareholders;4) The fairness of the merger in terms of adequacy of the price paid for the minority shares and the remedy appropriate to that issue; and5) The continued force and effect of Singer v. Magnavox Co., Del.Supr., 380 A.2d 969, 980 (1977), and its progeny.In ruling for the defendants, the Chancellor re-stated his earlier conclusion that the plaintiff in a suit challenging a cash-out merger must allege specific acts of fraud, misrepresentation or other items of misconduct to demonstrate the unfairness of the merger terms to the minority. We approve this rule and affirm it.The Chancellor also held that even though the ultimate burden of proof is on the majority shareholder to show by a preponderance of the evidence that the transaction is fair, it is first the burden of the plaintiff attacking the merger to demonstrate some basis for invoking the fairness obligation. We agree with that principle. However, where corporate action has been approved by an informed vote of a majority of the minority shareholders, we conclude that the burden entirely shifts ^ to the plaintiff to show that the transaction was unfair to the minority^- But in all this, the burden clearly remains on those relying on the vote to show that they completely disclosed all material facts relevant to the transaction.Here, the record does not support a conclusion that the minority stockholder vote was an informed one. Material information, necessary to acquaint those shareholders with the bargaining positions of Signal and UOP, was withheld under circumstances amounting to a breach of fiduciary duty. We therefore conclude that this merger does not meet the test of fairness, at least as we address that concept, and no burden thus shifted to the plaintiff by reason of the minority shareholder vote. Accordingly, we reverse and remand for further proceedings consistent herewith.In considering the nature of the remedy available under our law to minority shareholders in a cash-out merger, we believe that it is, and hereafter should be, an appraisal under 8 Del.C. § 262 as hereinafter construed. We therefore overrule Lynch v. Vickers Energy Corp., Del. Supr., 429 A.2d 497 (1981) {Lynch II) to the extent that it purports to limit a stockholder's monetary relief to a specific damage formula. But to give full effect to section 262 within the framework of the General Corporation Law we adopt a more liberal, less rigid and stylized, approach to the valuation process than has heretofore been permitted by our courts. While the present state of these proceedings does not admit the plaintiff to the appraisal remedy per se, the practical effect of the remedy we do grant him will be co-extensive with the liberalized valuation and appraisal methods we herein approve for cases coming after this decision.Our treatment of these matters has necessarily led us to a reconsideration of the business purpose rule announced in the trilogy of Singer A v. Magnavox Co., supra; Tanzer v. International General Industries, JT > Inc., DeL.Supr., 379 A.2d 1121 (1977); and Roland International Corp. v. Najjar, Del.Supr., 407 A.2d 1032 (1979). For the reasons hereafter set forth we consider that the business purpose requirement of these cases v J is no longer the law of Delaware.The facts found by the trial court, pertinent to the issues before us, are supported by the record, and we draw from them as set out in the Chancellor's opinion.Signal is a diversified, technically based company operating through various subsidiaries. Its stock is publicly traded on the New York, Philadelphia and Pacific Stock Exchanges. UOP, formerly known as Universal Oil Products Company, was a diversified industrial company engaged in various lines of business, including petroleum and petro-chemical services and related products, construction, fabricated metal products, transportation equipment products, chemicals and plastics, and other products and services including land development, lumber products and waste disposal. Its stock was publicly held and listed on the New York Stock Exchange.In 1974 Signal sold one of its wholly-owned subsidiaries for $420,000,000 in cash. See Gimbel v. Signal Companies, Inc., Del.Ch., 316 A.2d 599, aff’d, Del.Supr., 316 A.2d 619 (1974). While looking to invest this cash surplus, Signal became interested in UOP as a possible acquisition. Friendly negotiations ensued, and Signal proposed to acquire a controlling interest in UOP at a price of $19 per share. UOP's representatives sought $25 per share. In the arm's length bargaining that followed, an understanding was reached whereby Signal agreed to purchase from UOP 1,500,000 shares of UOP's authorized but unissued stock at $21 per share.This purchase was contingent upon Signal^ making a successful cash tender offer for 4,300,000 publicly held shares of UOP, also at a price of $21 per share. This combined method of acquisition permitted Signal to acquire 5,800,000 shares of stock, representing 50.5% of UOP's outstanding shares. The UOP board of directors advised the company's shareholders that it had no objection to Signal's tender offer at that price. Immediately before the announcement of the tender offer, UOP's common stock had been trading on the New York Stock Exchange at a fraction under $14 per share.The negotiations between Signal and UOP occurred during April 1975, and the resulting tender offer was greatly oversubscribed. However, Signal limited its total purchase of the tendered shares so that, when coupled with the stock bought from UOP, it had achieved its goalof becoming a 50.5% shareholderAlthough UOP’ board consisted of thirteen directors, Signal nominated and elected only six. Of these, five were either directors or employees of Signal. The sixth, a partner in the banking firm of Lazard Freres & Co., had been one of Signal's representatives in the negotiations and bargaining with UOP concerning the tender offer and purchase price of the UOP shares.However, the president and chief executive officer of UOP retired during 1975, and Signal caused him to be replaced by James V. Crawford, a long-time employee and senior executive vice president of one of Signal's wholly-owned subsidiaries. Crawford succeeded his predecessor on UOP's board of directors and also was made a director of Signal.By the end of 1977 Signal basically was unsuccessful in finding other suitable investment candidates for its excess cash, and by February 1978 considered that it had no other realistic acquisitions available to it on a friendly basis. Once again its attention turned to UOP.The trial court found that at the instigation of certain Signal management personnel, including William W. Walkup, its board chairman, and Forrest N. Shumway, its president, a feasibility study was made concerning the possible acquisition of the balance of UOP's outstanding shares. This study was performed by two Signal officers, Charles S. Arledge, vice president (director of planning), and Andrew J. Chitiea, senior vice president (chief financial officer). Messrs. Walkup, Shumway, Arledge and Chitiea were all directors of UOP in addition to their membership on the Signal board.Arledge and Chitiea concluded that it would be a good investment for Signal to acquire the remaining 49.5% of UOP shares at any price up to $24 each. Their report was discussed between Walkup and Shumway who, along with Arledge, Chitiea and Brewster L. Arms, internal counsel for Signal, constituted Signal's senior management. In particular, they talked about the proper price to be paid if the acquisition was pursued, purportedly keeping in mind that as UOP's majority shareholder, Signal owed a fiduciary responsibility to both its own stockholders as well as to UOP's minority. It was ultimately agreed that a meeting of Signal's Executive Committee would be called to propose that Signal acquire the remaining outstanding stock of UOP through a cash-out merger in the range of $20 to $21 per share.The Executive Committee meeting was set for February 28, 1978. As a courtesy, UOP's president, Crawford, was invited to attend, although he was not a member of Signal's executive committee. On his arrival, and prior to the meeting, Crawford was asked to meet privately with Walkup and Shumway. He was then told of Signal's plan to acquire full ownership of UOP and was asked for his reaction to the proposed price range of $20 to $21 per share. Crawford said he thought such a price would be "generous", and that it was certainly one which should be submitted to UOP's minority shareholders for their ultimate consideration. He stated, however, that Signal's 100% ownership could cause internal problems at UOP. He believed that employees would have to be given some assurance of their future place in a fully- owned Signal subsidiary. Otherwise, he feared the departure of essential personnel. Also, many of UOP's key employees had stock option incentive programs which would be wiped out by a merger. Crawford therefore urged that some adjustment would have to be made, such as providing a comparable incentive in Signal's shares, if after the merger he was to maintain his quality of personnel and efficiency at UOP.Thus, Crawford voiced no objection to the $20 to $21 price range, nor did he suggest that Signal should consider paying more than $21 per share for the minority interests. Later, at the Executive Committee meeting the same factors were discussed, with Crawford repeating the position he earlier took with Walkup and Shumway. Also considered was the 1975 tender offer andthe fact that it had been greatly oversubscribed at $21 per share. For many reasons, Signal's manage¬ment concluded that the acquisition of UOP's minority shares provided the solution to a number of its business problems.Thus, it was the consensus that a price of $20 to $21 per share would be fair to both Signal and the minority shareholders of UOP. Signal's executive committee authorized its management "to negotiate" with UOP "for a cash acquisition of the minority ownership in UOP, Inc., with the intention of presenting a proposal to [Signal's] board of directors * * * on March 6, 1978". Immediately after this February 28, 1978 meeting, Signal issued a press release stating: The Signal Companies, Inc. and UOP, Inc. are conducting negotiations for the acquisition for cash by Signal of the 49.5 per cent of UOP which it does not presently own, announced Forrest N. Shumway, president and chief executive officer of Signal, and James V. Crawford, UOP president. Price and other terms of the proposed transaction have not y et been finalized and would be subject to approval of the boards of directors of Signal and UOP, scheduled to meet early next week, the stockholders of UOP and certain federal agencies.The announcement also referred to the fact that the closing price of UOP's common stock on that day was $14.50 per share.Two days later, on March 2, 1978, Signal issued a second press release stating that its management would recommend a price in the range of $20 to $21 per share for UOP's 49.5% minority interest. This announcement referred to Signal's earlier statement that "negotiations" were being conducted for the acquisition of the minority shares.Between Tuesday, February 28, 1978 and Monday, March 6,1978, a total of four business days, Crawford spoke by telephone with all of UOP's non-Signal, i.e., outside, directors. Also during that period, Crawford retained Lehman Brothers to render a fairness opinion as to the price offered the minority for its stock. He gave two reasons for this choice. First, the time schedule between the announcement and the board meetings was short (by then only three business days) and since Lehman Brothers had been acting as UOP's investment banker for many years, Crawford felt that it would be in the best position to respond on such brief notice. Second, James W. Glanville, a long-time director of UOP and a partner in Lehman Brothers, had acted as a financial advisor to UOP for many years. Crawford believed that Glanville's familiarity with UOP, as a member of its board, would also be of assistance in enabling Lehman Brothers to render a fairness opinion within the existing time constraints.Crawford telephoned Glanville, who gave his assurance that Lehman Brothers had no conflicts that would prevent it from accepting the task. Glanville's immediate personal reaction was that a price of $20 to $21 would certainly be fair, since it represented almost a 50% premium over UOP's market price. Glanville sought a $250,000 fee for Lehman Brothers' services, but Crawford thought this too much. After further discussions Glanville finally agreed that Lehman Brothers would render its fairness opinion for $150,000.During this period Crawford also had several telephone contacts with Signal officials. In only one of them, however, was the price of the shares discussed. In a conversation with Walkup, Crawford advised that as a result of his communications with UOP's non-Signal directors, it was his feeling that the price would have to be the top of the proposed range, or $21 per share, if the approval of UOP's outside directors was to be obtained. But again, he did not seek any price higher than $21.Glanville assembled a three-man Lehman Brothers team to do the work on the fairness opinion. These persons examined relevant documents and information concerning UOP, including its annual reports and its Securities and Exchange Commission filings from 1973 through 1976, as well as its audited financial statements for 1977, its interim reports to shareholders, and its recent and historical market prices and trading volumes. In addition, on Friday, March 3, 1978, two members of the Lehman Brothers team flew to UOP's headquarters in Des Plaines, Illinois, to perform a "due diligence" visit, during the course of which they interviewed Crawford as well as UOP's general counsel, its chief financial officer, and other key executives and personnel.As a result, the Lehman Brothers team concluded that "the price of either $20 or $21 would be a fair price for the remaining shares of UOP". They telephoned this impression to Glanville, who was spending the weekend in Vermont.On Monday morning, March 6, 1978, Glanville and the senior member of the Lehman Brothers team flew to Des Plaines to attend the scheduled UOP directors meeting. Glanville looked over the assembled information during the flight. The two had with them the draft of a "fairness opinion letter" in which the price had been left blank. Either during or immediately prior to the directors' meeting, the two-page "fairness opinion letter" was typed in final form and the price of $21 per share was inserted.On March 6, 1978, both the Signal and UOP boards were convened to consider the proposed merger. Telephone communications were maintained between the two meetings. Walkup, Signal's board chairman, and also a UOP director, attended UOP's meeting with Crawford in order to present Signal's position and answer any questions that UOP's non-Signal directors might have. Arledge and Chitiea, along with Signal's other designees on UOP's board, participated by conference telephone. All of UOP's outside directors attended the meeting either in person or by conference telephone.First, Signal's board unanimously adopted a resolution authorizing Signal to propose to UOP a cash merger of $21 per share as outlined in a certain merger agreement, and other supporting documents. This proposal required that the merger be approved by a majority of UOP's outstanding minority shares voting at the stockholders meeting at which the merger would be considered, and that the minority shares voting in favor of the merger, when coupled with Signal's 50.5% interest would have to comprise at least two-thirds of all UOP shares. Otherwise the proposed merger would be deemed disapproved.UOP's board then considered the proposal. Copies of the agreement were delivered to the directors in attendance, and other copies had been forwarded earlier to the directors participating by telephone. They also had before them UOP financial data for 1974-1977, UOP's most recent financial statements, market price information, and budget projections for 1978. In addition they had Lehman Brothers' hurriedly prepared fairness opinion letter finding the price of $21 to be fair. Glanville, the Lehman Brothers partner, and UOP director, commented on the information that had gone into preparation of the letter.Signal also suggests that the Arledge-Chitiea feasibility study, indicating that a price of up to $24 per share would be a "good investment" for Signal, was discussed at the UOP directors' meeting. The Chancellor made no such finding, and our independent review of the record, detailed infra, satisfies us by a preponderance of the evidence that there was no discussion of this document at UOP's board meeting. Furthermore, it is clear beyond peradventure that nothing in that report was ever disclosed to UOP's minority shareholders prior to their approval of themerger.After consideration of Signal's proposal, Walkup and Crawford left the meeting to permit a free and uninhibited exchange between UOP's non-Signal directors. Upon their return a resolution to accept Signal's offer was then proposed and adopted. While Signal's men on UOP's board participated in various aspects of the meeting, they abstained from voting. However, the minutes show that each of them "if voting would have voted yes".On March 7, 1978, UOP sent a letter to its shareholders advising them of the action taken by UOP's board with respect to Signal's offer. This document pointed out, among other things, that on February 28, 1978 "both companies had announced negotiations were being conducted".Despite the swift board action of the two companies, the merger was not submitted to UOP's shareholders until their annual meeting on May 26, 1978. In the notice of that meeting and proxy statement sent to shareholders in May, UOP's management and board urged that the merger be approved. The proxy statement also advised:The price was determined after discussions between James V. Crawford, a director of Signal and Chief Executive Officer of UOP, and officers of Signal which took place during meetings on February 28, 1978, and in the course of several subsequent telephone conversations. (Emphasis added.)In the original draft of the proxy statement the word "negotiations" had been used rather than "discussions". However, when the Securities and Exchange Commission sought details of the "negotiations" as part of its review of these materials, the term was deleted and the word "discussions" was substituted. The proxy statement indicated that the vote of UOP's board in approving the merger had been unanimous. It also advised the shareholders that Lehman Brothers had given its opinion that the merger price of $21 per share was fair to UOP's minority. However, it did not disclose the hurried method by which this conclusion was reached.As of the record date of UOP's annual meeting, there were 11,488,302 shares of UOP common stock outstanding, 5,688,302 of which were owned by the minority. At the meeting only 56%, or 3,208,652, of the minority shares were voted. Of these, 2,953,812, or 51.9% of the total minority, voted for the merger, and 254,840 voted against it. When Signal's stock was added to the minority shares voting in favor, a total of 76.2% of UOP's outstanding shares approved the merger while only 2.2% opposed it.By its terms the merger became effective on May 26, 1978, and each share of UOP's stock held by the minority was automatically converted into a right to receive $21 cash.II.A.A primary issue mandating reversal is the preparation by two UOP directors, Arledge and Chitiea, of their feasibility study for the exclusive use and benefit of Signal. This document was of obvious significance to both Signal and UOP. Using UOP data, it described the advantages to Signal of ousting the minority at a price range of $21-$24 per share. Mr. Arledge, one of the authors, outlined the benefits to Signal:Purpose Of The Merger1) Provides an outstanding investment opportunity for Signal—(Better than any recent acquisition we have seen.)2) Increases Signal's earnings.3) Facilitates the flow of resources between Signal and its subsidiaries(Big factor—works both ways.)4) Provides cost savings potential for Signal and UOP.5) Improves the percentage of Signal's 'operating earnings' as opposed to 'holding company earnings'.6) Simplifies the understanding of Signal.7) Facilitates technological exchange among Signal's subsidiaries.8) Eliminates potential conflicts of interest.Having written those words, solely for the use of Signal it is clear from the record that neither Arledge nor Chitiea shared this report with their fellow directors of UOP. We are satisfied that no one else did either. This conduct hardly meets the fiduciary standards applicable to such a transaction * * *The Arledge-Chitiea report speaks for itself in supporting the Chancellor's finding that a price of up to $24 was a "good investment" for Signal. It shows that a return on the investment at $21 would be 15.7% versus 15.5% at $24 per share. This was a difference of only two-tenths of one percent, while it meant over $17,000,000 to the minority. Under such circumstances, paying UOP's minority shareholders $24 would have had relatively little long-term effect on Signal, and the Chancellor's findings concerning the benefit to Signal, even at a price of $24, were obviously correct. Levitt v. Bouvier, Del.Supr., 287 A.2d 671, 673 (1972).Certainly, this was a matter of material significance to UOP and its shareholders. Since the study was prepared by two UOP directors, using UOP information for the exclusive benefit of Signal, and nothing whatever was done to disclose it to the outside UOP directors or the minority shareholders, a question of breach of fiduciary duty arises. This problem occurs because there were common Signal-UOP directors participating, at least to some extent, in the UOP board's decision making processes without full disclosure of the conflicts they faced.7B.In assessing this situation, the Court of Chancery was required to:examine what information defendants had and to measure it against what they gave to the minority stockholders, in a context in which 'complete candor' is required. In other words, the limited function of the Court was to determine whether defendants had disclosed all information in their possession germane to the transaction in issue. And by 'germane' we mean, for present purposes, information such as a reasonable shareholder would consider important. in Priding whether. to sell or retain stock.* * ** * * Completeness, not adequacy, is both the norm and the mandate under present circumstances. Lynch v. Vickers Energy Corp., Del.Supr., 383 A.2d 278, 281 (1977) (Lynch /). This is merely stating in another way the long-existing principle of Delaware law that these Signal designated directors on UOP's board still owed UOP and its shareholders an uncompromising duty of loyalty. The classic language of Guth v. Loft, Inc., Del.Supr., 5 A.2d 503, 510 (1939), requires no embellishment:A public policy, existing through the years, and derived from a profound knowledge of human characteristics and motives, has established a rule that demands of a corporate officer or director, peremptorily and inexorably, the most scrupulous observance of his duty, not only affirmatively to protect the interests of the corporation committed to his charge, but also to refrainfrom doing anything that would work injury to the corporation, or to deprive it of. profit or advantage which his skill and ability might properly bring to it, or to enable it to make in the reasonable and lawful exercise of its powers. The rule that requires an undivided and unselfish loyalty to the corporation demands that there shall be no conflict between duty and self-interest. Given the absence of any attempt to structure this transaction on an arm's length basis, Signal cannot escape the effects of the conflicts it faced, particularly when its designees on UOP's board did not totally abstain from participation in the matter. There is no "safe harbor" for such divided loyalties in Delaware. When directors of a Delaware ^ corporation are on both sides of a transaction, they are required to demonstrate their utmost good faith and the most scrupulous inherent P fairness of the bargain. Gottlieb v. Heyden Chemical Corp., Del.Supr., 91 A.2d 57, 57-58 (1952). The requirement of fairness is unflinching in v rP y demand that where one stands on both sides of a transaction, he has the burden of establishing its entire fairness, sufficient to pass the test of careful scrutiny by the courts. Sterling v. Mayflower Hotel Corp., N, Del.Supr., 93 A.2d 107, 110 (1952); Bastian v. Bourns, Inc., Del.Ch., 256 A.2d 680, 681 (1969), aff’d, Del.Supr., 278 A.2d 467 (1970); David J. Greene & Co. v. Dunhill International Inc., Del.Ch., 249 A.2d 427, 431 (1968).There is no dilution of this obligation where one holds dual or multiple directorships, as in a parent-subsidiary context. Levien v. Sinclair Oil Corp., Del.Ch., 261 A.2d 911, 915 (1969). Thus, individuals who act in a dual capacity as directors of two corporations, one of whom is parent and the other subsidiary, owe the same duty of good management to both corporations, and in the absence of an independent negotiating structure (see note 7, supra), or the directors' total abstention from any participation in the matter, this duty is to be exercised in light of what is best for both companies. Warshaw v. Calhoun, Del. Supr., 221 A.2d 487, 492 (1966). The record demonstrates that Signal has not met this obligation.。
- 1、下载文档前请自行甄别文档内容的完整性,平台不提供额外的编辑、内容补充、找答案等附加服务。
- 2、"仅部分预览"的文档,不可在线预览部分如存在完整性等问题,可反馈申请退款(可完整预览的文档不适用该条件!)。
- 3、如文档侵犯您的权益,请联系客服反馈,我们会尽快为您处理(人工客服工作时间:9:00-18:30)。
本科毕业论文外文翻译外文译文题目(中文):营运能力比率分析学院: 文法与经济学院专业: 法学学号: ****************: ******: ***日期: 二○一一年十二月武汉科技大学本科毕业论文外文翻译Operating Capacity Ratio AnalysisAuthor: Frank J. Fabozzi .Pamela P. Peterson Material Source:《Financial Management and Analysis营运能力比率分析作者:弗兰克.J.法财务管理与分析博奇,帕梅拉.P.彼得1.财务比率分析通过财务分析,可以使不同的信息使用者得到有关企业营运状况和财务状况的信息。
这些信息都是很有价值的,它可以帮助企业经营者全面了解企业的营运状况,可以帮助企业投资者预测投资风险和投资报酬,做出投资、继续投资或转移投资的决策。
2.经营比率经营比率即周转比率,它在很大程度上可以用来评估特定资产产生的利益,诸如存货、应收账款可以用来评价公司全部资产产生的利润。
3.存货的管理存货周转率表明公司已销售货物和服务的使用效率。
存货周转率是企业营业成本与存货间的比率:存货周转率=营业成本/平均存货4.应收账款的管理就像评估存货周转一样,我们可以用应收账款和信用政策评估一个公司的经营管理水平。
应收账款周转率是评价企业运用信用政策效率的一种方法。
提供信用期限是为了刺激销售。
信用政策的使用,是为了防止客户出现不履行承诺的可能性。
延长信用期限的好处就同净赊销-销售应该收到的现金少于实际到账的。
应收账款周转率=营业收入净额/应收账款平均余额5.全部资产的管理存货周转率和应收账款周转率反映的是特定资产使用的效率。
为了更加全面的反映一个公司的生产经营能力,我们可以将一定时期的营业收入和资产总额进行比较。
一种方法就是使用总资产周转率,这个指标告诉我们年度内一个公司在销售环节总资产的周转次数。
总资产周转率=销售收入净额/平均资产总额另一种方法是只注重固定资产,公司的长期、有形资产。
固定资产周转率是固定资产和固定资产平均净值的比值。
固定资产周转率=销售收入净额/固定资产平均净值6.应收账款的管理当一个公司允许其客户在以后的日子里支付商品或服务的款项时,就产生了应收账款。
允许客户在收到商品或服务后付款,这就给了客户信用,也就是所谓的商业信用。
商业信用又称商品信用或者贸易信用,是一种非正式的信用,它不像其它形式的信用,商业信用通常不需要以票据为根据,而是自发产生的:当客户购买商品或服务,随之产生了商业信用。
应收账款的监控:通过财务比率和账龄分析表,可以监督应收账款的管理。
依靠财务比率,我们可以更加全面了解应收账款的回收速度。
账龄分析表表明应收账款的拖欠时间,有助于找到一个更加详细的收款策略。
通过信用天数的计算,可以找到快速收回应收账款的方法。
信用天数就是在某个时间点(或者说,在最后一年)应收账款余额和日赊金额(平均每天的信用销售额)的比值,即信用天数=应收账款/日赊销额。
信用天数,也称平均收款期和赊销期,衡量的是应收账款的平均收帐时间。
7.存货的管理存货是最终销售商品的库存。
存货包括原材料、在产品和可供出售的产成品。
存货的多少取决于很多因素。
正如应收账款,投资存货的成本和存货不足的成本之间要有所权衡。
有时候存货成本过多和有时候存货成本太少。
持有存货的理由:持有存货的理由有好几个。
其中最明显的理由是,如果你销售一种产品,你不能没有存货就做交易。
还有一个重要原因是,存货的制造是需要一定的时间的,不能很快就完工。
你可能会有一些不同阶段生产的库存。
这就是所说的生产过程。
为了防止销售额远远超出预期,你也会想要更多的库存产品在身边。
为了应对一些突发事件,比如说生产的改变,原材料成本的改变,你也更多的会想要储备投机库存。
此外,一些企业会利用足够的存货来满足合同协议。
例如,一个零售店,区域内唯一的经销商或产品的代表地区,可能需要储备一些以供出售的库存商品。
涉及存货投资的决定,比如说存货最小收益(例如满足交易和预防的需要)等于边际成本(例如运输成本)。
边际收益等于边际成本,表明财富最大化。
存货管理模型:存货管理模型有很多,但是基本思想都是相同的,那就是存货成本最小化。
经济订货批量模型:经济订货量(EOQ)模型可以帮助我们决定一个合适的库存量,使得在整个过程中总库存的成本是最低的。
经济订货模型有记下几个假设:①存货是第一时间收到的。
②库存是在一段时间内统一使用的③库存短缺是不可取的。
基于这些假设,每一次在管理存货的时候,通过订购特定数量的存货-也就是所谓的经济订货量,能够使企业存货成本最小化-即运费和订货成本之和最小。
存货管理的监控:与监控应收账款一样,我们可以通过分析财务比率来监控存货。
存货持有天数就是某个时点存货的美元价值与平均日销货成本的比值,即存货持有天数=存货/平均日销成本,这一比率用来估计销售存货的天数。
此比率可以用来评估日销货价值。
与所需货物评估相结合,可以帮助你制定生产与购货计划。
另一种监控存货的方法是存货周转率—表示一定时期内销售的(销货成本)与该期期末(存货)的比值,即存货周转率=产品销售成本/存货。
存货周转率表明在一段时间内,公司存货(从原材料到销售商品)的平均周转次数。
假设企业存货周转率为五次,那就意味着一年内该企业存货投资和存货销售一共完成了五次周转。
如果周转低于正常情况,可能暗示着生产缓慢或者销售缓慢,这也许就需要增加销售奖励或者提供价格折扣来扭转这一情况。
然而,存货周转率的分析也不是单一的。
高存货周转率是好是坏?这不能一概而论。
存货周转率越高公司存货使用效率高,但同时也意味着该公司可能会出现存货短缺的现象。
没有足够的存货会引起销售减少和客户友好程度的下降。
将存货周转率分析与盈利能力分析相结合,可以进一步帮助你了解存货是否适量。
流动资产的管理,需要将过多与资产相关的成本和拥有足够资产所带来的益处相平衡。
虽然各产业间商业惯例和风俗不同,但应收账款管理的共同理念是一样的,就是在考虑基金成本和坏帐产生的可能性时,要通过扩大信用来鼓励商品销售并保持竞争力。
管理存货时,由于销售商品的性质在很大程度上决定了库存的类型,所以各企业对于存货管理的投资都是不一样的。
经济订货批量模型和准时制管理技术可以帮助财务经理管理库存投资。
关于应收账款和存货的决定,他们的共同目的都是为了减少短期资产的投资。
但如果没有足够的资产,你将会发生成本,所以你必须做一些资产方面的投资。
在销售方面,如果你缺乏足够的存货或者你未能提供具有竞争力的信用证条款,你可能就会败给你的竞争对手。
应收账款的管理,涉及到销售增长带来的利润和信贷成本之间的权衡。
(比如说,资金的机会成本和信用客户的默认值。
)信用政策和搜集政策的制定,必须要考虑销售增长所带来的利润和延长信贷期限所带来的成本。
存货的管理,涉及了拥有足够存货满足需求所带来的益处和存货成本之间的权衡。
(例如,资金的机会成本,存储,折旧)。
存货管理模型,比如说经济订货量模型、切合时宜技术,都可以作为存货分析的一种方法,通过分析降低存货成本。
Using financial ratio analysisFinancial analysis provides information concerning a firm’s operating performa nce and financial condition. This information is useful to analysis in evaluating a firm’s operation and to an investor in evaluating the risk and potential returns to investing in a firm’s securities.Activity ratiosActivity ratios—for the most part, turnover ratios—can be used to evaluate the benefits produced by specific assets, such as inventory or accounts receivable or to evaluate the benefits produced by the totality of the firm’s assets.Inventory management .The inventory turnover ratio indicates how quickly a firm has used inventory to generate the goods and services that are sold. The inventory turnover is the ratio of the cost of goods sold to inventory:Inventory turnover ratio=Cost of goods sold/InventoryAccounts receivable managementIn much the same way we evaluated inventory turnover, we can evaluate a firm’s management of its accounts receivable and its credit policy. The accounts receivable turnover ratio is a measure of how effectively a firm is using credit extended to customers. The reason for extending credit is to increase sales. The downside to extending credit is the possibility of default—customers not paying when promised. The benefit obtained from extending credit is referred to as net credit sales—sales on credit less returns and refunds.Accounts receivable turnover=Net credit sales/Accounts receivableOverall asset managementThe inventory and accounts receivable turnover ratios reflect the benefits obtained from the use of specific assets (inventory and accounts receivable.)For a more general picture of the productivity of the firm, we can compare the sales during a period with the total assets that generated these sales.One way is with the total asset turnover ratio which tells us how many times during the year the value of a firm’s total assets is generated in sales:Total assets turnover=Sales/Total assetsAn alternative is to focus only on fixed assets, the long-term, tangible assets of the firm. The fixed asset turnover is the ratio of sales to fixed assets:Fixed asset turnover ratio=Sales/Fixed assetsReceivables Management When a firm allows customers to pay for goods and servicesat a later date, it creates accounts receivable. By allowing customers to pay some time after they receive the goods or services, you are granting credit, which we refer to as trade credit. Trade credit, also referred to as merchandise credit or dealer credit, is an informal credit arrangement. Unlike other forms of credit, trade credit is not usually evidenced by notes, but rather is generated spontaneously: Trade credit is granted when a customer buys goods or services.Monitoring Accounts Receivable: You can monitor how well accounts receivable are managed using financial ratios and aging schedules. Financial ratios can be used to get an overall picture of how fast we collect on accounts receivable. Aging schedules, which are breakdowns of the accounts receivable by how long they have been around, help you get a more detailed picture of your collection efforts.You can get an idea of how quickly we collect our accounts receivable by calculating the Number of Days of Credit ,which is the ratio of the balance in accounts receivable at a point in time (say, at the end of a year) to the credit sales per day (on average, the dollar amount of credit sales during a day):Number of days of credit = Accounts receivable/Credit sales per dayThe number of days credit ratio, also referred to as the average collection period and days sales outstanding (DSO), measures how long , on average, it takes us to collect on our accounts receivable.Inventory ManagementInventory is the stock of physical goods for eventual sale. Inventory consists of raw material, work-in-process, and finished goods available for sale. There are many factors in a decision of how much inventory to have on hand. As with accounts receivable, there is a tradeoff between the costs of investing in inventory and the costs of insufficient inventory. There’s a cost to too much inventory and there’s a cost of too little invento ry.Reasons for Holding Inventory: There are several reasons to hold inventory. The most obvious is that if you sell a product, you can’t transact business without inventory. Another obvious reason is that goods cannot be manufactured instantaneously. If you manufacture goods, you will likely have some inventory in various stages of production. This is referred to as work-in-process.You also may want to have some inventory of finished goods in case sales are greater than expected. Or you may want to hold some speculative inventory for dealing with events such as a change in the product or a change in the cost of the raw materials.Further, some firms hold inventory to satisfy contractual agreements. For example, aretail outlet that is the sole distributor or representative of a product in a region, may be required to carry a specified inventory of goods for sale.The decision to invest in inventory involves, ultimately, determining the level of inventory such that the marginal benefit (such as providing for transactions and precautionary needs) equal the marginal cost (such as carrying costs). The level of inventory at which the marginal benefits equal the marginal cost is the owners’ wealth maximizing level.Models of Inventory Management: There are alternative models for inventory management, but the basic idea for all of them is the same: Minimize inventory costs.The Economic Order Quantity Model: The Economic Order Quantity (EOQ) model helps us determine what quantity of inventory to order each time we order so that total inventory costs throughout the period are minimized. The economic order quantity model assumes that:1. Inventory is received instantaneously.2. Inventory is used uniformly over the period.3. Inventory shortages are not desirable.With these assumptions, firms can minimize the cost of inventory—the sum of the carrying costs and the ordering costs—by ordering a specific amount of inventory, referred to as the economic order quantity, each time they run out of inventory.Monitoring Inventory Management: We can monitor inventory by looking at financial ratios in much the same way we can monitor receivables. The number of days of inventory is the ratio of the dollar value of inventory at a point in time to the cost of goods sold per day:Number of days of inventory = Inventory/Average day’s cost of goods sold,This ratio is an estimate of the number of days’ worth of sales you have on hand. Combined with an estimate of the demand for your goods, this ratio helps you in planning your production and purchasing of goods. Another way to monitor inventory is the inventory turnover ratio—the ratio of what you sell over a period (the cost of goods sold) to what you have on hand at the end of that period (inventory):Inventory turnover =Cost of goods sold/Inventory,The inventory turnover ratio tells you, on average, how many times inventory flows through the firm—from raw materials to goods sold—during the period. If the typical inventory turnover for a firm is, say, five times, that means that the firm completes the cycles of investing in inventory and selling in five times in the year. If the turnover is lessthan usual, this may suggest either production is slower (resulting in relatively more work-in-process) or that sales are sluggish and perhaps need a boost from providing sales incentives or discounting prices.Also, interpretation of an inventory turnover ratio is not straightforward. Is a higher turnover good or bad? It could be either. A high turnover may mean that the firm is using its investment in inventory efficiently. But it might mean that the firm is risking a shortage of inventory. Not keeping enough on hand (relative to what is sold)incurs a chance of lost sales and customer goodwill. Using inventory turnover ratios along with measures of profitability can give you a better idea of whether you are getting an adequate return on your investment in inventory.The management of current assets requires balancing the cost of having too much tied up in the asset against the benefits of having a sufficient amount of the assets on hand. Though business practices and customs differ among industries, the general idea in the management of receivables is to grant credit to encourage sales and stay competitive, while considering the cost of tying up funds and of possible incurring bad debts. In the management of inventory, the investment in inventory differs among industries since the nature of the goods for sales dictates in large part the type of inventory required. The economic order quantity model and the just-in-time management technique can aid the financial manager in managing the investment in inventory.The common purpose of decisions related to accounts receivable and inventory is to minimize investment in short-term assets. But in all cases, you must have some investment in the asset because you will incur costs if you do not have enough of the asset. If you lack sufficient inventory or you fail to offer competitive credit terms, you may lose sales to your competitors.Receivable management involves a tradeoff between the benefits of increased sales and the costs of credit (for example, the opportunity cost of funds and defaults by credit customers).Credit and collection policies must be formulated to consider the benefits arising from increasing sales and the costs associated with extending credit.Inventory management involves a tradeoff between the benefits of having sufficient inventory to meet demand and the costs of inventory (for example, the opportunity cost of funds, storage, and obsolescence).Models of inventory management, such as the economic order quantity model and the just-in-time technique, can be used to analyze and minimize the costs of inventory.。