高职高专实用英语口语大赛训练题目
高职高专实用英语口语大赛训练题目PARTII

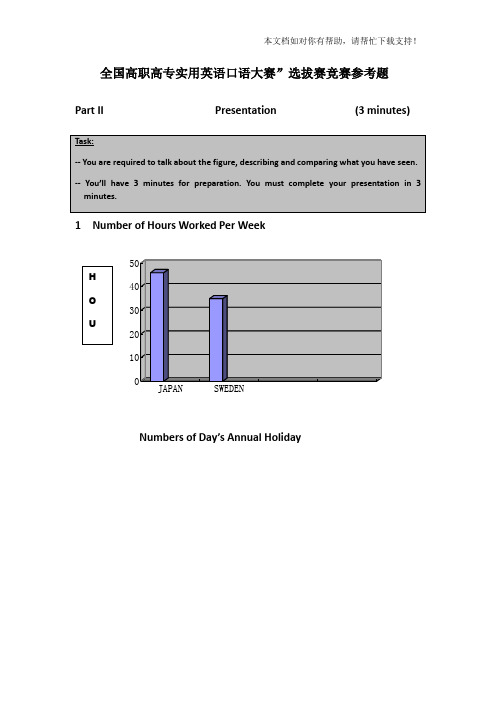
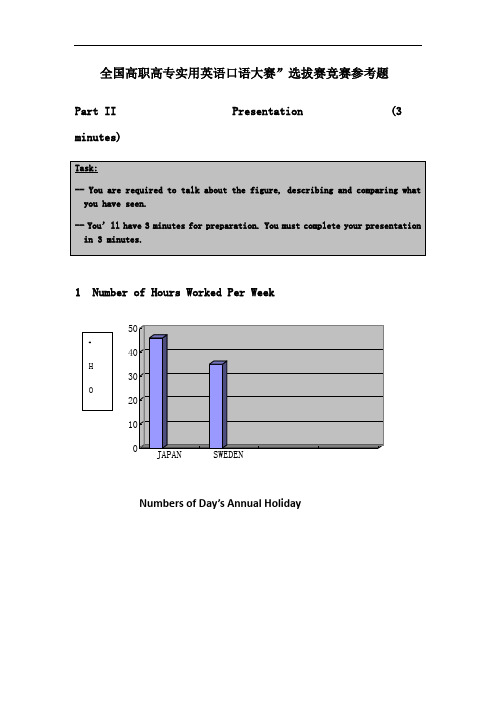
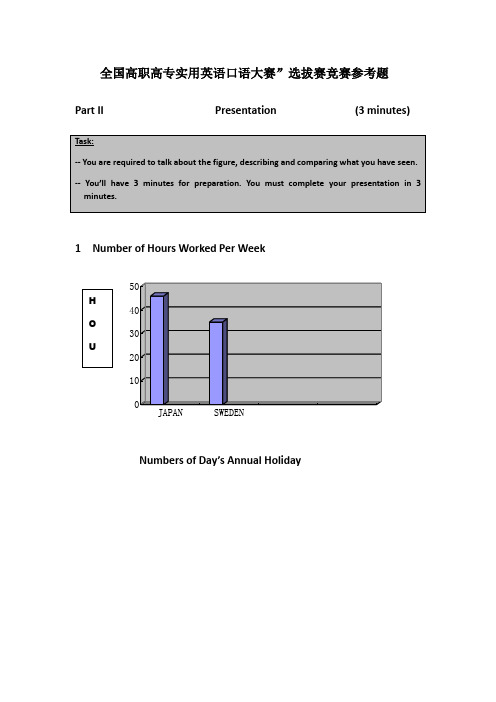
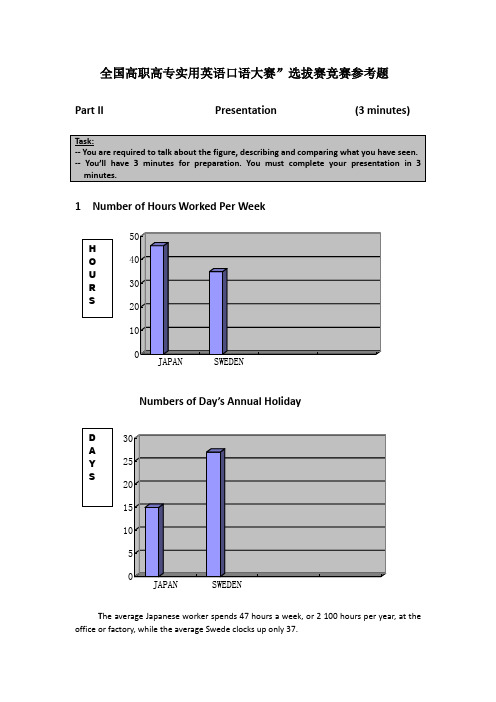
全国高职高专实用英语口语大赛”选拔赛竞赛参考题Part II Presentation (3 minutes)1 Number of Hours Worked Per WeekNumbers of Day’s Annual HolidayJAPANSWEDENT he average Japanese worker spends 47 hours a week, or 2 100 hours per year, at the office or factory, while the average Swede clocks up only 37.Swedish workers have 28 days of holiday per year, but the Japanese have only 15. A typical Japanese worker takes a six-day week, however, a Swedish worker works less than 5 days a week. If you are a worker, life is much easier in Sweden than in Japan, for you can work 10 hours shorter each week and you may have a much longer annual holiday.2 Change in Number of Visitors by CountryIn 2009 there were a large number of visitors to China on group or independent tour. But there werechanges in the numbers of vistors from differentcountries. Some increased but some decreased. The greatest change happened in Bangladesh. Thenumber of visitors from Bangladesh was down------there were 70% fewer group tour visitors and 48% independent travelers than the year before.GroupVisitors from Argentina were up by 53% for group tours and 26% for independent travelers. The number of visitors from Sweden was up by 24% for group tours and 15% for independent travelers.3 Sales of Computer Company50100150200250123456789101112At the beginning of the year sales of the computers were as 80 000 pounds. Sales rose steadily between February and April. However, they then fell slightly between April and July. Following a minor rise in August, sales declined noticeably from 160 000 pounds to 120 000 pounds. The downward trend continued, and in November sales reached their lowest point since January. Fortunately, thanks to a new marketing strategy and growing demands for holiday goods, sales increased dramatically at the end of the year and eventually reached 200 000 pounds. In all, it ’s a year of both rise and fall and was finally ended up with great success in sales.4 Time Spent on Different Media by TeenagersSales (Pound)×1000Month24681012141618s u r f o n -l i n ew a t c h T Vl i s t e n t o r a d i ou s e t e l e p h o n er e a d b o o k s &m a g a z i n e sThe chart shows a survey result about the hours the teenagers spend per week on the different media such as Internet, TV, radio, telephone and books or magazines in their spare time. Clearly, the teenagers like surfing the net very much and they usually spend 16.7 hours per week on-line. Next to this, they would prefer to watching TV, 13.6 hours per week being spent for that. Interestingly, in a week, they only spend about 6 hours reading books or magazines. And the amount of time they spend in listening to radio or using telephone is just in between.5Foreign Trade Growth of China (in billion of RMB)5101520253035J a n.F e b .M a r .A p r .M a y .J u n .J u l y .A u g .S e p t .O c t .N o v .D e c .0510152025303540hours/weekAs the graph shows, Chinese exports almost remained steady in January last year. In February, they went up rapidly. In the next three months, they fluctuated between 20 billion and 25 billion. From May to October, exports saw a slight decrease, then a small increase in November. In December, there was a significant increase. But after that, Chinese exports fell dramatically.Compared with exports, Chinese imports saw a continuous rise from the beginning of last year to May. In the next six months, they showed a gradual fluctuation. At the start of November, they began to pick up and from November to December, imports increased abruptly to reach a peak of 17 billion. At the beginning of this year, a sudden decline in exports led to steep fall in imports.6 Market Share of MEX Company ProductsThis pie graph shows the breakdown of the market share of MEX Company products in the world. As you can see, the U.S.A. is still our largest customer. It has the largest percentage of the market share of our products, at 40%. The second is Europe, at 30%. Next is Japan, which makes up 15% of our market share. And Australia accounts for 10%. Finally, the smallest part of our market share is taken up by Africa, with only 5%. Recently the world economy is not booming very fast, so we should improve our management system and try our best to produce better products and explore potential market in the future.7 Total profit & its expenditure(in thousand US dollars)Company name: SuperSonic Industries Group Corp.Africa 5%USA 40%Japan 15%new enterprises circulatingfundThis Graph reveals that our total profit of 2009 is US$200,000, which is US$50,000 higher than that of 2008. To expand business, our investment in establishing new enterprises was raised from US$80,000 in 2008 to US$140,000 in 2009. And the new circulating fund also increased from US$70,000 in 2008 to US$150,000 in 2009.8 Describe the caricature and give your comment.9Income sources of Chinese students are quite different from those of American students. In China, students get 90% of their money from their parents while in America, only 50% of students’ money is provided by parents. In addition, Chinese students earn only 5% of their money from part time jobs and 5% from fellowship or scholarship while income from these two resources for American students takes up 35% and 15% respectively of their total income.I think there are probably three reasons for their differences. First, because of the influence of different social and family values, Chinese students have formed the habit of asking for money from their parents while American students have developed more sense of being financially independent. Second, most Chinese parents devote too much care to their children and they would rather save up to afford their children’s education rather than encourage them to take part-time jobs. But in America, many parents pay more attention to developing the students’ability of self-reliance, so they encourage their children to find part-time job to earn some money by themselves. Third, since America is more developed than China, it is relatively easy for students to find part time jobs. In China, such opportunities are rather rare.I believe with the development of China, more and more Chinese students will realize and pay more attention to the necessity of self dependence. In addition, more and more opportunities will be provided for them to take part-time jobs. So more students will go out of the ivory tower to broaden their knowledge and to become the master of their own lives.10 The table below gives information about changes in modes of travel in England between 1985 and 2000.Summarise the information by selecting and reporting the main features, and make comparisons where relevant.The table indicates the number of miles by the average English person in 1985 and 2000, using various means of transport.The number of miles walked, cycled and traveled by local bus all decreased. Of these, the number of miles traveled by local bus decreased the most, from 429 miles in 1985 to 274 miles in 2000.The number of miles traveled by car, long distance bus, train and taxi all increased.The number of miles driven by car was 3,199 in 1985 and rose by 50% to 4,806 in 2000. The number of miles traveled by long distance bus more than doubled from 54 miles(1985)to 124 miles (2000). The number of miles driven by taxi trebled from 13 miles(1985) to 42 miles (2000). The use of other, unspecified, forms of transport alsoincreased.Overall, the number of miles traveled by the average English person rose from 4,740miles in 1985 to 6,475 miles in 2000, with the increase of cars accounting for almostall of that increase.11A. staying at homeB. travelingC. doing social investigationD. other waysFrom the two charts, we can see that in the past ten years the students who go traveling and do social investigations during vacations have increased greatly while those who stay at home have decreased a lot.There are several reasons for the changes. Firstly, with the development of economy, many people have become better off. Students can get financial support from their parents for traveling. Secondly, tourism has greatly developed over the past ten years. Many new scenic spots have been built and exploited. In addition, the students today are expected and encouraged to participate in facing the real world. In this way they can obtain the necessary experiences required when they go job-hunting upon graduation.From the changes in the charts, we can predict that more and more college students will make their vacations interesting and worthwhile by going to the outside world instead of staying at home.01020304050601213 How Americans spend their money1415 The table below show social and economic indicators of fourcountries in 1994, according to United Nations statistics.Summarize the information by selecting and reporting the main features, and make comparisons where relevant.. word资料。
高职高专实用英语口语大赛训练题目
全国高职高专实用英语口语大赛”选拔赛竞赛参考题Part II Presentation (3 minutes)Number of Hours Worked Per Week1Numbers of Day’s Annual HolidayJAPANSWEDENT he average Japanese worker spends 47 hours a week, or 2 100 hours per year, at the office or factory, while the average Swede clocks up only 37.Swedish workers have 28 days of holiday per year, but the Japanese have only 15. A typical Japanese worker takes a six-day week, however, a Swedish worker works less than 5 days a week. If you are a worker, life is much easier in Sweden than in Japan, for you can work 10 hours shorter each week and you may have a much longer annual holiday.2 Change in Number of Visitors by CountryIn 2009 there were a large number of visitors to China on group or independent tour. But there were changes in the numbers of vistors from different countries. Some increasedGroupbut some decreased. The greatest change happened in Bangladesh. The number of visitors from Bangladesh was down------there were 70% fewer group tour visitors and 48% independent travelers than the year before. Visitors from Argentina were up by 53% for group tours and 26% for independent travelers. The number of visitors from Sweden was up by 24% for group tours and 15% for independent travelers.3 Sales of Computer Company50100150200250123456789101112At the beginning of the year sales of the computers were as 80 000 pounds. Sales rosesteadily between February and April. However, they then fell slightly between April and July. Following a minor rise in August, sales declined noticeably from 160 000 pounds to 120 000 pounds. The downward trend continued, and in November sales reached their lowest point since January. Fortunately, thanks to a new marketing strategy and growing demands for holiday goods, sales increased dramatically at the end of the year and eventually reached 200 000 pounds. In all, it’s a year of both rise and fall and was finally ended up with great success in sales.4 Time Spent on Different Media by TeenagersSales (Pound)×1000Month24681012141618s u r f o n -l i n ew a t c h T Vl i s t e n t o r a d i ou s e t e l e p h o n er e a d b o o k s &m a g a z i n e sThe chart shows a survey result about the hours the teenagers spend per week on the different media such as Internet, TV, radio, telephone and books or magazines in their spare time. Clearly, the teenagers like surfing the net very much and they usually spend 16.7 hours per week on-line. Next to this, they would prefer to watching TV, 13.6 hours per week being spent for that. Interestingly, in a week, they only spend about 6 hours reading books or magazines. And the amount of time they spend in listening to radio or using telephone is just in between.5 Foreign Trade Growth of China (in billion of RMB)As the graph shows, Chinese exports almost remained steady in January last year. In February, they went up rapidly. In the next three months, they fluctuated between 20 billion and 25 billion. From May to October, exports saw a slight decrease, then a small increase in November. In December, there was a significant increase. But after that, Chinese exports fell dramatically.Compared with exports, Chinese imports saw a continuous rise from the beginning of last year to May. In the next six months, they showed a gradual fluctuation. At the start of November, they began to pick up and from November to December, imports increased abruptly to reach a peak of 17 billion. At the beginning of this year, a sudden decline in exports led to steep fall in imports.6 Market Share of MEX Company Productshours/weekThis pie graph shows the breakdown of the market share of MEX Company products in the world. As you can see, the is still our largest customer. It has the largest percentage of the market share of our products, at 40%. The second is Europe, at 30%. Next is Japan, which makes up 15% of our market share. And Australia accounts for 10%. Finally, the smallest part of our market share is taken up by Africa, with only 5%. Recently the world economy is not booming very fast, so we should improve our management system and try our best to produce better products and explore potential market in the future.7 Total profit & its expenditure(in thousand US dollars)Company name: SuperSonic Industries Group Corp.This Graph reveals that our total profit of 2009 is US$200,000, which is US$50,000 higher than that of 2008. To expand business, our investment in establishing new enterprises was raised from US$80,000 in 2008 to US$140,000 in 2009. And the new circulating fund also increased from US$70,000 in 2008 to US$150,000 in 2009.8 Describe the caricature and give your comment. 9Africa 5%USA 40%Japan 15%American Students 50% 35% 15%Chinese Students 90% 5% 5%Income Sources Between Chinese Students and American StudentsIncome sources of Chinese students are quite different from those of American students. In China, students get 90% of their money from their parents while in America, only 50% of students’ money is provided by parents. In addition, Chinese students earn on ly 5% of their money from part time jobs and 5% from fellowship or scholarship while income from these two resources for American students takes up 35% and 15% respectively of their total income.I think there are probably three reasons for their differences. First, because of the influence of different social and family values, Chinese students have formed the habit of asking for money from their parents while American students have developed more sense of being financially independent. Second, most Chinese parents devote too much care to their children and they would rather save up to afford their children’s education rather than encourage them to take part-time jobs. But in America, many parents pay more attention to developing the students’ ability of self-reliance, so they encourage their children to find part-time job to earn some money by themselves. Third, since America is more developed than China, it is relatively easy for students to find part time jobs. In China, such opportunities are rather rare.I believe with the development of China, more and more Chinese students will realize and pay more attention to the necessity of self dependence. In addition, more and more opportunities will be provided for them to take part-time jobs. So more students will go out of the ivory tower to broaden their knowledge and to become the master of their own lives.10 The table below gives information about changes in modes of travel in England between 1985 and 2000.Summarise the information by selecting and reporting the main features, and make comparisons where relevant.The table indicates the number of miles by the average English person in 1985 and 2000, using various means of transport.The number of miles walked, cycled and traveled by local bus all decreased. Of these, the number of miles traveled by local bus decreased the most, from 429 miles in 1985 to 274 miles in 2000.The number of miles traveled by car, long distance bus, train and taxi all increased.The number of miles driven by car was 3,199 in 1985 and rose by 50% to 4,806 in 2000. The number of miles traveled by long distance bus more than doubled from 54 miles(1985)to 124 miles (2000). The number of miles driven by taxi trebled from 13 miles (1985) to 42 miles (2000). The use of other, unspecified, forms of transport also increased.Overall, the number of miles traveled by the average English person rose from 4,740 miles in 1985 to 6,475 miles in 2000, with the increase of cars accounting for almostall of that increase.11A. staying at homeB. travelingC. doing social investigationD. other waysFrom the two charts, we can see that in the past ten years the students who go traveling and do social investigations during vacations have increased greatly while those who stay at home have decreased a lot.There are several reasons for the changes. Firstly, with the development of economy, many people have become better off. Students can get financial support from their parents for traveling. Secondly, tourism has greatly developed over the past ten years. Many new scenic spots have been built and exploited. In addition, the students today are expected and encouraged to participate in facing the real world. In this way they can obtain the necessary experiences required when they go job-hunting upon graduation.From the changes in the charts, we can predict that more and more college students will make their vacations interesting and worthwhile by going to the outside world instead of staying at home.1213 How Americans spend their money1415 The table below show social and economic indicators of fourcountries in 1994, according to United Nations statistics.Summarize the information by selecting and reporting the main features, and make comparisons where relevant.。
高职英语口语试题及答案

高职英语口语试题及答案一、自我介绍(Self-introduction)1. 请用英语简单介绍你自己。
- 答案:My name is [Your Name], and I am currently studying at [Your School Name]. I am majoring in [Your Major] and I am passionate about [Your Interests].二、日常对话(Daily Conversations)1. 你通常如何度过周末?- 答案:I usually spend my weekends [Describe your weekend activities, such as reading, going to the gym, or hanging out with friends].2. 你最喜欢的食物是什么?- 答案:My favorite food is [Your Favorite Food] because it is [Describe why you like it, such as delicious, healthy, or comforting].三、情景对话(Situational Dialogues)1. 假设你是一名酒店前台接待员,一位外国客人需要帮助找到附近的餐厅。
- 答案:Excuse me, sir/madam. I understand you are looking for a restaurant nearby. We have a few recommendations within walking distance. Would you like me to provide you with alist or directions?2. 你是一名导游,正在向游客介绍一个著名景点。
- 答案:Ladies and gentlemen, welcome to [Name of theAttraction]. This is one of the most famous landmarks in our city, known for its [Historical Significance or Unique Features]. Please follow me as I guide you through the site.四、观点表达(Expressing Opinions)1. 你认为学习英语最重要的原因是什么?- 答案:I believe the most important reason to learn English is its global significance. It is widely used in business, education, and travel, making it an essential skill for communication and personal development.2. 描述一下你对环保的看法。
高职高专实用英语口语大赛训练题目PART-II
全国高职高专实用英语口语大赛”选拔赛竞赛参考题Part II Presentation (3 minutes)1 Number of Hours Worked Per WeekJAPAN SWEDENNumbers of Day’s Annual HolidayT he average Japanese worker spends 47 hours a week, or 2 100 hours per year, at theoffice or factory, while the average Swede clocks up only 37.Swedish workers have 28 days of holiday per year, but the Japanese have only 15. A typical Japanese worker takes a six -day week, however, a Swedish worker works less than 5 days a week. If you are a worker, life is much easier in Sweden than in Japan, for you can work 10 hours shorter each week and you may have a much longer annual holiday.2 Change in Number of Visitors by Country}GroupIn 2009 there were a large number of visitors to China on group or independent tour. But there were changes in the numbers of vistors from different countries. Some increased but some decreased. The greatest change happened in Bangladesh. The number of visitors from Bangladesh was down ------there were 70% fewer group tour visitors and 48% independent travelers than the year before. Visitors from Argentina were up by 53% for group tours and 26% for independent travelers. The number of visitors from Sweden was up by 24% for group tours and 15% for independent travelers.3 Sales of Computer Company;50100150200250123456789101112At the beginning of the year sales of the computers were as 80 000 pounds. Sales rose steadily between February and April. However, they then fell slightly between April and July. Following a minor rise in August, sales declined noticeably from 160 000 pounds to 120 000 pounds. The downward trend continued, and in November sales reached their lowest point since January. Fortunately, thanks to a new marketing strategy and growing demands for holiday goods, sales increased dramatically at the end of the year and eventually reached 200 000 pounds. In all, it’s a year of both rise and fall and was finally ended up with great success in sales.Sales (Pound)×1000Month~4 Time Spent on Different Media by Teenagers24681012141618s u r f o n -l i n ew a t c h T Vl i s t e n t o r a d i ou s e t e l e p h o n er e a d b o o k s &m a g a z i n e sThe chart shows a survey result about the hours the teenagers spend per week on the different media such as Internet, TV, radio, telephone and books or magazines in their spare time. Clearly, the teenagers like surfing the net very much and they usually spend 16.7 hours per week on -line. Next to this, they would prefer to watching TV, 13.6 hours per week being spent for that. Interestingly, in a week, they only spend about 6 hours reading books or magazines. And the amount of time they spend in listening to radio or using telephone is just in between.5 Foreign Trade Growth of China (in billion of RMB)hours/week5101520253035J a n .F e b .M a r .A p r .M a y .J u n .J u l y .A u g .S e p t .O c t .N o v .D e c .510152025303540As the graph shows, Chinese exports almost remained steady in January last year. In February, they went up rapidly. In the next three months, they fluctuated between 20 billion and 25 billion. From May to October, exports saw a slight decrease, then a small increase in November. In December, there was a significant increase. But after that, Chinese exports fell dramatically.(Compared with exports, Chinese imports saw a continuous rise from the beginning of last year to May. In the next six months, they showed a gradual fluctuation. At the start of November, they began to pick up and from November to December, imports increased abruptly to reach a peak of 17 billion. At the beginning of this year, a sudden decline in exports led to steep fall in imports.6 Market Share of MEX Company ProductsJapan 15%This pie graph shows the breakdown of the market share of MEX Company products in the world. As you can see, the U.S.A. is still our largest customer. It has the largestpercentage of the market share of our products, at 40%. The second is Europe, at 30%. Next is Japan, which makes up 15% of our market share. And Australia accounts for 10%. Finally, the smallest part of our market share is taken up by Africa, with only 5%. Recently the world economy is not booming very fast, so we should improve our management system and try our best to produce better products and explore potential market in the future.7 Total profit & its expenditure(in thousand US dollars)Company name: SuperSonic Industries Group Corp.newenterprisescirculatingfund.This Graph reveals that our total profit of 2009 is US$200,000, which is US$50,000higher than that of 2008. To expand business, our investment in establishing new enterprisesAfrica 5%*USA 40%was raised from US$80,000 in 2008 to US$140,000 in 2009. And the new circulating fund also increased from US$70,000 in 2008 to US$150,000 in 2009.8 Describe the caricature and give your comment.9Income Sources Between Chinese Students and American StudentsIncome sources of Chinese students are quite different from those of American students. In China, students get 90% of their money from their parents while in America, only 50% of students’ money is provided by parents. In addition, Chinese students earn only 5% of their money from part time jobs and 5% from fellowship or scholarship while income from these two resources for American students takes up 35% and 15% respectively of their total income.I think there are probably three reasons for their differences. First, because of the influence of different social and family values, Chinese students have formed the habit of asking for money from their parents while American students have developed more sense of being financially independent. Second, most Chinese parents devote too much care to their children and they would rather save up to afford their children’s education rather than encourage them to take part-time jobs. But in America, many parents pay more attention to developing the students’ ability of self-reliance, so they encourage their children to find part-time job to earn some money by themselves. Third, since America is more developed than China, it is relatively easy for students to find part time jobs. In China, such opportunities are rather rare.<I believe with the development of China, more and more Chinese students will realize and pay more attention to the necessity of self dependence. In addition, more and more opportunities will be provided for them to take part-time jobs. So more students will go out of the ivory tower to broaden their knowledge and to become the master of their own lives.10 The table below gives information about changes in modes of travel in England between 1985 and 2000.Summarise the information by selecting and reporting the main features, and make comparisons where relevant.The table indicates the number of miles by the average English person in 1985 and 2000, using various means of transport.The number of miles walked, cycled and traveled by local bus all decreased. Of these, the number of miles traveled by local bus decreased the most, from 429 miles in 1985 to 274 miles in 2000.The number of miles traveled by car, long distance bus, train and taxi all increased.The number of miles driven by car was 3,199 in 1985 and rose by 50% to 4,806 in 2000. The number of miles traveled by long distance bus more than doubled from 54 miles(1985)to 124 miles (2000). The number of miles driven by taxi trebled from 13 miles(1985) to 42 miles (2000). The use of other, unspecified, forms of transport alsoincreased.Overall, the number of miles traveled by the average English person rose from 4,740miles in 1985 to 6,475 miles in 2000, with the increase of cars accounting for almostall of that increase.)11A. staying at homeB. travelingC. doing social investigationD. other waysFrom the two charts, we can see that in the past ten years the students who go traveling and do social investigations during vacations have increased greatly while those who stay at home have decreased a lot.There are several reasons for the changes. Firstly, with the development of economy, many people have become better off. Students can get financial support from their parents for traveling. Secondly, tourism has greatly developed over the past ten years. Many new scenic spots have been built and exploited. In addition, the students today are expected andencouraged to participate in facing the real world. In this way they can obtain the necessary experiences required when they go job-hunting upon graduation.From the changes in the charts, we can predict that more and more college students will make their vacations interesting and worthwhile by going to the outside world instead of staying at home.)12./10203040*5060AcquireinformationEntertainment MakingfriendsStudy…Others Percentag200220032004College Students’ On-line Behaviors13 How Americans spend their money ,1415 The table below show social and economic indicators of fourcountries in 1994, according to United Nations statistics.Summarize the information by selecting and reporting the main features, and make comparisons where relevant.。
高职高专实用英语口语大赛样题

Part I Short Speech (2 minutes)Dear customers,Welcome to the world of Lakeland. Here is just a small selection of the 1000s of exciting products we have in our vast range. A family-run business with over 40 years' mail order experience under our belt, we're very proud of our unrivalled collection of innovative, practical cookware and homeware ideas gathered from all around the world.Placing an order couldn't be easier: by phone, post or online, our friendly, knowledgeable staff will ensure all your choices are delivered safely and speedily, direct to your door. We will also enclose our full catalogue for you to browse through. As every item is backed by our unequalled no-quibble guarantee, you can always shop in confidence with Lakeland. We've got 34 retail store throughout the country, and if ever you're near one, a warm welcome awaits you.Sam Rayner, Managing Director(141 words)Part II Presentation (3 minutes) Task:-- You are required to talk about the following chart, describing and comparing a survey finding on kids’ use of Internet Chat Rooms. You might include your speculative reasons to support your argument.-- You’ll have 3 minutes fo r preparation. You must complete your presentation in 3 minutes.Part III Interview (3 minutes) Now you’ll see an advertisement of an airline.Task:Suppose you are a marketing representative. You will have to answer some questions from a customer[Contestant: Marketing RepresentativeQuestion Master: CustomerNo. of Questions: 8-10]。
高职高专实用英语口语大赛训练题目PART II
全国高职高专实用英语口语大赛”选拔赛竞赛参考题Part II Presentation (3 minutes)Number of Hours Worked Per Week1Numbers of Day’s Annual HolidayJAPANSWEDENT he average Japanese worker spends 47 hours a week, or 2 100 hours per year, at the office or factory, while the average Swede clocks up only 37.Swedish workers have 28 days of holiday per year, but the Japanese have only 15. A typical Japanese worker takes a six-day week, however, a Swedish worker works less than 5 days a week. If you are a worker, life is much easier in Sweden than in Japan, for you can work 10 hours shorter each week and you may have a much longer annual holiday.2 Change in Number of Visitors by CountryIn 2009 there were a large number of visitors to China on group or independent tour. But there were changes in the numbers of vistors from different countries. Some increasedGroupbut some decreased. The greatest change happened in Bangladesh. The number of visitors from Bangladesh was down------there were 70% fewer group tour visitors and 48% independent travelers than the year before. Visitors from Argentina were up by 53% for group tours and 26% for independent travelers. The number of visitors from Sweden was up by 24% for group tours and 15% for independent travelers.3 Sales of Computer Company50100150200250123456789101112At the beginning of the year sales of the computers were as 80 000 pounds. Sales rose steadily between February and April. However, they then fell slightly between April and July. Following a minor rise in August, sales declined noticeably from 160 000 pounds to 120 000 pounds. The downward trend continued, and in November sales reached their lowest point since January. Fortunately, thanks to a new marketing strategy and growing demands for holiday goods, sales increased dramatically at the end of the year and eventually reached 200 000 pounds. In all, it’s a year of both rise and fall and was finally ended up with great success in sales.Sales (Pound)×1000Month4 Time Spent on Different Media by Teenagers24681012141618s u r f o n -l i n ew a t c h T Vl i s t e n t o r a d i ou s e t e l e p h o n er e a d b o o k s &m a g a z i n e sThe chart shows a survey result about the hours the teenagers spend per week on the different media such as Internet, TV, radio, telephone and books or magazines in their spare time. Clearly, the teenagers like surfing the net very much and they usually spend 16.7 hours per week on-line. Next to this, they would prefer to watching TV, 13.6 hours per week being spent for that. Interestingly, in a week, they only spend about 6 hours reading books or magazines. And the amount of time they spend in listening to radio or using telephone is just in between.5 Foreign Trade Growth of China (in billion of RMB)hours/week5101520253035J a n.F e b .M a r .A p r .M a y .J u n .J u l y .A u g .S e p t .O c t .N o v .D e c .510152025303540As the graph shows, Chinese exports almost remained steady in January last year. In February, they went up rapidly. In the next three months, they fluctuated between 20 billion and 25 billion. From May to October, exports saw a slight decrease, then a small increase in November. In December, there was a significant increase. But after that, Chinese exports fell dramatically.Compared with exports, Chinese imports saw a continuous rise from the beginning of last year to May. In the next six months, they showed a gradual fluctuation. At the start of November, they began to pick up and from November to December, imports increased abruptly to reach a peak of 17 billion. At the beginning of this year, a sudden decline in exports led to steep fall in imports.6 Market Share of MEX Company ProductsJapan 15%This pie graph shows the breakdown of the market share of MEX Company products in the world. As you can see, the U.S.A. is still our largest customer. It has the largestpercentage of the market share of our products, at 40%. The second is Europe, at 30%. Next is Japan, which makes up 15% of our market share. And Australia accounts for 10%. Finally, the smallest part of our market share is taken up by Africa, with only 5%. Recently the world economy is not booming very fast, so we should improve our management system and try our best to produce better products and explore potential market in the future.7 Total profit & its expenditure(in thousand US dollars)Company name: SuperSonic Industries Group Corp.newenterprisescirculatingfundThis Graph reveals that our total profit of 2009 is US$200,000, whichis US$50,000 higher than that of 2008. To expand business, our investment in establishing new enterprises was raised from US$80,000 in 2008 to US$140,000 in 2009. And the new circulating fund also increased from US$70,000 in 2008 to US$150,000 in 2009.Africa 5%USA 40%8Describe the caricature and give your comment. 9Source of Income Percentage of Total Income Parents Part-time job Fellowship orScholarshipAmerican Students 50% 35% 15%Chinese Students 90% 5% 5%Income Sources Between Chinese Students and American StudentsIncome sources of Chinese students are quite different from those of American students. In China, students get 90% of their money from their parents while in America, only 50% of students’ money is provided by parents. In additio n, Chinese students earn only 5% of their money from part time jobs and 5% from fellowship or scholarship while income fromthese two resources for American students takes up 35% and 15% respectively of their total income.I think there are probably three reasons for their differences. First, because of the influence of different social and family values, Chinese students have formed the habit of asking for money from their parents while American students have developed more sense of being financially independent. Second, most Chinese parents devote too much care to their children and they would rather save up to afford their children’s education rather than encourage them to take part-time jobs. But in America, many parents pay more attention to developing the students’ ability of self-reliance, so they encourage their children to find part-time job to earn some money by themselves. Third, since America is more developed than China, it is relatively easy for students to find part time jobs. In China, such opportunities are rather rare.I believe with the development of China, more and more Chinese students will realize and pay more attention to the necessity of self dependence. In addition, more and more opportunities will be provided for them to take part-time jobs. So more students will go out of the ivory tower to broaden their knowledge and to become the master of their own lives.10 The table below gives information about changes in modes of travel in England between 1985 and 2000.Summarise the information by selecting and reporting the main features, and make comparisons where relevant.The table indicates the number of miles by the average English person in 1985 and 2000, using various means of transport.The number of miles walked, cycled and traveled by local bus all decreased. Of these, the number of miles traveled by local bus decreased the most, from 429 miles in 1985 to 274 miles in 2000.The number of miles traveled by car, long distance bus, train and taxi all increased.The number of miles driven by car was 3,199 in 1985 and rose by 50% to 4,806 in 2000. The number of miles traveled by long distance bus more than doubled from 54 miles(1985)to 124 miles (2000). The number of miles driven by taxi trebled from 13 miles(1985) to 42 miles (2000). The use of other, unspecified, forms of transport alsoincreased.Overall, the number of miles traveled by the average English person rose from 4,740miles in 1985 to 6,475 miles in 2000, with the increase of cars accounting for almostall of that increase.11A. staying at homeB. travelingC. doing social investigationD. other waysFrom the two charts, we can see that in the past ten years the students who go traveling and do social investigations during vacations have increased greatly while those who stay at home have decreased a lot.There are several reasons for the changes. Firstly, with the development of economy, many people have become better off. Students can get financial support from their parents for traveling. Secondly, tourism has greatly developed over the past ten years. Many new scenic spots have been built and exploited. In addition, the students today are expected and encouraged to participate in facing the real world. In this way they can obtain the necessary experiences required when they go job-hunting upon graduation.From the changes in the charts, we can predict that more and more college students will make their vacations interesting and worthwhile by going to the outside world instead of staying at home.1213 How Americans spend their money1020 30405060 informationEntertainmentMaking friends StudyOthersPercentageCollege Students ’ On-line Behaviors1415 The table below show social and economic indicators of fourcountries in 1994, according to United Nations statistics.Summarize the information by selecting and reporting the main features, and make comparisons where relevant.。
高职高专实用英语口语大赛训练题目PART-II
全国高职高专实用英语口语大赛”选拔赛竞赛参考题Part IIPresentation(3 minutes)1 Number of Hours Worked Per WeekJAPANSWEDENNumbers of Day’s Annual HolidayJAPANSWEDENT he average Japanese worker spends 47 hours a week, or 2 100 hours per year, at the office or factory, while the average Swede clocks up only 37.Swedish workers have 28 days of holiday per year, but the Japanese have only 15. A typical Japanese worker takes a six -day week, however, a Swedish worker works less than 5 days a week. If you are a worker, life is much easier in Sweden than in Japan, for you can work 10 hours shorter each week and you may have a much longer annual holiday.2 Change in Number of Visitors by CountryIn 2009 there were a large number of visitors to China on group or independent tour. But there were changes in the numbers of vistors from different countries. Some increased but some decreased. The greatest change happened in Bangladesh. The number of visitors from Bangladesh was down ------there were 70% fewer group tour visitors and 48% independent travelers than theyear before. Visitors from Argentina wereup by 53% for group tours and 26% for independent travelers. The number of visitors from Sweden was up by 24% for group tours and 15% for independent travelers.3 Sales of Computer CompanyGroup×100050100150200250123456789101112At the beginning of the year sales of the computers were as 80 000 pounds. Sales rose steadily between February and April. However, they then fell slightly between April and July. Following a minor rise in August, sales declined noticeably from 160 000 pounds to 120 000 pounds. The downward trend continued, and in November sales reached their lowest point since January. Fortunately, thanks to a new marketing strategy and growing demands for holiday goods, sales increased dramatically at the end of the year and eventually reached 200 000 pounds. In all, it’s a year of both rise and fall and was finally ended up with great success in sales.4 Time Spent on Different Media by TeenagersSales (Pound)Month24681012141618s u r f o n -l i n ew a t c h T Vl i s t e n t o r a d i ou s e t e l e p h o n er e a d b o o k s &m a g a z i n e sThe chart shows a survey result about the hours the teenagers spend per week on the different media such as Internet, TV, radio, telephone and books or magazines in their spare time. Clearly, the teenagers like surfing the net very much and they usually spend 16.7 hours per week on -line. Next to this, they would prefer to watching TV, 13.6 hours per week being spent for that. Interestingly, in a week, they only spend about 6 hours reading books or magazines. And the amount of time they spend in listening to radio or using telephone is just in between.5 Foreign Trade Growth of China (in billion of RMB)5101520253035J a n.F e b .M a r .A p r .M a y .J u n .J u l y .A u g .S e p t .O c t .N o v .D e c .0510152025303540hours/weekAs the graph shows, Chinese exports almost remained steady in January last year. In February, they went up rapidly. In the next three months, they fluctuated between 20 billion and 25 billion. From May to October, exports saw a slight decrease, then a small increase in November. In December, there was a significant increase. But after that, Chinese exports fell dramatically.Compared with exports, Chinese imports saw a continuous rise from the beginning of last year to May. In the next six months, they showed a gradual fluctuation. At the start of November, they began to pick up and from November to December, imports increased abruptly to reach a peak of 17 billion. At the beginning of this year, a sudden decline in exports led to steep fall in imports.6 Market Share of MEX Company ProductsThis pie graph shows the breakdown of the market share of MEX Company products in the world. As you can see, the U.S.A. is still our largest customer. It has the largestpercentage of the market share of our products, at 40%. The second is Europe, at 30%. Next is Japan, which makes up 15% of our market share. And Australia accounts for 10%. Finally, the smallest part of our market share is taken up by Africa, with only 5%. Recently the world economy is not booming very fast, so we should improve our management system and try our best to produce better products and explore potential market in the future.7 Total profit & its expenditure(in thousand US dollars)Company name: SuperSonic Industries Group Corp.Africa 5%Europe 30%USA 40%Japan 15%new enterprises circulatingfundThis Graph reveals that our total profit of 2009 is US$200,000, which is US$50,000 higher than that of 2008. To expand business, our investment in establishing new enterprises was raised from US$80,000 in 2008 to US$140,000 in 2009. And the new circulating fund also increased from US$70,000 in 2008 to US$150,000 in 2009.8 Describe the caricature and give your comment.9Chinese Students 90% 5% 5%Income sources of Chinese students are quite different from those of American students. In China, students get 90% of their money from their parents while in America, only 50% of students’ money is provided by parents. In addition, Chinese students earn only 5% of their money from part time jobs and 5% from fellowship or scholarship while income from these two resources for American students takes up 35% and 15% respectively of their total income.I think there are probably three reasons for their differences. First, because of the influence of different social and family values, Chinese students have formed the habit of asking for money from their parents while American students have developed more sense of being financially independent. Second, most Chinese parents devote too much care to their children and they would rather save up to afford their children’s education rather than encourage them to take part-time jobs. But in America, many parents pay more attention to developing the students’ ability of self-reliance, so they encourage their children to find part-time job to earn some money by themselves. Third, since America is more developed than China, it is relatively easy for students to find part time jobs. In China, such opportunities are rather rare.I believe with the development of China, more and more Chinese students will realize and pay more attention to the necessity of self dependence. In addition, more and more opportunities will be provided for them to take part-time jobs. So more students will go out of the ivory tower to broaden their knowledge and to become the master of their own lives.10 The table below gives information about changes in modes of travel in England between 1985 and 2000.Summarise the information by selecting and reporting the main features, and make comparisons where relevant.The table indicates the number of miles by the average English person in 1985 and 2000, using various means of transport.The number of miles walked, cycled and traveled by local bus all decreased. Of these, the number of miles traveled by local bus decreased the most, from 429 miles in 1985 to 274 miles in 2000.The number of miles traveled by car, long distance bus, train and taxi all increased.The number of miles driven by car was 3,199 in 1985 and rose by 50% to 4,806 in 2000. The number of miles traveled by long distance bus more than doubled from 54 miles(1985)to 124 miles (2000). The number of miles driven by taxi trebled from 13 miles(1985) to 42 miles (2000). The use of other, unspecified, forms of transport also increased.Overall, the number of miles traveled by the average English person rose from 4,740 miles in 1985 to 6,475 miles in 2000, with the increase of cars accounting for almost all of that increase. 11A. staying at homeB. travelingC. doing social investigationD. other waysFrom the two charts, we can see that in the past ten years the students who go traveling and do social investigations during vacations have increased greatly while those who stay at home have decreased a lot.There are several reasons for the changes. Firstly, with the development of economy, many people have become better off. Students can get financial support from their parents for traveling. Secondly, tourism has greatly developed over the past ten years. Many new scenic spots have been built and exploited. In addition, the students today are expected and encouraged to participate in facing the real world. In this way they can obtain the necessary experiences required when they go job -hunting upon graduation.From the changes in the charts, we can predict that more and more college students will make their vacations interesting and worthwhile by going to the outside world instead of staying at home. 1210 20 30 40 50 60 Percentage College Students ’ On-line Behaviors13 How Americans spend their money1415 The table below show social and economic indicators of fourcountries in 1994, according to United Nations statistics.Summarize the information by selecting and reporting the main features, and make comparisons where relevant.。
高职高专实用英语口语大赛训练题目

全国高职高专实用英语口语大赛”选拔赛竞赛参考题Part IIPresentation(3 minutes)1Number of Hours Worked Per WeekJAPANSWEDENNumbers of Day ’s Annual HolidayJAPANSWEDENT he average Japanese worker spends 47 hours a week, or 2 100 hours per year, atthe office or factory, while the average Swede clocks up only 37.Swedish workers have 28 days of holiday per year, but the Japanese have only 15. A typical Japanese worker takes a six-day week, however, a Swedish worker works less than 5 days a week. If you are a worker, life is much easier in Sweden than in Japan, for you can work 10 hours shorter each week and you may have a much longer annual holiday.2 Change in Number of Visitors by CountryIn 2009 there were a large number of visitors to China on group or independent tour. But there were changes in the numbers of vistors from different countries. Some increased but some decreased. The greatest change happened in Bangladesh. The number of visitors from Bangladesh was down------there were 70% fewer group tour visitors and 48% independent travelers than the year before. Visitors from Argentina were up by 53%for group toursand 26% for independent travelers. The number of visitors from Sweden was up by 24% for group tours and 15% for independent travelers.GroupIndependent3 Sales of Computer Company50100150200250123456789101112At the beginning of the year sales of the computers were as 80 000 pounds. Sales rose steadily between February and April. However, they then fell slightly between April and July. Following a minor rise in August, sales declined noticeably from 160 000 pounds to 120 000 pounds. The downward trend continued, and in November sales reached their lowest point since January. Fortunately, thanks to a new marketing strategy and growing demands for holiday goods, sales increased dramatically at the end of the year and eventually reached 200 000 pounds. In all, it ’s a year of both rise and fall and was finally ended up with great success in sales.Sales (Pound)×1000Month4 Time Spent on Different Media by Teenagers24681012141618s u r f o n -l i n ew a t c h T Vl i s t e n t o r a d i ou s e t e l e p h o n er e a d b o o k s &m a g a z i n e sThe chart shows a survey result about the hours the teenagers spend per week on the different media such as Internet, TV, radio, telephone and books or magazines in their spare time. Clearly, the teenagers like surfing the net very much and they usually spend 16.7 hours per week on-line. Next to this, they would prefer to watching TV, 13.6 hours per week being spent for that. Interestingly, in a week, they only spend about 6 hours reading books or magazines. And the amount of time they spend in listening to radio or using telephone is just in between.hours/week5 Foreign Trade Growth of China(in billion of RMB)5101520253035J a n .F e b .M a r .A p r .M a y .J u n .J u l y .A u g .S e p t .O c t .N o v .D e c .0510152025303540As the graph shows, Chinese exports almost remained steady in January last year. In February, they went up rapidly. In the next three months, they fluctuated between 20 billion and 25 billion. From May to October, exports saw a slight decrease, then a small increase in November. In December, there was a significant increase. But after that, Chinese exports fell dramatically.Compared with exports, Chinese imports saw a continuous rise from the beginning of last year to May. In the next six months, they showed a gradual fluctuation. At the start of November, they began to pick up and from November to December, imports increased abruptly to reach a peak of 17 billion. At the beginning of this year, a sudden decline in exports led to steep fall in imports.6 Market Share of MEX Company ProductsJapan 15%This pie graph shows the breakdown of the market share of MEX Companyproducts in the world. As you can see, the U.S.A. is still our largest customer. It has the largest percentage of the market share of our products, at 40%. The second is Europe, at 30%. Next is Japan, which makes up 15% of our market share. And Australia accounts for 10%. Finally, the smallest part of our market share is taken up by Africa, with only 5%. Recently the world economy is not booming very fast, so we should improve ourmanagement system and try our best to produce better products and explore potential market in the future.7 Total profit & its expenditure(in thousand US dollars)Company name: SuperSonic Industries Group Corp.new enterprisescirculatingfundThis Graph reveals that our total profit of 2009 is US$200,000, which is US$50,000 higher than that of 2008. To expand business, our investment in establishing new enterprises was raised from US$80,000 in 2008 to US$140,000 in 2009. Andthe new circulating fund also increased from US$70,000 in 2008 to US$150,000 in 2009.Africa 5%USA 40%8 Describe the caricature and give your comment. 9Source of Income Percentage of Total Income Parents Part-time job Fellowship orScholarshipAmerican Students 50% 35% 15% Chinese Students 90% 5% 5%Income sources of Chinese students are quite different from those of American students. In China, students get 90% of their money from their parents while in America, only 50% of students’ money is provided by parents. In addition, Chinese students earn only 5% of their money from part time jobs and 5% from fellowship or scholarship while income from these two resources for American students takes up 35% and 15% respectively of their total income.I think there are probably three reasons for their differences. First, because of the influence of different social and family values, Chinese students have formed the habit of asking for money from their parents while American students have developed more sense of being financially independent. Second, most Chinese parents devote too much care to their children and they would rather save up to afford their children’s education rather than encourage them to take part-time jobs. But in America, many parents pay more attention to developing the students’ability of self-reliance, so they encourage their children to find part-time job to earn some money by themselves. Third, since America is more developed than China, it is relatively easy for students to find part time jobs. In China, such opportunities are rather rare.I believe with the development of China, more and more Chinese students will realize and pay more attention to the necessity of self dependence. In addition, more and more opportunities will be provided for them to take part-time jobs. So more students will go out of the ivory tower to broaden their knowledge and to become the master of their own lives.10 The table below gives information about changes in modes of travel in England between 1985 and 2000.Summarise the information by selecting and reporting the main features, and make comparisons where relevant.The table indicates the number of miles by the average English person in 1985 and 2000, using various means of transport.The number of miles walked, cycled and traveled by local bus all decreased. Of these, the number of miles traveled by local bus decreased the most, from 429 miles in 1985 to 274 miles in 2000.The number of miles traveled by car, long distance bus, train and taxi all increased. The number of miles driven by car was 3,199 in 1985 and rose by 50% to 4,806 in 2000.The number of miles traveled by long distance bus more than doubled from 54 miles (1985)to 124 miles (2000). The number of miles driven by taxi trebled from 13 miles (1985) to 42 miles (2000). The use of other, unspecified, forms of transport also increased.Overall, the number of miles traveled by the average English person rose from4,740miles in 1985 to 6,475 miles in 2000, with the increase of cars accounting for almostall of that increase.11A. staying at homeB. travelingC. doing social investigationD. other waysFrom the two charts, we can see that in the past ten years the students who go traveling and do social investigations during vacations have increased greatly while those who stay at home have decreased a lot.There are several reasons for the changes. Firstly, with the development of economy, many people have become better off. Students can get financial support from their parents for traveling. Secondly, tourism has greatly developed over the past ten years. Many new scenic spots have been built and exploited. In addition, the students today are expected and encouraged to participate in facing the real world. In this way they can obtain the necessary experiences required when they go job-hunting upon graduation.From the changes in the charts, we can predict that more and more college students will make their vacations interesting and worthwhile by going to the outside world instead of staying at home.1213 How Americans spend their money140 1020 30405060Acquire information Making StudyOthers2002 2003 2004 College Students ’ On-line Behaviorsv .. . ..15 The table below show social and economic indicators of fourcountries in 1994, according to United Nations statistics.Summarize the information by selecting and reporting the main features, and make comparisons where relevant.. . . 资料. .。
- 1、下载文档前请自行甄别文档内容的完整性,平台不提供额外的编辑、内容补充、找答案等附加服务。
- 2、"仅部分预览"的文档,不可在线预览部分如存在完整性等问题,可反馈申请退款(可完整预览的文档不适用该条件!)。
- 3、如文档侵犯您的权益,请联系客服反馈,我们会尽快为您处理(人工客服工作时间:9:00-18:30)。
全国高职高专实用英语口语大赛”选拔赛竞赛参考题Part IIPresentation(3 minutes)1 Number of Hours Worked Per WeekJAPANSWEDENNumbers of Day’s Annual HolidayJAPANSWEDENT he average Japanese worker spends 47 hours a week, or 2 100 hours per year, at the office or factory, while the average Swede clocks up only 37.Swedish workers have 28 days of holiday per year, but the Japanese have only 15. A typical Japanese worker takes a six -day week, however, a Swedish worker works less than 5 days a week. If you are a worker, life is much easier in Sweden than in Japan, for you can work 10 hours shorter each week and you may have a much longer annual holiday.2 Change in Number of Visitors by CountryIn 2009 there were a large number of visitors to China on group or independent tour. But there were changes in the numbers of vistors from different countries. Some increased but some decreased. The greatest change happened in Bangladesh. The number of visitors from Bangladesh was down ------there were 70% fewer group tour visitors and 48% independent travelers than the year before.Visitors from Argentina were up by53% for group tours and 26% for independent travelers. The number of visitors from Sweden was up by 24% for group tours and 15% for independent travelers.Group3 Sales of Computer Company50100150200250123456789101112At the beginning of the year sales of the computers were as 80 000 pounds. Sales rose steadily between February and April. However, they then fell slightly between April and July. Following a minor rise in August, sales declined noticeably from 160 000 pounds to 120 000 pounds. The downward trend continued, and in November sales reached their lowest point since January. Fortunately, thanks to a new marketing strategy and growing demands for holiday goods, sales increased dramatically at the end of the year and eventually reached 200 000 pounds. In all, it’s a year of both rise and fall and was finally ended up with great success in sales.Sales (Pound)×1000Month4 Time Spent on Different Media by Teenagers24681012141618s u r f o n -l i n ew a t c h T Vl i s t e n t o r a d i ou s e t e l e p h o n er e a d b o o k s &m a g a z i n e sThe chart shows a survey result about the hours the teenagers spend per week on the different media such as Internet, TV, radio, telephone and books or magazines in their spare time. Clearly, the teenagers like surfing the net very much and they usually spend 16.7 hours per week on -line. Next to this, they would prefer to watching TV, 13.6 hours per week being spent for that. Interestingly, in a week, they only spend about 6 hours reading books or magazines. And the amount of time they spend in listening to radio or using telephone is just in between.hours/week5 Foreign Trade Growth of China (in billion of RMB)5101520253035J a n.F e b .M a r .A p r .M a y .J u n .J u l y .A u g .S e p t .O c t .N o v .D e c .510152025303540As the graph shows, Chinese exports almost remained steady in January last year. In February, they went up rapidly. In the next three months, they fluctuated between 20 billion and 25 billion. From May to October, exports saw a slight decrease, then a small increase in November. In December, there was a significant increase. But after that, Chinese exports fell dramatically.Compared with exports, Chinese imports saw a continuous rise from the beginning of last year to May. In the next six months, they showed a gradual fluctuation. At the start of November, they began to pick up and from November to December, imports increased abruptly to reach a peak of 17 billion. At the beginning of this year, a sudden decline in exports led to steep fall in imports.6 Market Share of MEX Company ProductsAfrica 5%Europe 30%USA 40%Japan 15%This pie graph shows the breakdown of the market share of MEX Company products in the world. As you can see, the U.S.A. is still our largest customer. It has the largest percentage of the market share of our products, at 40%. The second is Europe, at 30%. Next is Japan, which makes up 15% of our market share. And Australia accounts for 10%. Finally, the smallest part of our market share is taken up by Africa, with only 5%. Recently the world economy is not booming very fast, so we should improve our management system and try our best to produce better products and explore potential market in the future.7 Total profit & its expenditure(in thousand US dollars)Company name: SuperSonic Industries Group Corp.new enterprises circulatingfundThis Graph reveals that our total profit of 2009 is US$200,000, which is US$50,000 higher than that of 2008. To expand business, our investment in establishing new enterprises was raised from US$80,000 in 2008 to US$140,000 in 2009. And the new circulating fund also increased from US$70,000 in 2008 to US$150,000 in 2009.8 Describe the caricature and give your comment.9Source of Income Percentage of Total IncomeParentsPart-time jobFellowship or Scholarship American Students 50% 35% 15% Chinese Students90%5%5%Income Sources Between Chinese Students and American StudentsIncome sources of Chinese students are quite different from those of American students. In China, students get 90% of their money from their parents while in America, only 50% of students’ money is provided by parents. In addition, Chinese students earn only 5% of their moneyfrom part time jobs and 5% from fellowship or scholarship while income from these two resources for American students takes up 35% and 15% respectively of their total income.I think there are probably three reasons for their differences. First, because of the influence of different social and family values, Chinese students have formed the habit of asking for money from their parents while American students have developed more sense of being financially independent. Second, most Chinese parents devote too much care to their children and they would rather save up to afford their children’s education rather than encourage them to take part -time jobs. But in America, many parents pay more attention to developing the students’ ability of self -reliance, so they encourage their children to find part -time job to earn some money by themselves. Third, since America is more developedthan China, it is relatively easy for students to find part time jobs. In China, such opportunities are rather rare.I believe with the development of China, more and more Chinese students will realize and pay more attention to the necessity of self dependence. In addition, more and more opportunities will be provided for them to take part-time jobs. So more students will go out of the ivory tower to broaden their knowledge and to become the master of their own lives.10 The table below gives information about changes in modes of travel in England between 1985 and 2000.Summarise the information by selecting and reporting the main features, and make comparisons where relevant.The table indicates the number of miles by the average English person in 1985 and 2000, using various means of transport.The number of miles walked, cycled and traveled by local bus all decreased. Of these, the number of miles traveled by local bus decreased the most, from 429 miles in 1985 to 274 miles in 2000.The number of miles traveled by car, long distance bus, train and taxi all increased.The number of miles driven by car was 3,199 in 1985 and rose by 50% to 4,806 in 2000. The number of miles traveled by long distance bus more than doubled from 54 miles(1985)to 124 miles (2000). The number of miles driven by taxi trebled from 13 miles (1985) to 42 miles (2000). The use of other, unspecified, forms of transport also increased.Overall, the number of miles traveled by the average English person rose from 4,740 miles in 1985 to 6,475 miles in 2000, with the increase of cars accounting for almostall of that increase.11A. staying at homeB. travelingC. doing social investigationD. other waysFrom the two charts, we can see that in the past ten years the students who go traveling and do social investigations during vacations have increased greatly while those who stay at home have decreased a lot.There are several reasons for the changes. Firstly, with the development of economy, many people have become better off. Students can get financial support from their parents for traveling. Secondly, tourism has greatly developed over the past ten years. Many new scenic spots have been built and exploited. In addition, the students today are expected and encouraged to participate in facing the real world. In this way they can obtain the necessary experiences required when they go job -hunting upon graduation.From the changes in the charts, we can predict that more and more college students will make their vacations interesting and worthwhile by going to the outside world instead of staying at home. 120 10 20 30 40 50 60 Acquireinformation Entertainment Makingfriends Study Others Percentage 2002 2003 2004College Students ’ On-line Behaviors13 How Americans spend their money1415 The table below show social and economic indicators of fourcountries in 1994, according to United Nations statistics.Summarize the information by selecting and reporting the main features, and make comparisons where relevant.。