基于gis的商业选址空间分析
运用GIS进行空间选址分析
测绘与空间地理信息收稿日期:2009-11-06作者简介:刘小林(1982-),男,湖南衡阳人,地图学与地理信息工程专业在读博士研究生,主要研究方向为G IS 的研究与开发。
刘小林1,温程杰2,张江水1(1.信息工程大学测绘学院,河南郑州450052;2.75719部队,湖北武汉430074)摘要:现代物流等应用空间选址的行业在国民经济生活中的重要性日渐凸现,G IS 以其强大的数据管理功能、查询分析功能和数据显示功能,在空间选址的应用中具有无法比拟的优势。
文章分析了利用G I S 进行空间选址的优点,阐述了G I S 对空间选址的支持作用,并且对空间选址的方法进行了具体分析。
关键词:G I S ;空间选址;空间分析中图分类号:P208 文献标识码:B 文章编号:1672-5867(2010)04-0019-03Analysis of Spatial Locati on Selecti on using GISL I U X i ao-li n 1,WEN C he ng-jie 2,Z H ANG Jia ng-shu i1(1.In stitute of Surveyi n g and M app i ng ,In for m ati on En gi neer i ng Un i versity ,Z hengzhou 450052,Ch i na ;2.75719Ar m y ,W uh an 430074,Ch i na)Abstrac t :M odern log isti cs and o t her fie l ds wh i ch use spatial l o ca tion selecti on are m ore and mo re i m portant i n na tiona l econom y and civ il life .G IS is i ncomparab l y advantaged i n t he appli cation of spatial locati on se l ec tion because o f i ts data managem ent f unc tion ,query and analysis f unc ti on ,and data d i sp lay functi on .T his paper ana lyzed t he advantages o f usi ng G IS ,and expounded i ts supporti ng f unc -ti ons i n spatial l o ca ti on se l ection .Then ,itm ade a concrete ana l ys i s of t he spatial l o ca ti on se l ection m ethods .K ey word s :G IS ;spatial l o ca tion se l ection ;spa ti a l ana l ysis0 引 言空间选址是指在一定地理区域内为一个或多个选址对象选定位置,使某一指标或综合指标达到最优的过程。
基于GIS的零售商业网点选址模型研究_陈姚
(%)赖利零售引力模型3!@A4。赖利以牛顿的万有 引力定律为核心, 提出: 一个城市从其周围某个城镇 吸引到的零售顾客数量与该城市的人口规模成正 : 比, 与两地间的距离平方成反比。有如公式 (% ) (!" # !$ )B C%" # %$ D E C&$ # &"D
!
(% )
式中, !" 和 !$ 分别为从一个中间城市被吸引到 " 城和 $ 城的贸易额; %" 和 %$ 分别为 " 城和 $ 城的 人 口 ; &" 和 &$ 分 别 为 " 城 和 $ 城 到 中 间 城 市 的 距离。该模型证实:城市人口越多,规模越大,它 从周围的城镇吸引到的顾客数量就越多;就距离而 言,一个城市从附近城镇吸引到的顾客数量比从较 远的城镇吸引到的顾客数量多。 (! ) 康弗斯断裂点模型。 康弗斯发展了赖利的理 论, 确定了城市交易区域, 即在 ’ 、 ( 城市间顾客可能 到达任何一个城市购物的分界点。公式如下:
*!,
’))") 2 ’).". 2 ,…,2 ’)!"! 1 %) (3 ) ’.)") 2 ’..". 2 ,…,2 ’.!"! 1 %. ! ! ! ! ’$)") 2 ’$.". 2 ,…,2 ’$!"! 1 %$ 当此方程组中 $(! 时,即街道个数多于居住类
’(.() 城市居住人口的三维遥感估算模型*)’/)0,
在城市建设与规划中,建筑容积率是城市发展 和规划的控制指标之一,建筑容积率包含了居住区 内不同住宅类型的三维结构特征总量,因此,由人 口、用地与建筑 ’ 者数量关系衍生的数学模型,反 映了人口的三维分布情况。 设某城市区域有 ! 种居住用地类型,每一住宅 ;又设该区 类型的人口密度为 "# (#1) , . ,…, ! ) 域被分为 $ 个行政街道,且已知每一街道的统计人 口总数为 %& (& 1) , .,…, $) ;通过遥感结合调查 获得的每个街道内的各种住宅用地面积为 ’#& (#1) , ,则可建立下列线性方 .,…, !; & 1), .,…, $) 程组*)’,:
GIS超市选址的实验报告
班级2010级4班专业地理信息系统学号2010203409姓名王盛安得分
一、实习内容和意义
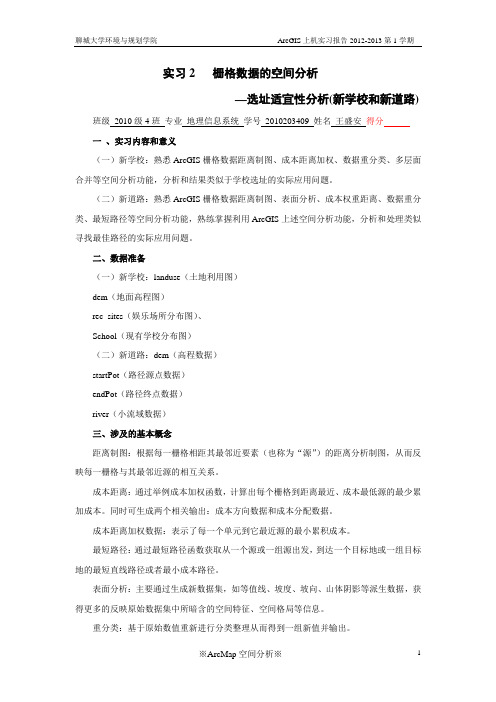
(一)新学校:熟悉ArcGIS栅格数据距离制图、成本距离加权、数据重分类、多层面合并等空间分析功能,分析和结果类似于学校选址的实际应用问题。
(二)新道路:熟悉ArcGIS栅格数据距离制图、表面分析、成本权重距离、数据重分类、最短路径等空间分析功能,熟练掌握利用ArcGIS上述空间分析功能,分析和处理类似寻找最佳路径的实际应用问题。
ArcToolbox中选中ArcToolbo右键选择【环境】,如图1所示,然后设置相关参数。
图1
展开【工作空间】,设置工作路径,如下图所示,
图2
展开【处理范围】,在范围下拉框中选择“与图层landuse相同”,如下图所示,
图3
展开【栅格分析】,在像元大小拉框中选择“与图层landuse相同”,如图所示,
图4
1、创建成本数据集
2.1坡度成本数据集
使用DEM数据层,选择【Spatial Analyst工具】|【表面分析】|【坡度】,生成坡度数据集,记为Slope。
图5
图6
使用Slope数据层,选择【Spatial Analyst工具】|【重分类】|【重分类】,选择【分类】命令实施重分类。重分类的基本原则是:采用等间距分为10级,坡度最小的一级赋值为1,最大一级赋值为10。
表面分析:主要通过生成新数据集,如等值线、坡度、坡向、山体阴影等派生数据,获得更多的反映原始数据集中所暗含的空间特征、空间格局等信息。
重分类:基于原始数值重新进行分类整理从而得到一组新值并输出。
四、技术流程图(以框图和文字的形式表现)
(一)新道路
(二)新学校
五、具体操作步骤
GIS在购物中心选址中的应用研究

2、技术方法与模型:目前GIS技术的应用主要依赖于已有的技术和模型,如 何结合人工智能、机器学习等先进技术进一步优化GIS的空间分析和决策支持功 能,是未来发展的重要方向。
3、跨界合作:空间选址往往涉及到多个领域和利益相关者,如何实现跨领 域的合作和协调,使GIS技术的应用更加全面和合理,也是值得的问题。
二、GIS技术在空间选址中的应 用场景
1、城市规划:在城市规划过程中,GIS技术可以帮助决策者进行城市空间布 局的分析和优化,例如利用GIS进行土地适宜性评价、资源配置和交通流量分析 等,为城市功能区划和用地规划提供科学依据。
2、环境评估:在环境评估领域,GIS技术可以用于研究自然环境与人类活动 对环境的影响,例如利用GIS进行大气污染扩散模拟、水资源保护区划分和生态 风险评估等,为环境保护和可持续发展提供技术支持。
二、研究方法
1、GIS技术的应用
地理信息系统(GIS)是一种集地理数据采集、存储、管理、分析和可视化 于一体的计算机系统。在物流配送中心选址过程中,GIS技术可以提供丰富的空 间和地理信息,帮助企业和研究者更好地了解备选的地理环境、交通状况、基础 设施等相关因素,进而进行合理决策。
2、多种选址模型的建立
1、进一步优化选址模型,提高模型预测的准确性和可靠性。
2、考虑更多的影响因素,如环境保护、社会责任等,以实现可持续发展的 目标。
3、结合先进的物联网、大数据等技术,实现更加智能化、自动化的选址决 策。
感谢观看
4、可视化与交互:可视化表达和交互是GIS技术的优势之一,如何提高可视 化与交互体验,使决策者能够更加直观地了解空间选址的情况并做出准确决策, 也是未来发展的重要方向。
参考内容二
一、引言
随着全球经济一体化和电子商务的快速发展,物流业作为连接供应链上下游 企业的重要桥梁,其地位日益凸显。而物流配送中心作为物流系统的核心环节, 直接影响着整个物流过程的效率与成本。因此,如何合理选择物流配送中心的成 为了一个重要的研究课题。近年来,地理信息系统(GIS)技术的不断发展为物 流配送中心选址提供了新的解决方案。本次演示旨在探讨基于GIS的物流配送中 心选址方法,以期为企业和研究者提供有益的参考。
基于GIS的商业选址决策支持系统

基于GIS的商业选址决策支持系统摘要:基于gis的商业选址决策支持系统是以综合数据库为核心,商业信息和地理数据有效结合,通过定性和定量数据分析,并嵌入各种有助于决策的功能模块。
其未来的发展趋势将使个人能够无障碍的运用并作出最优决策。
关键字:gis 商业选址功能模块商业选址并非一个新话题,大多数决策者并没意识到它的价值。
然而单一的商业选址服务是缺少吸引力的,必须和其他商业活动相结合,从而形成大量的地理信息数据,这对于客户来说却不是最终需要的。
由于客户的需求是持续的、千差万别和不断变化的,商业选址决策支持系统应当提供可选、可定制服务的咨询决策支持方案。
构建基于gis的商业选址决策支持系统,主要包括三个层次的内容,从而完成一个商业选址过程。
第一层次是关于信息的,收集、分析包括统计资料、专家经验、直觉感观等各方面信息,目前来说专家决策是最佳途径。
第二层次是关于技术的,即采取哪些技术解决手段,缩小技术差距。
对于gis技术来说,其主要功能包括可视化、定位、分析和规划等。
第三层次是关于决策的,这也是商业选址价值实现的地方。
一、系统建立的基本原则综合性。
据调查,世界上80%的商业信息与地理有关。
综合性体现在商业选址要求掌握尽可多的信息,包括自然、政治、经济、社会、文化、心理等各个方面的数据和信息,其中有些是可以定量的,有些是定性的,数据之间存在千丝万缕的联系。
动态性。
动态性是指商业选址是一个历史性问题,决策前要根据当时的情况和发展趋势来判断,一旦选定,该区位便进入其生命周期,因外部环境和内部特点的变化而变化直至最终改变状态。
局限性。
如同铁路选址一样,最终的方案既不是成本最低的,也不是最完美的路线,即由于我们掌握信息和分析能力的局限性,以及区位竞争、空间演变等不可控因素,商业选址决策只在一定条件下是科学合理的。
二、系统开发的主要步骤步骤一:在背景层中,收集足够多的信息,包括城市总体规划、土地利用规划、城市基础地理数据、城市人口、社会经济数据、市场研究调查数据、网点经营管理数据、产业政策、区域发展战略等,层层迭加形成商业选址的信息平台。
基于GIS的城市商业网点分布研究

近年来,计算机技术的飞速发展,推动了GIS技术的广泛应用。
与此同时,GIS 技术在商业中的普遍应用促进了现代商业发展。
基于GIS技术的城市商业网点分布的研究在理论和实际应用上都取得了极大的成果。
选址问题是一个经典问题,在商业经济中扮演着举足轻重的角色。
选址的好坏直接影响到服务方式、服务质量、服务效率、服务成本等,从而影响到利润和市场竞争力,甚至决定了企业的命运。
好的选址会给人民的生活带来便利,降低成本,扩大利润和市场份额,提高服务效率和竞争力。
在城市设施选址中,主要应用到了GIS空间分析技术,如叠加分析、缓冲区分析、网络分析等。
借助GIS技术进行可视化选址相对于传统选址而言更加科学、方便。
本文首先介绍有关选址方面的经典理论和国内外相关应用,接下来分析商业网点选址要注意的方方面面,最后应用ArcGIS模拟城市商业选址。
关键词 GIS;城市商业网点;选址;商圈Title Based on GIS to study the distribution of the urban commercial networkAbstract:In recent years, the rapid development of computer technology, promoted the wide application of GIS technology. Meanwhile, GIS technology commonly used in business promotes the modern commercial development. Based on GIS technology to study the distribution of the urban commercial network in theory and practical applications have great achievements. Location problem is a classic in commercial economy, a crucial role to play. The location of the direct influence on the service mode, service quality, service efficiency, service costs, etc, thus affecting profit and market competitiveness, and even decide the fate of the enterprise. Good location will give people's life more convenient, lower costs, and expand the profit and the market share, improve the service efficiency and competitiveness. In urban facility location, mainly applied to the GIS spatial analysistechniques, such as superposition analysis, buffer analysis, network analysis, etc. GIS technology compared to traditional visual location concerned more scientific and more convenient location. This paper firstly introduces the location of the classical theory and analysis of the domestic and foreign relevant application, the next commercial outlets all aspects of the site should pay attention to, finally simulated city commercial application ArcGIS location.Keywords:GIS;Urban commercial network;Site selection;Business circle目录摘要 (1)第一章引言 (4)1.1研究背景和研究意义 (4)1.1.1研究背景 (5)1.1.2研究意义 (6)1.2国内外研究现状 (6)1.2.1商业网点选址国外研究现状 (6)1.2.2商业网点选址国内研究现状 (6)第二章研究准备 (8)2.1.经典理论 (8)2.1.1雷利法则 (8)2.1.2赫夫法则 (9)2.1.3中心地理论 (10)2.2研究框架 (11)2.2.1研究方法 (11)2.2.2研究技术路线 (11)第三章基于GIS的超市选址 (12)3.1 GIS空间技术 (12)3.1.1 GIS空间分析方法 (12)3.1.2 GIS应用模型 (13)3.2超市商圈分析 (14)3.2.1商圈和商圈分析 (14)3.2.2超市选址因子分析 (16)第四章基于ArcGIS的大型超市选址示例分析 (17)4.1数据分析和处理 (17)4.2加权适宜性模型 (18)4.3超市市选址因子适宜度分级标准及其权重 (18)4.4口密度问题与V oronoi多边形 (19)4.5基于ArcGIS的大型超市加权适宜性选址模型的建立 (20)4.6小结 (24)结论 (25)致谢 (25)参考文献 (26)第一章.引言(或绪论)对于顾客而已,店址是其选择商店的首要选择。
基于GIS的规划方案空间分析

基于GIS的规划方案空间分析引言:随着城市化进程的加快和城市规模的不断扩大,城市规划成为了现代城市发展中不可或缺的重要环节。
而在城市规划中,空间分析是一项关键任务,它能够帮助规划师们更好地了解城市的地理特征和空间分布,从而制定出更合理、更科学的规划方案。
而基于地理信息系统(GIS)的规划方案空间分析,正是一种强大的工具和方法,本文将探讨其在城市规划中的应用。
一、GIS的基本概念和原理地理信息系统(GIS)是一种集地理数据采集、存储、管理、分析和展示于一体的综合性工具。
它通过对地理数据的数字化处理,将地理空间信息与属性信息相结合,实现对地理现象和问题的分析和解决。
GIS的基本原理包括数据采集、数据存储、数据管理和数据分析四个方面。
其中,数据采集是指通过各种技术手段获取地理数据的过程;数据存储是指将采集到的地理数据以数字化的方式存储在计算机中;数据管理是指对存储的地理数据进行组织、管理和维护;数据分析是指对地理数据进行处理、分析和模拟,从而得出相关的结论和决策。
二、GIS在规划中的应用1.地理数据的获取和处理GIS可以通过多种方式获取地理数据,包括航拍、卫星遥感、GPS定位等。
这些数据可以包括地形、地貌、土地利用、交通网络等多个方面的信息。
通过GIS的数据处理功能,可以对这些数据进行清洗、整理和加工,使其符合规划分析的需求。
2.空间分布分析GIS可以对地理数据进行空间分布分析,通过对城市地理要素的空间分布进行统计和分析,了解城市的空间结构和格局。
例如,可以通过GIS对人口分布、建筑密度、交通网络等进行分析,了解城市的人口流动、交通拥堵等问题,为规划方案的制定提供依据。
3.多因素综合评价在城市规划中,需要考虑多个因素的综合影响。
GIS可以将各种地理数据进行整合,通过空间叠加分析和权重分配,对不同因素的影响程度进行评估和分析。
例如,可以将人口密度、环境质量、基础设施等因素进行综合评价,为规划方案的选择提供科学依据。
基于gis的商场选址
P rocedia - Social and Behavioral Sciences 148 ( 2014 ) 227 – 235Available online at ScienceDirect1877-0428 © 2014 Elsevier Ltd. This is an open access article under the CC BY-NC-ND license(/licenses/by-nc-nd/3.0/).Selection and peer-review under responsibility of the 2nd International Conference on Strategic Innovative Marketing.doi: 10.1016/j.sbspro.2014.07.038 *Corresponding author. Tel.: +90 346 219 10 10 Ext: 24 38; Fax: + 90 346 219 11 65E-mail address: tarikturk@ICSIMThe Usage of Geographical Information Systems (GIS) in theMarketing Decision Making Process: A Case Study forDetermining Supermarket LocationsTarik Turk a , Olgun Kitapci b , I. Taylan Dortyol ba Department of Geomatics Engineering, Engineering Faculty, Cumhuriyet University, Sivas, 58140, Turkeyb Akdeniz University, The School of Applied Science, Antalya, 07192, TurkeyAbstractThe marketing decision support system is designed to help marketing managers in the analysis and decision making processes. The magnitude of a consumer market is measured by its economic, demographic and geographic dimensions. From this point of view, we focused on demographic and economic factors, which exist within macro environment factors in this study. The purpose of this paper is to point out the importance of consumption maps such as food, education, health expenses etc. which provide significant cues for investors and marketers especially in determining optimum locations. In this context, all data was integrated on Geographical Information Systems (GIS) environment. In addition, user interface programs were developed to perform easily several queries and analyses in ArcGI S 9.3 GI S Software. Afterwards, the data was queried, analyzed and documented by GIS. Finally, related consumption and optimum location maps for the marketing were produced. This study shows that GI S can play significant roles in both marketing planning and the decision making process. Consequently, new marketing strategies can be determined by means of recommendations resulted from this study in the city of Sivas and other cities.© 2014 The Authors. Published by Elsevier Ltd. Selection and/or peer-review under responsibility of The 2nd International Conference on Integrated Information. Keywords: Decision Making Process; Decision Support System; Geographical Information Systems; Marketing Strategy1. IntroductionThe information systems concept has been around for many years. The importance of information technology in marketing was presented with a marketing information systems model by P. Kotler. According to this model, there are four major sub-systems (Sääksjärvi, M. V.T. and Talvinen, J. M. 1993) an internal records system, a marketing research system, a marketing intelligence system and a marketing decision support system. The © 2014 Elsevier Ltd. This is an open access article under the CC BY-NC-ND license(/licenses/by-nc-nd/3.0/).Selection and peer-review under responsibility of the 2nd International Conference on Strategic Innovative Marketing.228T arik Turk et al. / P rocedia - Social and Behavioral Sciences 148 ( 2014 )227 – 235 internal records system provides information about internal factors such as sales, costs and cash flow. The research system is relevant to the marketing research process, which is realized by the company. With the marketing intelligence system, a company gathers daily data and information related to the external marketing environment, which can be counted as macro and microenvironment factors. All of this data and information is stored in a database. The marketing decision support system is designed to help marketing managers in the analysis and decision making processes. I n this system, statistical techniques and decision models are used together. With all of these four sub-systems, the company may be more effective and efficient in both the internal and external marketing environments tracking process and in addition the company may also utilize the information acquired through the marketing decision support system on marketing strategy development and marketing planning processes. This study is interested in GI S, which can be used as a tool in the Marketing Information System, especially in marketing intelligence and marketing decision support systems’ sub-systems to analyze data and information related to the external marketing environment. The magnitude of a consumer market is measured by its economic, demographic and geographic dimensions (Islamoglu, A. H. 2008). From this point of view, we focused on demographic and economic factors, which exist within macro environment factors in this study.Nowadays, especially in the marketing environment, the importance of information management is obvious.Being aware of the activities of competitors and customers is the main step to gain directive information. In this context, information systems are widely used tools to collect and to interpret data. One of these information systems is called GIS. At present, GIS is used in Marketing Information Systems as a tool for the decision making process. GIS’s present popularity is based on its powerful visual presentation capabilities and spatial relationship analysis. Xia has listed these advantages as follows (Xia, J. 2004):•GIS has the ability to perform spatial analysis,•GIS can categorize and place objects into individual themes and thus has the ability to treat these objects differently,•GIS has the ability to store data related to the visual presentation over the spatial database,•GIS can be implemented online, thus control of the system can be easy and remotely conducted,•The cost of the implementation of a GIS is considerably low.The utility of conventional management information systems, which are now evolving into decision support systems, can be improved by incorporating the analytical and visualization capabilities of geographic information systems. The aim is to enhance communication texts and tables by the visual presentation of data and information, thereby ensuring that accurate results are obtained quickly, which in turn leads to better and more informed decisions. I t is for this reason, among others, that the usage of geographic information systems in business is growing rapidly (Musyoka, S.M, S.M. Mutyauvyu, J.B.K., Kiema, F.N. karanja and D.N. Siriba 2007). Fig. 1 shows the general framework of processes executed on GIS.229 T arik Turk et al. / P rocedia - Social and Behavioral Sciences 148 ( 2014 )227 – 235Fig. 1. General framework of GIS [5]The user of the system may utilize GIS directly or indirectly with “The User Interface Programs” to join the system. A user interface program is a tool to allow for interaction between the user and computer. A logical and consistent user interface program must be designed to perform processes easily and efficiently in the software. Although many processes should be done for complex spatial analysis and queries in GI S software, these processes can be executed by means of pressing a button that is developed by user interface programs. Thus, GIS software can easily be used by everybody (Turk, T. 2009). In this study, the main concerns are to point out the importance of consumption maps in providing significant cues for marketers. This approach will help marketers make optimum marketing management decisions by utilizing GIS.2.The Methods Applied In the StudyThe research was conducted in two basic stages. The first stage consists of the data collection process. In this process, we used both primary and secondary data. The primary data was collected through questionnaires whilethe secondary data was obtained from the Census Bureau of Sivas. In the second stage, data was analyzed usingGI S and consumption and optimum location maps were produced. The survey questionnaire consisted of two parts. The first part included statements that pointed out demographics (income level, household population etc.). The second part covered statements regarding consumption levels related to specific consumption items such as education, health, clothing, etc. In this study, the “Optimum Location” query was processed for a supermarket investment. Thus, we have chosen expenses, which include food, cleanliness, personal care, smoking and alcohol. The primary data was collected from consumers who live in Sivas City, Turkey. The main reasons for selecting Sivas City is the easy access to the participants and to easily gather data. A quota sampling technique was used inthe data collection process. The main population researched consisted of 80,238 households (The Record of230T arik Turk et al. / P rocedia - Social and Behavioral Sciences 148 ( 2014 )227 – 235 Water Service Subscriber, Sivas City Hall, 2008). As it is understood, the main population researched consists of families. The reasons behind this choice are the following: (1) the income concept used to provide a basis for consumption is household income, and not individual income, (2) the basic attitudes and behaviors of an individual are improved in a family environment and (3) one of the biggest consumption entities for societies is family. In light of these factors, the basis for the establishment of this main population is the thought process of the efficient role of family members on product choice and consumption process. The questionnaire was tested with 20 academicians from Cumhuriyet University, in the pilot study area in Sivas. After the pilot test was conducted, certain minor wording changes were performed on the questionnaire. Following the pilot test process, questionnaires were presented to 1,186 households, of which 1,122 usable questionnaires were collected. Over all, the questionnaires were found to be useful, as determined by the 94.6 percent response rate. We performed face-to-face interviews in order to ensure a high response rate as well as to reduce the possibility of missing data in the questionnaires. Processes such as the query, analysis, documentation and producing of the thematic maps were performed by means of GIS software used.In this study, certain central concerns such as developing a marketing strategy, the marketing process of the products and analyzing customers’ behaviors were taken into consideration and a GI S relating to correct, fast, easy, efficient and effective decision making on these processes was proposed (Fig. 2). Furthermore, ESRI ArcGIS Desktop 9.3 which is one of the most popular GIS software were used (Fig. 3). Relevant user interface programs can be developed by this software.First, to develop and test the functionality of the proposed GIS, Sivas City was selected as the pilot study area.I n the database developing process, the districts of Sivas City were used for the geographical data while thepopulation, the average income and monthly consumption, related to education, health, food etc. were utilized for the tabular data. Then, the user interface programs were developed in order to apply spatial analysis, query and documentation faster, easier and more efficiently in the marketing strategy development process (Fig. 4).Fig. 2. The workflow chart for developing the marketing strategy by GIS231 T arik Turk et al. / P rocedia - Social and Behavioral Sciences 148 ( 2014 )227 – 235s 000 (2014–000()0) 000d B eh avi ora l S l S cie nce s0/ P roc edi a-Soc ial an d BTarik Turk, Olgun Kitapci, I. Taylan Dortyol/ Procedia - Social and Behavioral Sciences 00 (2014) 000–000Tar ik ik Tur k,Olg un un Kit t apc i,I.Tay lan Do rty ol/PFig. 3. General view of ArcGIS Desktop 9.3 Software with user interface programs developed.232T arik Turk et al. / P rocedia - Social and Behavioral Sciences 148 ( 2014 )227 – 235Fig. 4. Functions of the user interface programs developed on ArcGIS 9.3 Desktop software.3.Results and DiscussionsPerforming processes are listed the below by using the created system.With “Query the District” which is one of the developed user interface programs, it is possible to query the districts of the city with regard to their names. After the determination of the requested district from the list, that district is placed automatically on the map with the help of the user interface program and the consumption data for that district is then acquired (Fig. 4). At the same time, the following queries can also be realized in user interface programs:•With “The-Max-Income Districts” query, the district(s) which has/have the highest income level is/are automatically determined and shown on the map,•With “The-Min-Income Districts” query, the district(s) which has/have the lowest income level is/are automatically determined and shown on the map,•With the “Monthly-Average-Income” query, the average monthly income of districts is automatically calculated and displayed in a message box,•With the “Monthly-Total-Income” query, the total monthly income of a district(s) is automatically calculated and shown in a message box,•With “The Most Intensive Population” query, the district(s) which has/have the highest population is/are automatically determined and shown on the map,•With “The Least Intensive Population” query, the district(s) which has/have the lowest population is/are automatically determined and shown on the map,•With the “Zoom to Selected” query, the image of the requested district is enlarged and with the “Full Extend”query, all of the existing districts are shown on the map window,•With the “Export to Excel” query, the records of the queries, which were described above are automatically transferred to “Microsoft Excel” to be certified.•One of the other user interface programs is entitled “Query the Expense”. With this program, various queries and analysis can be performed in relation to the consumption types of the districts (Fig. 4).•With the “Find the Districts” query, a query is performed on the types of consumption and amounts, which were relayed by the user and the related district(s) is/are automatically determined and shown on the map.•In this user interface program, some queries are performed according to the selection of consumption types.These queries can be listed as follows:•With “The-Max-Expended Districts” query, the district(s) which has/have the highest consumption amount in relation to the requested consumption type is/are automatically determined and shown on the map and themaximum consumption level is then presented in a message box, •With “The-Min-Expended Districts” query, the district(s) which has/have the lowest amount of consumption in relation to the requested consumption type is/are automatically determined and shown on the map and whilethe minimum consumption amount is shown in a message box,•With the “Monthly-Average-Expended” query, the average monthly consumption amount of the requested consumption type is automatically calculated with the help of a user interface program and the determinedaverage consumption amount is then shown in a message box,•With the “Monthly-Total-Expended” query, the total monthly consumption amount of a specific requested consumption type is automatically calculated with the help of a user interface program and the determinedaverage consumption amount is then presented in a message box,•With the “Export to Excel” query, the records of the queries, which were described above are automatically transferred to “Microsoft Excel” to be certified.233 T arik Turk et al. / P rocedia - Social and Behavioral Sciences 148 ( 2014 )227 – 235The user interface program called “The Optimum Location” is developed to determine the optimum geographical location of marketing organizations, such as shopping centers, supermarkets and clothing stores (Fig. 4). To determine an optimum geographical location; population, average income and the level of monthly average consumption (in relation to food, hygiene, clothes, personal care, alcohol, smoking etc.) in the districts are all considered. The program automatically calculates the means of the related consumption types in all of the districts primarily and then point outs the specific district(s) that has/have the highest average level of consumption taking into consideration the population and the district(s) which is/are shown on the map, while the number of related districts is displayed in a message box. In this user interface program, the “Determining the Optimum Location” query is performed after the selection of investment type (Shopping center, supermarket etc.) and relays the circumstances related with population. In this manner, the related district(s) is/are automatically determined and shown on the map and the number of related districts is then displayed in a message box. As in the other user interface programs, with the “Export to Excel” query, the records of the previous queries, which are described above, are automatically transferred to “Microsoft Excel” to be documented.4.ConclusionsThe follow results can be presented by the created system.•The district that has the highest average income is Ulanak, while the district with the lowest income is Seyrantepe. The average monthly income in the Ulanak and Seyrantepe districts varies from 1,750 TL(Turkish Liras) and 583 TL respectively.•The average monthly income level in Sivas City (60 districts) is 1,179 TL.•The district that has the highest population is Yenişehir, while the district with the lowest population is Uzuntepe.•The district that has the highest food consumption level is İnönü with average spending at 251 TL per month.The Mısmılırmak district has the lowest food consumption level, at 91 TL spent on food on average in amonth.•The average monthly food consumption level of Sivas City (60 districts) is at 183 TL.According to observations, the results gained with the GIS paralleled that of personal observations.This study provided significant information regarding Sivas City with the help of user interface programs, which were developed to realize certain given operations such as spatial analysis, queries and documentation full-automatically. All of these processes are structured on the basis of Kotler’s marketing information system model. The final two sub-systems (the marketing research system and the marketing decision support system) of this system were thoroughly handled in this study. The ability to receive accurate and useful information may help a company process their marketing decision system more efficiently and effectively. Thus, a company can both easily and quickly make further objective decisions without prejudice. In this sense, it is determined that GIS may play a significant role on the optimum decision making process.Fig. 5a displays the optimum locations for a supermarket investment amongst the various districts of Sivas city. As a result of the query and analysis that were realized to point out the optimum location of a new supermarket, the İnönü, Kadı Burhanettin, Kaleardı, Kümbet, Ulanak and Çiçekli districts were determined as being the most advisable territories. From the map below (Fig. 5a), a supermarket investor will be obviously ableto determine the territory where the investment should be made. Accordingly, the Kadı Burhanettin, Kaleardı,Kümbet, Ulanak and Çiçekli districts compose the optimum supermarket location in Sivas. As can be seen from the map above, the distribution of the districts is not scattered. This may in turn be interpreted as a positive signalfor the reliability of the system.234T arik Turk et al. / P rocedia - Social and Behavioral Sciences 148 ( 2014 )227 – 235 This developed study will be a reference for both further studies and applications on other territories. Thus, it may help all marketers who will use the GI S software, to make certain decisions regarding planning their marketing strategy.Maps are visual communications tools. Location-based concepts, data and information can be evidently and efficiently presented with maps. For this purpose, monthly consumption distribution maps were created on education, health and food expenses (Fig. 5b, 5c, 5d) as examples. With the help of these maps, evidence can be gained to understand which districts have school, stationary, hospital, pharmacy, mall and supermarket needs.Fig. 5. The Selected Districts in the Optimum Location for a Supermarket and Expense-distribution-maps produced by the created system.ReferencesIslamoglu, A. H. (2008). Pazarlama Yonetimi, Beta Publisher, Istanbul.Mitchell, V. W. (1991). “Local authorities’ use of geographical ınformation systems”, Logistics Information Management, Vol.4, No.4, pp.12-18.Musyoka, S.M, S.M. Mutyauvyu, J.B.K., Kiema, F.N. karanja and D.N. Siriba (2007). “Marketing segmentation using geographic information systems (GIS): A case study of the soft drink industry in Kenya”, Marketing Intelligence and Planning, 25, 6, 632-642.Sääksjärvi, M. V.T. and Talvinen, J. M. (1993). “I ntegration and effectiveness of marketing information systems”, European Jounal of Marketing, 27, 1, 64-79.Talvinen, J. M. (1995). “Information systems in marketing”, European Journal of Marketing, 29, 1, 8-26.Tombarge, J. (1999). “Using management software for geographic information systems (GI S)”, The Bottom Line: Managing Library Finances, 12, 4, 146-149.Tonks D. G. and Farr, M. (1995). “Market segments for higher education using geodemographics”, Marketing I ntelligence & Planning, Vol.13, No.4, pp.24-33.235 T arik Turk et al. / P rocedia - Social and Behavioral Sciences 148 ( 2014 )227 – 235Turk, T. (2009). Creating a Sustainable Disaster Information System and its Application on the North Anatolian Fault Zone (NAFZ). PhD.Degree Thesis, Yildiz Technical University, Istanbul.Xia, J. (2004). “Library sapce management: A GIS proposal”, Library Hi Tech, 22, 4, 375-382.。
- 1、下载文档前请自行甄别文档内容的完整性,平台不提供额外的编辑、内容补充、找答案等附加服务。
- 2、"仅部分预览"的文档,不可在线预览部分如存在完整性等问题,可反馈申请退款(可完整预览的文档不适用该条件!)。
- 3、如文档侵犯您的权益,请联系客服反馈,我们会尽快为您处理(人工客服工作时间:9:00-18:30)。
基于gis的商业选址分析——以天河区麦当劳的分布为例基于gis的商业选址分析——以天河区麦当劳的分布为例【摘要】GIS技术具有强大的空间分析和可视化功能,能使商业选址更具直观性和科学性。
因此,通过对gis的应用,能为商业网点选址提供了新的思路和方法,弥补了传统研究方法的不足,为商业企业的科学决策提供了科学、形象和直观的数据和信息。
因此,通过对gis技术的运用,能使商业点分布在最优区位,减低生产成本,增加经济效益。
关键字:gis技术、麦当劳、商业选址、科学决策一:选题背景(1)gis在商业选址中的作用:商业网点的选址与布局是企业经营管理战略决策中的重要内容之一。
地址一旦选定将会在很大程度上影响企业未来的规划与发展。
由于传统分析与研究方法的局限性,促使现代商业的发展迫切地需要新技术的支持以适应现代商业经营方式。
而GIS技术具有强大的空间分析和可视化功能,能使商业选址更具直观性和科学性。
因此,通过对gis的应用,能为商业网点选址提供了新的思路和方法,弥补了传统研究方法的不足,为商业企业的科学决策提供了科学、形象和直观的数据和信息。
因此,通过对gis技术的运用,能使商业点分布在最优区位,减低生产成本,增加经济效益。
(2)麦当劳在的发展状况: McDonald's Plaza麦当劳餐厅(McDonald's Corporation)是大型的连锁快餐集团,于1954年在美国成立,在短短的半个多世纪里,已分布在全球119 个国家,约拥有三万间分店。
根据最近麦当劳公司一项调查统计,全世界一共有150 万人在麦当劳工作,每天迎接的顾客就达4800 万名。
1990 年,麦当劳在深圳开设了中国第一家餐厅,经过短短二十一年,目前有约670 家麦当劳餐厅分布于25 个省市和直辖市,员工人数超过5 万1992年,麦当劳在广州的第一家餐厅开张时创造了麦当劳历史上的最高销售额记录。
目前,据有关数据统计,麦当劳在广州10区(未包括两市)共有79家分店,其中仅在天河区就有33间。
麦当劳的成功,除了品牌优势外,更有赖于其在商业网点选址方面的敏锐眼光。
所以,对麦当劳商业选址策略的探讨,具有重大的意义。
通过运用gis技术,我们可以更直观更便捷更全面的分析麦当劳的空间分布状况,增长有关商业选址方面的知识,丰富知识层次,日后为我所用。
二、基于GIS的零售商业网点选址的特点GIS在商业网点选址中可将人口、客流、交通、市场竞争等与地理位置密切相关的商业数据,通过图形、图表等方式将相关商业数据的统计分析结果输出给用户,以满足商业企业选址决策人员对空间信息的要求。
与传统的选址方法相比,基于GIS的选址分析具有以下四方面的特点:一是可整合RS、GPS信息,在地图上直观、实时地反映待选址网点周围的人口分布、设施布局以及交通道路情况等选址要素的信息,从而更有助于决策者进行科学的分析和决策;二是利用GIS方法调查数据,用户可以通过对不同地图图层的控制,对需要的信息进行分层、叠加等操作,还可以自由设置这些要素显示的风格和样式,有利于选址决策的科学化;三是能够直接进行空间分析,根据需要进行多种类型的商圈分析,给出商圈内的客户分布模式。
能够根据需要按照道路、行政区以及指定的空间区域统计分析网点的数量和市场饱和情况,并为网点的建立和撤销提供信息;四是通过专题地图的分析,用户能够快速发现可利用的市场空间。
在确定预选位置后,系统还可进行模拟分析和评估预测,确定优选方案,并以定性和定量的方式将结果反馈给用户,极大地提高了用户的决策效率。
三:选址步骤。
(1)收集相关信息。
商业网点选址需要考虑很多因素,如自然环境因素、社会环境因素等,其中相对较为重要且操作性强的因素是交通状况、人口以及市场竞争。
①交通便利性因素优良店址的一个必备条件就是进出畅通。
交通便利性包括商业网点与公路、城市道路、铁路、航空等各种运输通道网的衔接情况以及与道路站、火车站等各种枢纽口岸的配套以及城市交通管制的协调状况等。
城市交通的便利性尤其体现在该地是否具有较密集、发达的公交汽车路线。
各公交路线的停靠点能否均匀、全面地覆盖整个市区,直接关系到大多数消费者购物的便利程度。
一般而言,城市中某一地区的交通便利性越强,其聚集效应也越明显,即该地区人流、车流、物流也越集中。
所以,我们收集了天河区的交通图,并在gis中给以纠正(确定所找地图的坐标系统由Google Earth 可得广州市天河区的坐标约为北纬23度06分32秒,东经113度15分53秒,故采用“北京1954-114E坐标系统”)(天河交通图)(地图纠正)②人口因素商业网点的分布与人口规模分布形态密切相关,一定规模或密度的人口是商业网点布局的必要条件。
人口因素主要包括站点的客流聚散量、站点所在地区的人口密度、人口构成、收入水平等。
所在区的第二、三产业越发达,人口密度越大,收入水平越高,其地面商业网点越密集。
流动人口在一定上影响着零售商业布局,随着流动人口的增加,消费和购物量相应扩大。
在人流密集的地段,如客运车站、码头和各种娱乐场所,出入人口很多,也是零售商业网,特别是流动售货车和摊位较密集的地方。
所以,我们收集了天河区行政图:③.市场竞争因素当零售商打算在某区域建立商业网点时,该区域内现有的市场竞争状况会直接影响到将来可能的销售业绩,市场竞争状况是选址的重要因素之一。
本文选用市场饱和度作为市场竞争状况的指标。
衡量城市或区域的零售饱和度,涉及供给和需求两个方面。
从供给角度分析,直接的方法是核算区域内的某类商店总数,但不同的商店规模存在差异,考虑到零售业最基本的生产资料是店铺,核算区域内的某类商店营业面积总量,则较为精确。
从需求角度出发,决定商店需求的是商店销售收入,包括零售额和批发额。
所以,我们收集了天河区麦当劳的分布图并且在地图上对每个麦当劳点的分布,都给以了其名称,地址,电话的编辑。
(2)在gis软件中进行地理信息的数字化。
①建立点图层和线图层。
建立相关图层是进行gis空间分析的第一步。
我们把天河区麦当劳分店地图在gis技术中建立的点图层和用天河交通图建立线图层叠加(叠加分析是指在同一参考系下对两组或两组以上的要素进行叠加,以产生新的要素的方法),得出天河区麦当劳在交通图上的分布图。
②通过缓冲分析,了解商业网点的服务范围。
所谓缓冲区是指是指在点、线、面实体周围自动建立一定宽度的带状区域,以便为相应的决策提供依据。
缓冲区分析常用来分析地理对象的影响范围或服务范围,如河流的灌溉范围、电力线路的供电范围。
在商业选址中,常用来分析商业网点的服务范围。
缓冲分析的第一步要确定缓冲半径。
商业网点的缓冲半径的大小就涉及到商区规模的大小。
所以,缓冲半径的确定一定要客观科学。
我们在确定天河区麦当劳的缓冲半径时,采用了实地考察的办法。
我们小组成员大概估算了我们学校到华忆百货、天娱广场、天河公园的麦当劳店的距离和华忆百货那的麦当劳店到岗顶那的麦当劳点的距离,都是一千米左右。
另外,我们也咨询了老师,老师建议也是一千米的距离。
通过缓冲分析,我们得到每间麦当劳的客户服务范围。
(这是其中一间麦当劳的服务范围)③把缓冲分析得到的图层与天河区行政交通图、交通干线图、麦当劳分布图叠加,得到天河区每所麦当劳店的客户空间分布情况:通过分析,我们可以得到一下结论:①天河区麦当劳分布合理,31个店中仅有几个客服范围有所重叠,但重叠程度相当小,几乎是擦肩而过,故几乎不存在客户抢夺现象天河区麦当劳店都是沿交通干线分布或分布在交通线相交处或大型商场里或在住宅区里,这些地方人的共同特点就是人流量大,这就保证了客户数量。
四、基于gis技术综合分析麦当劳选址策略。
首先,麦当劳会先进行市场查询拜访和资料信息的收集。
包罗人数、经济水平、消费能力、成长规模和潜力、收历水平、以及前期研究商圈的品级和成长机缘及成漫空间,此外,还有涉及承载这些信息的地图。
其次,在gis软件中,用缓冲分析,空间分析,最佳路径分析等技术对分歧商圈中的物业进行评估。
包括人流测试、顾客能力对比、可见度和便利性的考量等,以获得最佳的位置和合理选择。
在体味市场价钱、面积划分、工程物业配套前说起权属性质等方面的根本长进行营业额预估和财政分析,最终确定该位置是否有能力开设一家麦当劳餐厅。
最后,用gis技术预测此投资是否可以盈利。
投资是一个既有风险、又能够带来较高回报的抉择计划,所以还要更多地关注市场定位和价钱水平,既考虑投资回报的水平,也注重中持久的不变收进,这样才能较好地节制风险,达到投资收益的目标。
五、总结:GIS能够提供集成从简单到复杂的分析模型的平台,特别是在空间基础数据、人口普查数据和城市社会经济发展数据等的支持下,能够实现方便快捷的分析和可视化,为商业选址的合理话提供了重要依据。
另外,GIS具有将各种数据综合集成的能力(图1),无论是描述网点位置的空间数据,还是描述网点特征的属性数据,也不论这种数据是图片格式、表格格式、还是文本格式,都可集成在GIS技术体系下,实现各种各样的商业网点的查询、统计分析和制图表示等目标。
由于gis技术的强大功能,在我国的北京、上海、深圳已开始着手运用GIS技术从事商业网点的管理和选址等方面的的准备工作。
随着城市社会经济的发展和城市规模的扩张,并且由于城市扩张中土地利用的变化,居民点、社区空间格局的重新组合,必然引起商业服务需求的动态变化,这就需要调整和重新设置服务于区域的商业中心的空间布局。
为了满足商业网点规划布局及调整格局的目标gis技术提供了一系列的区位选址模型,这些区位选址模型能够在各种条件约束下,为新建的大型网点选着最优的空间区位,并能够对大型网点和商业中心空间布局的合理性做出评价和优化。
区位选址模型是运筹学领域研究的重要问题。
近年来。
随着计算机技术的发展,模型计算的复杂性的提高,使得基于gis的商业服务范围的贴切模拟得以实现。
而且,这些模拟技术在商业管理、公共设施服务、物流等众多领域得到了广泛的应用,为商业网点的科学选址提供更多依据。
六、结束语。
通过运用gis技术对天河区麦当劳空间区位分布的分析,探讨麦当劳的商业选址策略,真正做到把课堂中学到的知识应用到实际生活中,解决实际问题,实现学有所有,学为所用。
从中,我认识到商业选址的复杂性,gis技术的先进性,拓展了知识视野,丰富知识层面,更重要的是此次实验点燃起我继续学习gis技术的热情,坚定学习gis 技术的决心。
Gis技术虽然技术含量很高,学起来很困难,但其具有的强大功能和对人类社会做贡献的巨大潜力,值得我们大学生“上下求索”。
参考文献[1].张友静.地理信息科学导论[M].北京:国防工业出版社,2009:90-93[2].黎夏刘凯.GIS与空间分析——原理与方法[M].北京:科学出版社,2006:123-135[3].许五弟.地理信息系统构建与应用[M].北京:中国建材出版社,2005:160-177。