Basic statistics
Basic statistics a survival guide
Tom Sensky
HOW TO USE THIS POWERPOINT PRESENTATION
•
The presentation covers the basic statistics you need to have some understanding of. After the introductory slides, you’ll find two slides listing topics. When you view the presentation in ‘Slide show’ mode, clicking on any topic in these lists gets you to slides covering that topic. Clicking on the symbol (in the top right corner of each slide – still in ‘slide show’ mode) gets you back to the list of topics.
• Geoffrey Norman and David Steiner. PDQ1
Statistics. 3rd Edition. BC Decker, 2003
• David Bowers, Allan House, David Owens. • Douglas Altman et al. Statistics with
Thus formulae have been kept to a minimum – they are included where they help to explain the statistical test, and (very occasionally) for convenience. You may have to go through parts of the presentation several times in order to understand some of the points
statistica 全套教程包括数据挖掘

BASIC STATISTICS AND TABLES ............................................ 错误!未定义书签。
Basic Statistics and Tables--Descriptive Statistics......................... 错误!未定义书签。
Basic Statistics and Tables--Correlation Matrices............................. 错误!未定义书签。
Basic Statistics and Tables--t-Test, Independent, by Groups......... 错误!未定义书签。
Basic Statistics and Tables--t-Test for Independent Samples, by Variables . 错误!未定义书签。
Basic Statistics and Tables--t-Test, Dependent samples................... 错误!未定义书签。
Basic Statistics and Tables--t-Test, Single Sample........................... 错误!未定义书签。
Basic Statistics and Tables--Frequency Tables..................................... 错误!未定义书签。
Basic Statistics and Tables--Breakdown and One-Way ANOVA............... 错误!未定义书签。
Basic Statistics and Tables--Crosstabulation Tables......................... 错误!未定义书签。
07 - Longitudinal Studies 横向分析

Primary objective: Characterize the change in the response
0 and followed for the next 25 hours
Measurements: Blood samples at 10 time points assayed
for theophylline concentration
Response: Blood concentration (mg/L) of theophylline
approximately a straight line
The rate of increase (slope) in
the distance over age of the boys seems to be larger than that of the girls
10 | Basic Statistics in Clinical Trials | Longitudinal Studies | All Rights Reserved
Introduction
Example 1 – Dental study (Potthoff and Roy, 1964)
Observational study to investigate dental growth in 27
children (16 boys, 11 girls)
basic方法
basic方法Basic方法是计算机科学中的一种基础算法,它在解决问题时提供了一种简单而有效的解决方案。
本文将介绍Basic方法的基本原理、应用场景以及它的优势和局限性。
让我们来了解一下Basic方法的基本原理。
Basic方法是一种基于逐步逼近的算法,它通过将复杂的问题分解为一系列简单的子问题,并逐步解决这些子问题来求解整个问题。
这种算法的核心思想是将大问题分解为小问题,通过解决小问题来解决整个问题。
在每一步中,Basic方法会根据当前问题的特点和要求,选择合适的策略和方法来解决子问题,然后将这些子问题的解组合起来得到整个问题的解。
Basic方法在很多领域都有广泛的应用。
例如,在图像处理领域,Basic方法可以用来实现图像的降噪、增强和特征提取等操作。
在机器学习领域,Basic方法可以用来训练模型和进行预测。
在网络安全领域,Basic方法可以用来检测和防御各种网络攻击。
在优化问题中,Basic方法可以用来求解最优解。
总之,Basic方法在计算机科学的各个领域都有着重要的应用。
尽管Basic方法在许多问题上表现出色,但它也有一些局限性。
首先,Basic方法通常需要较长的计算时间,特别是在处理大规模问题时。
其次,Basic方法对问题的求解结果依赖于问题的分解方式和策略的选择,不同的分解方式和策略可能得到不同的结果。
此外,Basic方法对问题的描述和输入要求比较高,需要清晰准确的问题描述和合理有效的输入。
最后,Basic方法在某些复杂问题上可能不适用,需要使用其他更高级的方法来解决。
尽管Basic方法有一些局限性,但它的优势也是显而易见的。
首先,Basic方法简单易懂,容易实现和调试,即使是初学者也可以快速上手。
其次,Basic方法的分解思想和逐步逼近策略使得它可以解决各种类型的问题,具有很强的通用性。
此外,Basic方法可以通过调整和优化分解方式和策略来提高求解效率和结果的准确性。
因此,Basic方法在解决一些中小规模的问题时是非常有效的。
主成分分析zst
主成分分析
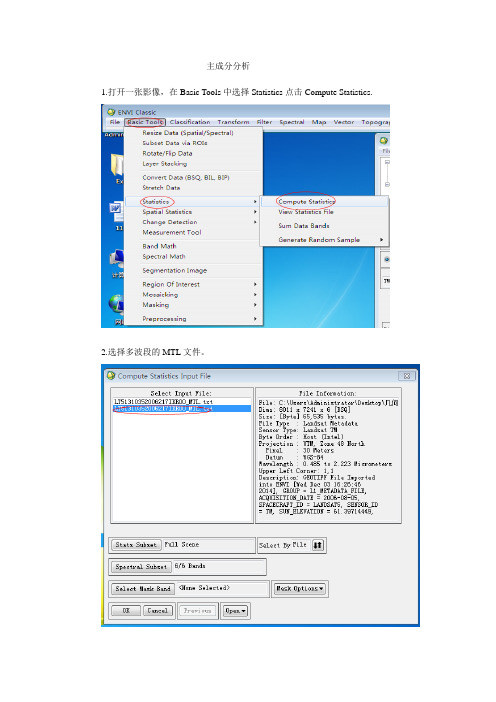
1.打开一张影像,在Basic Tools中选择Statistics点击Compute Statistics.
2.选择多波段的MTL文件。
3.勾选Basic Stats ,Histograms,Covariance.点击OK。
得到结果如图
4.进行主成分分析。
Transform 选择Principal Components,Forward PC Rotation,再选择Compute New Statistics and Rotate,再次选择多波段,进行如图操作
5.选择文件,保存路径。
6.点击OK,得到结果如图。
7.点击Basic Tools ,选择Statistics,View Statistics File.
8.打开之前保存的STA格式的文件。
如图
9. Transform 选择Principal Components,Inverse PC Rotation
10.选择先前多波段的文件。
并找到先前保存的文件,打开,修改保存路径,点击ok
10. 点击Basic Tools ,选择Layer Stacking
11.按如图操作,依次选1,2,3波段,并加保存路径。
点击OK
12.得到结果如图
13.将两幅影像进行对比。
35_Minitab培训课程
------Basic Statistics 模块
此模块有如下功能:
模块功能
UseMinitab's basicstatistics capabilitiesforcalculatingbasic statisticsandforsimpleestimation and hypothesis testing with one or two samples. The basicstatisticscapabilitiesincludeproceduresfor:
选择 显示描述性统计
填完自变量和因变量后,点击Graphs按钮
点击OK后,显示出 箱线图 和统计数据
解释
每个箱线图最低点表示当天最小值,最高点表示最大 大值,箱子高,低点分别表示3/4,1/4数字大小,箱中间 一横表示当天几个数据的中位数
在Session窗口中具体显示MEAN平均值,StDev标 准差,Median中位数等信息.
differenceinproportions Hypothesis testforequalityofvariance Measuring association Testingfornormality ofa distribution
打开一个软件自带的例子学习
打开Quality文件
数据如下
第三块数据是最小最大等第四来自数据是平均值,方差的 95%置信区间等
区间估计与假设检验
例假设一个物体的重量未知,为了估计其重量,用一个 个天平称5次,得到重量5.525.485.645.515.45,假设结 结果符合标准差0.1的正态分布,求均值是否是5.5 和重量置信水平为95%的置信区间
输入数据后,按图所示
统计学(中英文)_ch01

Business Statistics, A First Course (4e) © 2006 Prentice-Hall, Inc.
Chap 1-12
∑X
n
i
Business Statistics, A First Course (4e) © 2006 Prentice-Hall, Inc.
Chap 1-8
Inferential Statistics 推断统计
Estimation 估计 e.g., Estimate the population mean weight using the sample mean weight 例如:利用采样的平均重量估计人口的平均体 重 Hypothesis testing 假设检验 e.g., Test the claim that the population mean weight is 120 pounds 例如:根据测试的要求,人口平均体重是120 磅
英文翻译乃自己所做, 英文翻译乃自己所做,有错误 之处请自行查证。 之处请自行查证。
Business Statistics, A First Course (4e) © 2006 Prentice-Hall, Inc.
Chap 1-1
Business Statistics, A First Course
Defined descriptive vs. inferential statistics 描述性统计和推理统计 Reviewed data types 回顾数据类型
♦ ♦ ♦ ♦
Categorical vs. Numerical data 绝对的和数值的数据 Discrete vs. Continuous data 离散的和连续的数据
statistics的用法总结大全
statistics的用法总结大全想了解statistics的用法吗?今天就给大家带来了statistics的用法,希望能够帮助到大家,下面就和大家分享,来欣赏一下吧。
statistics的用法总结大全statistics的意思n. 统计,统计学,统计法,统计资料,统计数字,“statistic”的复数statistics用法statistics可以用作名词statistics作“统计资料,统计数字”解用作主语时,谓语动词常用复数形式。
作“统计学”解用作主语时,谓语动词用单数形式。
statistics用作名词的用法例句He is a professor of statistics.他教授统计学。
There is a compulsory course in statistics.有一门统计学的必修课。
Get me a printout of the statistics.给我一份打印出的统计资料。
statistics用法例句1、The degree provides a thorough grounding in both mathematics and statistics.该学位课程将为数学和统计学打下扎实的基础。
2、A close look at the statistics reveals a troubling picture.仔细看过统计数据后,会发现情况令人担忧。
3、Their governments have no reason to "massage" the statistics.他们的政府没有理由“窜改”这些数据。
correlational statistics的中文翻译及用法phr. 相关,关联;相互关系英语解释· a statistical relation between two or more variables such that systematic changes in the value of one variable are accompanied by systematic changes in the other相似短语· correlational statistics phr. 相关,关联;相互关系· correlational analysis phr. 因素相关性分析· correlational grammar 关联语法· correlational hierarchy 相关的等级体系· administrative statistics 行政统计资料· employment statistics 就业统计,就业统计· decentralized statistics 分散统计· field statistics 现场统计· genetic statistics 遗传统计· inventory statistics 库存统计,库存统计表相似单词· correlational adj. 相关的· Statistics n. 统计,统计数字· statistics n. 1.一项统计数据2.统计资料,统计数字3.统计学· health statistics 【医】卫生统计statistics的用法总结大全。
- 1、下载文档前请自行甄别文档内容的完整性,平台不提供额外的编辑、内容补充、找答案等附加服务。
- 2、"仅部分预览"的文档,不可在线预览部分如存在完整性等问题,可反馈申请退款(可完整预览的文档不适用该条件!)。
- 3、如文档侵犯您的权益,请联系客服反馈,我们会尽快为您处理(人工客服工作时间:9:00-18:30)。
Attention
range 3. the width of the class interval = ————————— the number of classes As usual, it is 5, 10, 15 and so on. 组距=全距/组数
4. The frequency distribution must include all the data given. Therefore, the frequency distribution should start: at a value equal to or lower than the lowest number of the ungrouped data end: at a value equal to or higher than the highest number.
3. Determine the width of the class interval
Attention
58, 65, 84, 70, 90, 75, 86, 76, 80, 82, 83, 84, 69, 84, 85, 86, 72, 89, 75, 92
1. The range of the raw data: defined as the difference between the largest and smallest 92-58=34 numbers. too many: cannot achieve generalization 2. The number of classes too few: cannot see the important differences the appropriate number of classes between 5 and 10
Then ,how do we do ? descriptive statistics
inferential statistics
You use descriptive statistics to get to know which strategies are more frequently used by these 400 students .The results you have got are on sample. You may use inferential statistics to examine the relation bewteen the use of strategies and English achievement,or to see whether the male students differ from the female students in their use of stategies based on the notion probability
Class Interval
Frequency
50—under 60 60—under 70 70—under 80 80—under 90 90—under 100 Total
Class Interval 50—under 65 65—under 80 80—under 95
1 2 5 10 2 20
Table 1: Frequency distribution
If the total possible values are various, such as people's age and students' test scores, we need to group the raw data into classes.
Parameter
Parameter is a descriptive measure of the population ,which is denoted by Greek letters such as Page 180.
e.g :
population mean
population variance population standard deviation
Basic statistics
郜战莹 外国语言学及应用语 言学 硕士研究生
Content
A brief description of statistics
Description statistics
Inferential statistics
1.A brief description of statistics
complicated than descriptive,aims at predictions beyond the sample data.
Descriptive Statistics
frequencies
central tendency
variabiபைடு நூலகம்ity
Frequencies
The simplest way to organize the data is to describe their frequency distribution which can reduce and summarize data effectively and efficiently.
Conclusion Descriptive analysis or statistics describes
the general pattern or tendency emerging from the data collected .
Inferential analysis or statistics, more
Generally speaking, we may construct the frequency distribution of these data in three steps:
1. Determine the range of the raw data
2. Determine the number of the classes
In this case, the frequency distribution is concerned with classes rather than with each individual score. How do we describe the frequency distribution in terms of classes? There are no hard-and-fast rules to follow.
Statistic
Statistic is a descriptive measure of a sample , which is denoted by a Roman letter , such as the examples in page 180 e.g. sample mean
sample variance sample standarization deviation
An example:
Suppose you are an English teacher at Nanjing University and you want to know the relationship between the use of strategies and the English proficiency of all the Nanjing University students.There are more than 10,000 students on two campuses.Obviously,you cannnot afford the money and time to take a census. What you may do is to survey 400 students as a sample by a questionnaire.
1.1 Definitions
1.2 Two important terms
1.1
Definitions
descriptive statistics
inferential statistics
1.1.1 Descriptive statistics
If a reseacher is interested only in describing a group from which the data are gathered ,the statistics involved is called descriptive statistics.
c
Note:
In many cases data in the field of applied linguistics are priamrily descriptive in nature.
1.1.2 Inferential statistics
If his or her interest goes beyond describing the group from which the data are collected and s/he tries to draw conclusions about the population from which the group was selected ,the statistics needed in this case in inferential statistics.
Note:
Its advantage is to allow the reseacher to make decisions about the population without studying the entire population.
1.2
Two terms
parameter