2018年中考英语《图表作文》写作指导
英文图表作文写作指导
英文图表作文写作指导1. As is shown by the graph/in the table .... (概述图表)正如曲线所示,最近54 年来该国人口飞速增长。
As is shown by the graph,there has been a rapid increase in the population ofthe country in the past five years.2. It can be seen from the table that … (得出结论)shown graphconcluded figuresestimated statisticsA. 从表中所给的统计数字可以看出,从1985 年到1 990年中国的人均收入迅速提高。
From the statistics given in the table it can be seen that the average personal income of the Chinese people increased (grew 、rose) rapidly from 1985 to 1990.B. 从曲线图可以得出结论,最近5 年来中国人口的出生率已经大大下降。
It can be concluded from the graph that there has been a great decline in birthrates in China in the past five years.3. … amount to … (数量总计)add up tocome tosum up to全部费用合计200 美元。
All the expenses (costs) amount to (= add up to) $ 200.4. … increase from … to … (数量增减)decreaserisefalldropA. 这个工厂生产的彩电已由1986 年的5000 台增加到1 990年的21000 台。
2018年中考英语作文写作指导大全
2018年中考英语作文写作指导大全为您整理“2018年中考英语作文写作指导大全”,欢迎阅读参考,更多精彩内容请继续关注本网站相关栏目发布的信息。
2018年中考英语作文写作指导大全一、写作步骤1. 细心审题审题是英文写作的关键,如果审题不清,那么你会死的很惨。
学生真正开始写作前,必须花相当一部分时间做写前阅读、思考等准备,包含以下四方面:1)审体裁。
根据情景提示首先要弄清写什么体裁文章。
2)审结构。
明确开始部分、正文部分和结尾部分,定好段落。
3)审格式。
如日记、便条、书信、通知的格式等。
4)审内容。
弄清什么必需写,哪些略写,尤其是图画式书面表达,要学会连贯性,读懂图的意思。
5)审人称和时态。
弄清书面表达要求用何种人称,根据材料确定短文的基本时态。
2.列提纲列提纲能帮你构思内容,理清思路,能收到事半功倍的效果。
首先要理解题目和主题句。
根据主题思想来确定几个观点来论述主题,然后构思全段内容。
3.完整句子根据题目要求以及提示在提纲中组织句子。
4.连接把组织好的句子用恰当的连接词串联起来。
5.检查再次检查有无单词拼写,名词单复数,时态,动词形式,主谓一致,大小写,标点,人称,冠词等是否使用正确。
6.抄到答题卷上确认无误,认真抄写在答题卷上 (以上步骤需要反复训练,若时间紧张可以直接在答题纸上直接写作文,节省时间。
)二、写作要求1:词汇精准、多样特别注意名词单复数的运用,动词时态,主谓一致,人称一致的正确运用;单词拼写正确;副词的运用。
在句子的某些位置,添加副词,可以使句子和文段更有人性味,更有情感性。
如:I really enjoy the beauty of the sea in the sun. 加了一个really,就有丰富了。
2:句式丰富一篇文章,通常能较好体现学生对英语语言结构、词块、句式的运用。
因此各类句式的精彩呈现往往可以提升书面表达的成绩。
初中阶段英语写作常用的句式如下:There be…; the more…the more…; It’s adj for sbto do something; I think/believe/suppose…(宾从);尤其是复合句的适恰运用对提升文章的层次很有帮助。
2018考研英语2图表作文范文

2018考研英语2图表作文范文全文共3篇示例,供读者参考篇1The following is an example of a 2018 postgraduate entrance examination English chart essay:The two bar charts provided illustrate the changes in the percentage of internet users in China across different age groups in 2010 and 2015. As can be seen from the charts, the percentage of internet users in every age group increased significantly from 2010 to 2015.In 2010, the age group with the highest percentage of internet users was 18-24, accounting for approximately 40%, while the age group with the lowest percentage was 55-64, with only around 10% of users. Over the five-year period, there was a noticeable increase in internet usage across all age groups. The most substantial increase was seen in the 55-64 age group, with the percentage of users more than doubling to nearly 25% by 2015. This could be attributed to the growing popularity and accessibility of the internet, as well as increased digital literacy among older generations.In contrast, the 25-34 age group remained the largest proportion of internet users in both years, with a slight increase from 2010 (around 35%) to 2015 (approximately 45%). The 18-24 age group also experienced a significant rise in internet usage, reaching over 50% by 2015. It is noteworthy that the 65 and above age group showed a remarkable increase in internet usage, almost tripling from 2010 to 2015.Overall, the data from the bar charts indicate a positive trend in internet usage across all age groups in China. The findings reflect the impact of technological advancements and changing societal norms on internet adoption, suggesting a more interconnected and digitally savvy population.篇2The following is a sample essay on a topic related to the 2018 postgraduate entrance examination English Part 2 chart:---Climate Change: A Global ChallengeClimate change is one of the most pressing issues facing our world today. The consequences of global warming, such as rising sea levels, extreme weather events, and loss of biodiversity, are already being felt around the world. In this essay, we will take acloser look at the data presented in the chart below, which shows the global temperature fluctuations over the past century, and discuss the implications of these findings.The chart demonstrates the steady increase in global temperatures over the past century, with a particularly sharp rise in the last few decades. This trend is attributed to the release of greenhouse gases, such as carbon dioxide and methane, into the atmosphere as a result of human activities like burning fossil fuels and deforestation. These gases trap heat from the sun, causing the Earth's temperature to rise.The consequences of this warming trend are far-reaching and severe. Rising temperatures are causing glaciers to melt, leading to rising sea levels that threaten coastal communities and island nations. Extreme weather events, such as hurricanes, droughts, and wildfires, are becoming more frequent and severe, putting lives and livelihoods at risk. The loss of biodiversity is another major concern, as many species are unable to adapt quickly enough to the changing climate.In response to these challenges, countries around the world have taken action to mitigate and adapt to climate change. The Paris Agreement, adopted in 2015, aims to limit global warming to well below 2 degrees Celsius above pre-industrial levels, andto pursue efforts to limit the temperature increase to 1.5 degrees Celsius. This agreement has been signed by nearly 200 countries, signaling a global commitment to addressing the issue of climate change.Individual actions also play a crucial role in combating climate change. By reducing our carbon footprint through actions like using public transportation, conserving energy, and supporting renewable energy sources, we can all contribute to reducing greenhouse gas emissions and slowing the pace of global warming.In conclusion, climate change is a global challenge that requires urgent action from individuals, governments, and businesses alike. By working together to reduce our impact on the environment and promote sustainable practices, we can create a healthier, more resilient planet for future generations.---This essay provides an analysis of the data presented in the chart and discusses the implications of climate change as a global challenge. It emphasizes the importance of taking action to address this pressing issue and highlights the role that individuals, governments, and businesses can play in mitigating the impacts of climate change.篇32018考研英语2图表作文范文The table above depicts the statistics of the employment rate in different industries in 2017 and 2018. From the table, we can see that the employment rates in the manufacturing industry, the service industry, and the technology industry have all increased in 2018 compared to 2017.In 2017, the employment rate in the manufacturing industry was 35%, while in 2018, it increased to 40%. This indicates that more people are finding jobs in the manufacturing sector. Similarly, the service industry saw an increase from 45% in 2017 to 50% in 2018. The technology industry also experienced a growth in employment rate from 20% in 2017 to 25% in 2018.The increase in employment rates in these industries can be attributed to several factors. Firstly, the government has been implementing policies to support the development of these industries, which has created more job opportunities. Secondly, there has been a rise in demand for goods and services in these sectors, leading to increased employment to meet the demand. Lastly, advancements in technology have also led to the creation of new jobs in the technology industry.Overall, the increase in employment rates in the manufacturing, service, and technology industries indicates a positive trend in the job market. It is important for the government and the private sector to continue to support the development of these industries to ensure sustained growth in employment opportunities.。
英语图表作文写作方法
英语图表作文写作方法一、图表作文写作模式图表作文是一种以图表的形式出现,提示的信息隐含在图表之中。
考生必须先仔细研读图表,使图表中的数据、曲线、图形等成为与短文标题相关并能为我所用的有意义的信息。
读图时务必要把握表层信息和深层含义这两方面的内容,主要考的是考生对图表深层次信息(原因、根源、可能导致的后果等)的挖掘和阐述。
1. 图表的类型1)泛指一份数据图表:a data graph/chart/diagram/illustration/table2)饼图:pie chart3)直方图或柱形图:bar chart / histogram4)趋势曲线图:line chart / curve diagram5)表格图:table6)流程图或过程图:flow chart / sequence diagram7)程序图:processing/procedures diagram8)统计表格:table2. 图表作文的一般要求性A.通常采用下列统一的标准提纲:1) 现状——图表揭示的表面变化2) 原因分析/导致问题——引起变化的深层次社会根源/该变化带来的种种问题3) 启示/建议——从图表所体现的变化趋势中得到的启示/提出个人建议B.解析图表步骤:在图表作文审题的时候,关键是拿起笔来圈定上面的重要信息、重要规律、重要数据、重要分配,描述图表并不意味着要把整个图表的一切信息包含在你的文章中,要传达的信息一定是最重要的信息。
C. 图表解析段落的内容结构:1)开头,可用笼统的一句话来交代,根据图表所示某个方面在某个时间段内发生了某种变化。
2)中间,可用两到三句话具体分析图表中显示的变化,描述单方面趋势(分支观点),数据分析(论证)。
抓住主要的显著的变化进行描述,相近的类别归为一类进行描述。
独特的类别要交代,以免漏掉重要信息;不是每个数据都要写,重要数据一定要提到;不要在所有数据间来回对照对比;3)结论,可用一句话简单再概括图表体现的变化趋势;不要涉及个人看法。
初中英语图表类作文的写作方法点拨
英语篇图表作文即要求考生根据所提供的图片或表格展开写作,常以说明和议论为主,侧重对观察、理解、分析、比较、信息转换以及语言运用等综合能力的考查。
对此,笔者就初中英语图表作文的写作步骤和常见词汇、句型进行了分析,以期对同学们有所帮助。
【写作步骤】1.审清题意。
任何书面表达都离不开审题,只有审清题意,才能避免跑题。
所以,同学们在看到题目后,不要急于下笔,首先要弄清文章要求写的是什么,是写一封信、写一篇报道,还是写一篇议论文等。
其次,要明确文章所要使用的人称和时态,否则全文皆错。
2.观察图表。
这是写图表作文至关重要的一环。
在观察图表时,同学们既要看清图表中的文字说明、备注解释等;又要注意仔细剖析图表提供的数据信息,找出信息之间的区别和变化,从而抓住问题的本质。
3.罗列提纲。
简单概述图表中的信息内容,把图表中需要表达的要点全部勾选出来,提炼出写作要点,并在此基础上罗列好写作提纲,构建写作框架。
这样写作时才不会杂乱无章,层次不清。
4.连句成文。
选择自己熟悉的词汇、短语、句型,将写作要点译成句子,然后连句成文。
在连句成文时,要注意使用转承连接用语,以增强文章的连贯性,确保行文流畅自然。
【常用词汇和句型】1.常用词汇(1)表示数据变化:on the increase (日益增长),a growing/increasing number of (越来越多的),go up (增长),decrease to (减少了)等。
(2)描述事物:important (重要的),benefi-cial (有益的),meaningful (有意义的),similar (类似的),colorful (丰富多彩的)等。
(3)表达个人观点:in my view/opinion (在我看来),As far as I am concerned (就我而言),From my point of view (依我之见)等。
2.常用句型From the diagram,we can see that …从图表中我们可以看到……According to the graph,we can find …根据图表,我们可以发现……It is clear from the figure that …从图中可以清楚地看到……As is shown in the graph …如图所示,……As can be seen from the chart/table/form,…从图表中可以看出,……【实践演练】假定你是学校英语报小记者李华,上周学校开展了“English Day ”活动,请你根据下面的海报和学生参加活动的数据,以“Our School English Day ”为题,写一篇不少于80词的报道,介绍活动情况以及同学们的感受。
英语考试作文-2018英语专四作文:图表与命题作文三段式写法
英语考试作文
2018英语专四作文:图表与命题作文三段式
写法
2018英语专四作文:图表与命题作文三段式写法
(一)图表作文
开头段解读图表信息,抓住图表中的“极端”信息;中间段分析图表反映的主旨或原因;结尾段提出建议或预测未来趋势等。
(二)图画作文
开头段描述画面内容,提炼图画的含义;中间段对图画反映的现象予以评论;结尾段提出倡议或解决方法等。
(三)文字/提纲命题作文
开头段描述现象或阐述自己的看法;中间段分析产生现象的原因或者分点论述自己的观点;结尾段作总结,可提出建议。
图表作文写作攻略及必背模板句型
图表作文写作攻略及必背模板句型1.写作攻略图表作文是英语写作中较为常见的题型之一,也是难度较大的一种写作题型。
写作考试时,这类作文一般也以三段式写作方法来组织文章,第一段总结归纳信息反映的整体情况,点出主题思想,第二段回答第一段所得出的问题,对数字、数据等做出有条理的分析比较,第三段做出总结或给以简单的评论。
表格和图表题型写作要点:(1)图表作文一般采用的时态为一般现在时,但如果图表中给出了具体时间参照,考生则应对时态进行相应的调整。
(2)图表作文有一些固定句型和表达法,考生应对此融会贯通。
(3)图表作文可以细分为表格,曲线图、柱形图和饼形图。
除了上述共同要点,考生还应了解这四种图在写作方面的不同特点。
⏹表格(table)可以表示多种事物的相互关系,所以考生要对表格中所给出的大量数字进行比较分析,从中找出其变化规律。
⏹曲线图(diagram)常表示事物的变化趋势,考生应认真观察坐标系所显示的数据信息,并且密切注意交汇在坐标横轴和纵轴上的数字及单位。
⏹柱形图(bar chart)用来表示各种事物的变化情况及相互关系,要求考生通过宽度相等的柱形的高度或长度差别来判断事物的动态发展趋势,因此考生应密切关注坐标线上的刻度单位及图表旁边的提示说明与文字。
考生应清楚掌握部分与整体,部分与部分之间的相互关系,这种关系通常是以百分比的数字形式给出的。
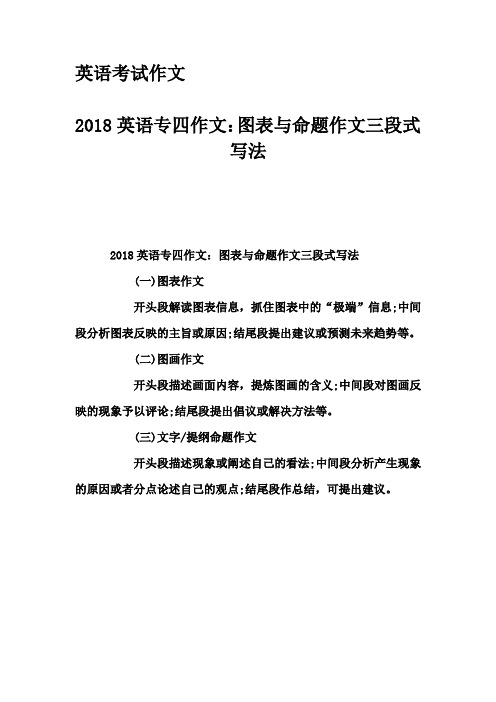
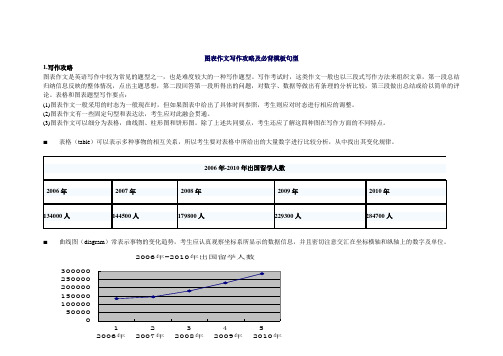
2006-2010年出国留学总人数:687600人从表格/图表中我们可以看到……The table shows a three times increase over that of last year. 表格显示比去年上升了3倍。
According to /As is shown in the table / diagram/chart...如表格/图表中显示……The number is 5 times as much as that of...此数字是……的5倍。
中考英语图表作文写作指导
中考英语图表作文写作指导作者:黄继飞来源:《试题与研究·中考英语》2016年第03期图表作文是借助于图画或表格提示,通过联想将一定的信息转换成传神达意的文字形式,反映出图表中所表现的思想内容的一种写作文体。
图表作文着重考查学生的观察能力、分析能力、想象能力、创造能力和语言表达能力。
要写好此类作文,仔细审题、弄清题目要求和图表中的内容是关键。
一、看图作文(一)写作要求看图作文就是要求学生根据题目给出的一幅或几幅图画所提供的图像信息写一篇短文。
此类作文的体裁较广泛,可以是记叙文、说明文,也可是议论文。
写看图作文要注意以下几个方面:1. 看图作文通常有一定的文字提示,这就要求我们在动笔前一定要通读提示,明确写作要求,不能丢掉命题所提供的任何信息,如时间、地点、人物、事件发生的先后顺序等。
2. 图画是作文的基础,要仔细观察、分析每一幅图画,弄清画面所反映的事件或蕴含的某种哲理。
3. 找出图中事物之间的内在联系。
如果有多幅图画,就要分析它们之间的内在联系及画中人物、事物之间的逻辑关系。
4. 设法从有限的画面空间拓展视野,充分发挥想象。
要根据画面情景、人物表情、环境等大胆联想,使文字描绘栩栩如生,令人读后有身临其境之感。
5. 反复阅读所给的关键词。
关键词是命题人根据画面的内容、范围定下的基调,应仔细阅读这些关键词,并以此为线索从中悟出其中要阐述的中心思想。
(二)技巧点拨看图作文的基本写作步骤:1. 列出要点。
明确写作的具体内容,仔细寻找全部要点,做到要点无遗漏。
2. 依据内容要点,选择可供自己使用的熟悉词汇、短语和句型。
做到“不求难,不求异,只求准”。
3. 将要点译成基本句子。
尽量用熟悉、简单的结构表达,避免因用大量的长句和复合句而造成的语法错误。
忌用汉语思维生造句子。
4. 按一定的时间、空间及逻辑顺序或情节发展对基本句子进行有序的排列组合。
5. 适当增加细节,运用恰当的过渡词将句子连接成文。
6. 细心检查错漏:检查主谓是否一致;检查时态和语态是否正确;检查语句和用词是否恰当;检查拼写和标点是否准确;检查内容要点是否齐全。
- 1、下载文档前请自行甄别文档内容的完整性,平台不提供额外的编辑、内容补充、找答案等附加服务。
- 2、"仅部分预览"的文档,不可在线预览部分如存在完整性等问题,可反馈申请退款(可完整预览的文档不适用该条件!)。
- 3、如文档侵犯您的权益,请联系客服反馈,我们会尽快为您处理(人工客服工作时间:9:00-18:30)。
中考英语《图表作文》写作指导中考中的图表作文一般有以下两类。
一、看图作文【命题形式】看图作文一般要求学生根据所给出的一幅图或几幅图所提供的信息写一篇短文。
在命题形式上,除了图的提示外,一般有英文单词提示或中文文字提示。
有的文章开头已给出。
要求书写的词数一般在80至100之间。
【写作技巧】1.审题要清。
看清题目要求,读懂画面内容和所陈述的含义,抓住要点,注意文体是什么,如果是故事或日记,宜用过去时态;如果介绍物品之类的,多采用现在时态。
2.逐图列提纲。
看图作文所提供的材料是一幅或几幅图。
做题时,可逐图列好提纲,并运用所提供的词语。
根据图示情景并结合自己的英语水平,尽量扬长避短,避繁化简。
遇到一时想不起来的词、句时,可用同义词或同义句代替。
3.连句成文。
就是把第二步所写的句子,在规定的范围内稍加发挥,适当用上连词把它们串联起来整理成一篇短文。
连句成文时应注意文中动词时态的应用,简单句和复合句的交替应用。
4.复核检查。
按要求逐图写好句子后,认真通读写好的句子,一查所写句子是否准确表达出了所给图画的情景,行文是否流畅;二查有没有遗漏要求,句子的时态、语态是否正确,所写句子是否符合英语的基本语序,即:主语+谓语+宾语十状语(地点、时间等);三查单词的拼写、大小写是否规范,标点符号的运用是否正确,主谓语是否一致。
确定无误后,再誊写正稿。
【经典试题】(2017年湖州卷)英语课上,老师组织大家就以下两幅图进行“To change or not"的话题讨论。
请用英语阐述你对此话题的看法。
注意:(1)短文可结合图片信息或自身经历,作适当发挥;(2)文中不得出现真实的姓名和校名;(3)词数:80~100,短文首句仅供选择使用,不计入总词数。
短文首句:Last week, we had a discussion about the topic "To change or not".【审题指导】1.因为短文首句已给出,所以我们可以接着引出下文。
如:I think different people have different choices to deal with problems.2.接着举例说明同一个问题,有的人选择“改变”,有的人选择“不改变”。
3.结合自己的某个经历,来谈谈自己的选择以及此选择对自己产生的影响或作用。
4.最后做出总结,我们遇到问题时要勇敢面对,采取行动来选择对自己的发展有利的一面,这样会对自己产生很大的影响。
需要注意的是:全文要以第一人称来写,列举或介绍自己的经历时要用一般过去时。
总结时要用一般现在时或一般将来时。
有些情况下可以使用适当的情态动词。
【写作指导】要点提示素材串联引出主题different people have different choices to deal withproblems开头举例说明(比如减肥)Some people decided to take exercises to lose weight;others think they can't do anything about it自己遇到口语不好的情况had difficulty with my spoken English 自己的选择chose to change如何改变目前的状况tried my best to listen to tapes and practice speaking every day正文取得的成果pronunciation has been improved a lot结尾:总结自己的感受,抒发情感facing problems, we should take actions to changeit will make a great difference【参考范文】Last week, we had a discussion about the topic "To change or not". I think different people have different choices to deal with problems. For example, when meeting with the weight problem, some people decided to take exercises to lose weight while others think they can't do anything about it.When I was in Grade 7, I had difficulty with my spoken English. Instead of giving up, I chose to change. I tried my best to listen to tapes and practice speaking every day. Now mypronunciation has been improved a lot.In a word, facing problems, we should take actions to change. Surely it will make a great difference.二、表格作文【命题形式】表格作文就是要学生将表格中所包含的信息用英语表达成意思连贯的文字。
在命题形式上,除了表格的提示外,一般有英文单词提示或中文文字提示。
有的文章开头已给出。
要求书写的词数一般在80至100之间。
【写作技巧】1.认真阅读表格中的文字说明,做到“四确定”。
首先,确定文章的体裁;其次,确定文章的结构;再次,确定文章的时态。
动词是句子的核心,时态是句子的灵魂。
时态错误是阅卷老师最易发现的,也是体现考生语言运用能力高低的显著标志;最后,确定文章的人称。
通常介绍型短文一般使用第二、三人称皆可。
2.阅读表格后的要求,做到“五注意”。
(1)词数80~100左右:意味着行文不能多于100个单词,也不能少于80个单词,否则要扣分。
同时词数决定着文章的详略和进行适当发挥的多少。
(2)开头和结尾已给:即考生首先不能另行开头或结尾;其次要细读所给语句的人称、时态、语言表达风格与口吻,力求前后一致。
(3)书写工整,卷面整洁:在新评分标准中有明确规定,“书写较差,以致影响交际,将分数降低一个档次”。
可见卷面要达到美观,除了要做到书写清楚、大小写、标点符号正确及移行规范外,还要注意采用适当的行距、句距及词距。
(4)内容完整:即要点要齐全,对于表格型写作,要注意从表格前的文字说明中找出隐藏的要点—文章的开头语与结尾语。
对于表格中的内容注意表达要详略得当和准确全面。
(5)参考词汇:一定要尽可能地应用到短文中。
使用时,一定要注意提示词汇的词性,确保其在句中以正确形式出现,避免不必要的扣分。
3.阅读表格中的英语或汉语提示,确保“两避免”和“两适度”。
首先在浏览过程中应先确定正文部分的写作顺序,然后根据汉语提示内容的关系,进行适当的整合,确保“两避免”和“两适度”。
两避免:是指避免同一个词、同一个句子结构的频繁使用;避免按汉语提示直译或硬译,而应尽量做到一词多译、一词多表,灵活变通。
所以在写好五个基本句式,力求语言表达正确的基础上,应注意句式的变换,确保语言表达的多样性。
两适度:指的是围绕内容主题进行1~2句的适当发挥,充实内容要点。
常见的技巧有:简单句与复合句的交错使用;主动语态中穿插使用被动语态;适当调整句子中定语、状语的位置,使句子表达多样性。
总之,表格型写作要坚持“慢审快写”的原则,必须牢记:先读提示,弄清体裁与结构,时态、人称要注意,开头、结尾要呼应;再读表格,句子结构要搭配,语言习惯莫违背;文章写好要检查,点滴注意别忽视。
【经典试题】(2017年义乌卷)某英语教育网站正在开展主题为“How can a teenager have a successful life?”的讨论,为此你采访了一些同学(结果见下表)。
请据此用英语写一篇短文参加讨论,并阐休你的观点。
注意:(1)短文必须包括表中所有内容,可适当增加细节;(2)你的观点至少两条;(3)词数80-100;(4)短文首句仅供选择使用,不计入总词数。
参考词汇:尊重respect 短文首句:I have recently done a survey about how a teenager can have a successful life. How can a teenager have a successful life?【审题指导】 1.因为短文首句已给出,根据表格内容,我们可以先介绍同学的主要观点,接着再介绍自己的观点。
2.介绍同学的主要观点时要用第三人称复数形式,介绍自己的观点时要用第一人称。
时态要用一般现在时,适当情况下可以用情态动词。
【写作指导】要点提示素材串联开头引出主题 a survey about how a teenager can have asuccessful life努力学习necessary to study hard; plays an important role 尊重父母respect their parents 正文同学主要观点服务社会serve the society; meaningful计划未来make a good plan for future结尾:发表自己的观点make some good friends; be active and exercisemore【参考范文】How can a teenager have a successful life?I have recently done a survey about how a teenager can have a successful life.Most students think it's necessary to study hard. After all, study plays an important role in their life. They also agree they should respect their parents, who take good care of them every day. Besides, they are ready to serve the society and it's meaningful to teenagers. What' s more, they share the idea that teenagers are supposed to make a good plan for future.In my opinion, we need to make some good friends so that we can learn from each other. Also, we must be active and exercise more because keeping healthy is helpful to a successful life.。