【复旦大学 投资学】Section3 Returns equity mutual funds
复旦

2013复旦大学431考研真题【回忆版】名词解释:1.汇率超调2.Sharpe指数3.在险价值(Value at risk)4.实物期权5.资本结构均衡分析选择:1.马克维茨组合的假设中哪个正确2.以下几个中收益率最高A半年复利率10% B年复利率10% C年连续复利率10% D忘了3.完美市场,如果再仅仅考虑税收,高股利政策是有益有害?如果仅仅考虑信息不对称,高股利政策有益有害?4.无税MM,甲乙公司财务杠杆不一样,其他都一样。
甲负债权益50%:50%,乙40%:60%,投资者有8%甲股票,什么情况下继续持有甲股票A:甲公司价值大于一公司B:无套利均衡C:忘了D:忘了5.通胀、逆差,用什么政策计算:1.股票收益率和a指数计算2.给出各种成本,折旧方法,计算NPV,财务盈亏平衡点简答:1:金融市场功能2:为什么NPV法最可靠论述:1.07年美国金融危机是否与有效市场假设直接相关2.汇率对国际收支影响,什么情况会使一些国家统一货币,根据国金理论分析欧元危机(25分)第一题选择B是年复利8% D是年复利10%马克维茨的那个看了书应该是选“投资者都是风险规避者”第二题我选了A.半年利率高股利那个题,考虑税收有害,考虑不对称有益第四题选了无套利均衡2013年复旦大学431金融学综合大部分试题回忆一、名词解释夏普指数实物期权风险作用资本结构权衡理论二选择题三计算题1运用CAPM求两只股票的期望收益率,然后求出超常收益率,并分析X,Y两只股票,方差X 大于方差Y,收益率X大于Y,各自符合下面哪两个方案:a:一支股票与风险被充分分散了的组合b:单独持有一只股票2求净现值和盈亏平衡点,题目含折旧(直线折旧法求)四解答题1简述金融系统的功能和作用这道题我用一些金融工具来答了,比如期货,还有利率,感觉没怎么答好2为什么净现值法是最不容易犯错的资本预算法?我把资本预算法中所有的方法都列出来了,并分析了个方法容易犯的错误五论述题1有人说美国2007金融危机的原因是因为基于“有效市场”的治理原则,请对此观点作出评价,并谈谈你的看法。
复旦大学经济学院2013~2014学年第二学期期末考试试卷

复旦大学经济学院2013~2014学年第二学期期末考试试卷A卷答案(共4页)课程名称:投资学原理课程代码: ECON130031.01开课院系:经济学院考试形式:闭卷姓名:学号:专业:一、选择题(单选或多选:4’*5=20’)1、B2、A C3、B D4、ABD5、CDF二、名词(4’*5=20’)1、股权风险溢价股权风险溢价ERP(equity risk premium,ERP)是指市场投资组合或具有市场平均风险的股票收益率与无风险收益率的差额。
从这个定义可看出:一是市场平均股票收益率是投资者在市场参与投资活动的预期“门槛”,若当期收益率低于平均收益时,理性投资者会放弃它而选择更高收益的投资;二是市场平均收益率是一种事前的预期收益率,这意味着事前预期与事后值之间可能存在差异。
2、资本配置线正是由于无风险资产引入,才可以形成无风险资产和风险资产之间的资本配置线CAL(capital allocation line,CAL),但是CAL仅仅为风险资产和无风险组合的“一般搭配”,并非“最优搭配”;而市场组合M与无风险资产构成全部资产组合的集合形成资本市场线(CML),是与“有效边界”相切的资本配置线,是一种“最优的”资本配置线。
3、市盈率增长因子(PEG)市盈率增长因子(PEG)是对P/E静态性缺陷的重要补充。
PEG是将一只股票的市盈率除以该公司的成长性。
其中,用估计盈利增长率除市盈率可以测算公司成长的速度,这就是著名的预期市盈率增长因子(Prospective PEG)。
市盈率增长因子越低,表示公司的发展潜力越大,公司的潜在价值也就越高。
市盈率/公司利润增长率,大于1说明估值高;小于1说明便宜。
4、动量效应投资者行为的研究表明,股票上涨得越多,就有也越多的投资者认为它继续上涨,因而股价的上涨存在一种自我实现机制,即存在动量效应(momentum effect)。
在股价的正反馈机制中,噪声交易这对股价上涨起到推动作用,而明智的专业投资者将从噪声交易者的追逐动能效应策略的过程中获取收益。
复旦大学研究生金融英语PPT
How much should people get paid for investing in the stockmarket?
Investors are betting that high returns from equities will pay for decent pensions. They are kidding themselves. Equities, the best asset for the long run, higher returns, diversified portfolio, cash, government bonds, safety in the short term, risk from inflation over longer periods
unexpected death
fatal accident enquiry, inquiry court hearing庭审 awards for injury n. 判决;裁定;裁定额
prudential but non liability insurance prudential: 1. Arising from or characterized by prudence. 2. Exercising prudence, good judgment, or common sense business interruption insurance业务中断保险 loss of turnover or trading profits营业额 money insurance reimburse v. 偿还 is open to liability claims that are not quantifiable
【复旦大学 投资学】Section2 Equity Premium Puzzle
Is the post-1926 period special?
• Mehra & Prescott(1985)
• Since 1926, annual returns for stocks and TB are 7 % and less than 1 %
•
1% for T-B (real)
• Mehra and Prescott (1989) argue that it is difficult to explain
• coefficient of relative risk aversion
• 30 VS 1
• Why is the premium so large? • Why is anyone willing to hold bonds?
the bet played out.
• Samuelson’s theorem of irrationality:
• Rationale for turning down the bet:
• “Because I would feel $100 loss more than $200 gain”
• Mental accounting • aggregation rules are not neutral • Example: • 50% win $200 • 50% loss $100 • Whether you will accept such a bet?
复旦大学 研究生投资学讲义 CHPT10-Investment Styles

Investment Styles Fan LongzhenIntroduction•Overview of investment styles;•Empirical evidence on returns of small capitalization firms and value stocks;•How to identify investment styles of a mutual fund –Characteristic-based style analysis–Return-based style analysis•Style benchmarks•Why value stock outperform growth stocks;•Earning and price momentumTypes of investment styles •Growth investing–Primarily concerned with the earning component of the P/E ratio–Look for high growth rate•Value (non-growth) investing–Primarily concerned with the price component of theP/E ratio–Look for cheap stocks•Small cap investing (as opposed to large cap)–Looking for neglected stocks–Undervalued relative to large cap equitiesInvestment styles•Value:–low price/book; low P/E; utilities industry •Growth: high EPS Growth–high profitability; health & technology •Small capitalizationWhy style analysis?•Returns of stocks in one category (e.g. growth) behave quite differently from stocks in another category (e.g. value)•Style analysis facilities–Monitoring style characteristics;–Diversification and risk control;–Performance valuation•In September 2001, a total of 3271 domestic equity managers participated in the survey–962 identify themselves as value managers;–1124 identify themselves as growth managers.Returns of small capitalization stocks•Fama and French (1992)–Rank the stocks into ten deciles based on marketcapitalization every year;–Compute the average 1-year holding period return after portfolio formation.–Found small stocks have higher returns than big stocks(1963-1991)–Fama and French do a secondary sort by beta withineach size decile, and find that beta can not explain thereturns.Return of high/low book-to-market stocks•Fama and French (1992, Journal of finance)–Rank stocks into ten deciles based on book-to-market ratio every year;–Compute the average 1-year holding periodreturn after portfolio formation;–Value stocks have higher average returns thangrowth stocks.Morningstar Fund Analysis •Market capitalization classification–Step 1: rank all stocks based market capitalization •Top 5% of the stocks as large cap;•Next 15% of the stocks are medium cap;•Remaining 80% of the stocks as small cap.---step 2:assign a score of 3 for large-cap stocks, 2 for mid-cap stocks, and 1 for small-cap stocks.---step3: calculate the weighted average of the market cap score across all stocks in the fund.---Step 4: classification•If market cap score<1.5 small cap fund •If 1.5<market cap score<2.5 medium cap fund•If market score>2.5 large cap fund ⇒⇒⇒Morningstar Fund Analysis •Growth/value classification–Step 1: estimate mediam P/E and P/B ratio of the stocks in three market-cap groups;–Step 2 compute the P/E and P/B score for each stock: divide each stock’s P/E and P/B by the median P/E and median P/B (respectively) of the stock’s market-cap group;–Step 3 calculate the average P/E and P/B score for each fund: average P/E or P/B score is 1.–Step 4 combined score=P/E score +P/B score –Step5 classification•If combined score>2.25 growth fund •If 1.75<combined score<2.25 blend fund •If combined score<1.75 value fund ⇒⇒⇒Return-based style analysis •Based on multiple factor model:•Where =return on fund •= return on style benchmark k •How to estimate the style exposure?–Regression of fund I on the return of style benchmarks;•Unconstrained regression•Constrained regression ( )•Quadratic programming ( )i K iK i i i e F b F b F b R ~~...~~~2211++++=i R ~k F ~1=∑ik b 0,1>=∑ik ik b bStyle benchmark•Six style index–S&P 500/Barra growth and value–S&P midcap 400/Barra growth and value–S&P smallcap 600/Barra growth and value•Growth and value indexes are constructed by dividing the stocks in the corresponding basic index based on book-to-price ratio. Each company in the index is assigned to either the value or growth index so that the two style add up to the full index.•The growth and value indexes are constructed so that they have the same market capitalization. Since growth companies are bigger than value companies, there are many more companies in the value index than the growth index.。
投资学精要(博迪)(第五版)习题答案英文版chapter3
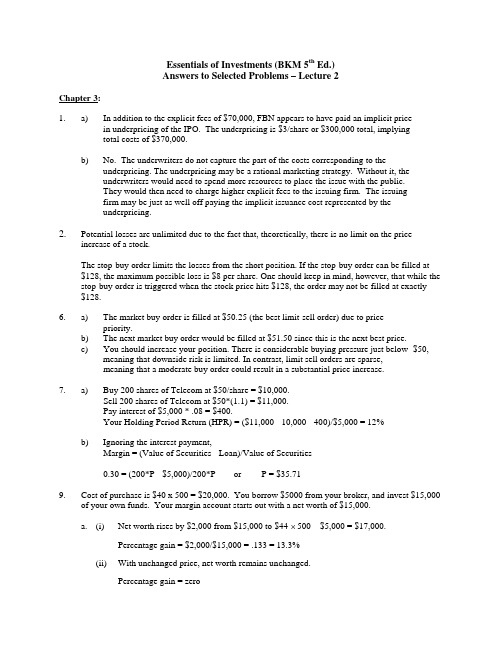
Essentials of Investments (BKM 5th Ed.)Answers to Selected Problems – Lecture 2Chapter 3:1. a) In addition to the explicit fees of $70,000, FBN appears to have paid an implicit pricein underpricing of the IPO. The underpricing is $3/share or $300,000 total, implyingtotal costs of $370,000.b) No. The underwriters do not capture the part of the costs corresponding to theunderpricing. The underpricing may be a rational marketing strategy. Without it, theunderwriters would need to spend more resources to place the issue with the public.They would then need to charge higher explicit fees to the issuing firm. The issuingfirm may be just as well off paying the implicit issuance cost represented by theunderpricing.2. Potential losses are unlimited due to the fact that, theoretically, there is no limit on the priceincrease of a stock.The stop-buy order limits the losses from the short position. If the stop-buy order can be filled at $128, the maximum possible loss is $8 per share. One should keep in mind, however, that while the stop-buy order is triggered when the stock price hits $128, the order may not be filled at exactly $128.6. a) The market buy order is filled at $50.25 (the best limit-sell order) due to pricepriority.b) The next market buy order would be filled at $51.50 since this is the next best price.c) You should increase your position. There is considerable buying pressure just below $50,meaning that downside risk is limited. In contrast, limit sell orders are sparse,meaning that a moderate buy order could result in a substantial price increase.7. a) Buy 200 shares of Telecom at $50/share = $10,000.Sell 200 shares of Telecom at $50*(1.1) = $11,000.Pay interest of $5,000 * .08 = $400.Your Holding Period Return (HPR) = ($11,000 - 10,000 - 400)/$5,000 = 12%b) Ignoring the interest payment,Margin = (Value of Securities - Loan)/Value of Securities0.30 = (200*P - $5,000)/200*P or P = $35.719. Cost of purchase is $40 x 500 = $20,000. You borrow $5000 from your broker, and invest $15,000of your own funds. Your margin account starts out with a net worth of $15,000.a. (i) Net worth rises by $2,000 from $15,000 to $44 × 500 – $5,000 = $17,000.Percentage gain = $2,000/$15,000 = .133 = 13.3%(ii) With unchanged price, net worth remains unchanged.Percentage gain = zero(iii) Net worth falls to $36 × 500 – $5,000 = $13,000.Percentage gain = –$2,000/$15,000 = –.133 = –13.3%The relationship between the percentage change in the price of the stock and the investor’s percentage gain is given by:% gain = % change in price × Total investment investor's initial equity = % change in price × 1.33For example, when the stock price rises from 40 to 44, the percentage change in price is 10%, while the percentage gain for the investor is 1.33 times as large, 13.3%:% gain = 10% × $20,000$15,000 = 13.3%b. The value of the 500 shares is 500P. Equity is 500P – 5000. You will receive a margin call when500P-5000500P = .25 or when P = $13.33.c. The value of the 500 shares is 500P. But now you have borrowed $10,000 instead of $5,000. Therefore, equity is only 500P – $10,000. You will receive a margin call when500P-10,000500P = .25 or when P = $26.67.With less equity in the account, you are far more vulnerable to a margin call.d. The margin loan with accumulated interest after one year is $5,000 x 1.08 = $5,400. Therefore, equity in your account is 500P – $5,400. Initial equity was $15,000. Therefore, your rate of return after one year is as follows:(i) (500 × $44 – $5400) – $15,00015,000= .1067, or 10.67%.(ii) (500 × $40 – $5400) – $15,00015,000= –.0267, or –2.67%.(iii) (500 × $36 – $5400) – $15,00015,000= –.160, or –16.0%.The relationship between the percentage change in the price of Intel and investor’s percentage return is given by:% gain = % change in price x Total investment investor's initial equity – 8% x Funds borrowed Initial net worthFor example, when the stock price rises from 40 to 44, the percentage change in price is 10%, while the percentage gain for the investor is10% × 20,00015,000 – 8% × 500015,000 = 10.67%e. The value of the 500 shares is 500P. Equity is 500P – 5,400. You will receive a margin call when500P – 5400500P= .25 or when P = $14.4010. a)The gain or loss on the short position is –500 x ∆P. Invested funds are $15,000.Therefore the rate of return = (-500 x ∆P)/15,000. The returns in each of the threescenarios are:(i) (-500 x 4)/15000 = -13.3%(ii) (-500 x 0)/15000 = 0%(iii) (-500 x (–4))/15000 = 13.3%b)Total assets in the margin account are $20,000 (from the sale of stock) plus $15,000(the initial margin) = $35,000. Liabilities are 500P (the price of buying back theshares). A margin call will be issued when:(20,000 + 15,000 – 500P)/500P = 0.25 or P=$56c)With a $1 dividend, the short position must also pay $1 per share or $500 ($1 x 500)on the borrowed shares. The rate of return will be (-500 x ∆P – 500)/15,000.(i) [(-500 x 4) – 500]/15000 = -16.7%(ii) [(-500 x 0) – 500]/15000 = -3.33%(iii) [(-500 x (–4)) – 500]/15000 = 10.0%Liabilities are now (500P + 500). A margin call will be issued when:(20,000 + 15,000 – 500P - 500)/500P = 0.25 or P=$55.2013. a)55 ½ b)55 ¼ c)The trade will not be executed since the price on the limit sell order is higher than the quotedbid price (and the quoted ask price). d) In a purely dealer market, the trade will not be executed since the price on the limit buy orderis lower than the quoted ask price and all buy orders must be executed against the dealer’s ask quote.However, even on the Nasdaq market, customer limit orders now get priority over dealerquotes when they offer a better price than the quotes. In addition, the order could besubmitted to an ECN where it would set the inside quote. As a result, the Nasdaq dealermarket is looking more and more like an exchange market (see 14(b) below). Since this limitbuy order is offering to pay a higher price than the dealer (whose bid quote is 55¼), the limitorder would be executed against the next incoming market sell order.14. a) There can be price improvement for the two market orders. Brokers for each of themarket orders (i.e., the buy and the sell orders) can agree to do a trade inside thequoted spread. For example, they can trade at $55 3/8, thus improving the price forboth customers by $1/8 relative to the quoted bid and ask prices. The buyer gets thestock for $1/8 less than the quoted ask price and the seller receives $1/8 more for thestock than the quoted bid price.b) Whereas the limit buy order at $55 3/8 would not be executed in a purely dealer market(since the ask price is $55 ½), it could be executed in an exchange market. A brokerfor another customer with an order to sell at the market price would view the limitbuy order as the best bid price. The two brokers could agree to the trade and bring itto the specialist who would then execute the trade.19. d) Your order will be triggered at a price of $55. However, when the stock price dropsbelow your stop-loss price of $55, your stop-loss order immediately becomes amarket order and is executed at the prevailing market price. Thus, you could get $55per share, but you could also get a little bit more or a little bit less.。
金 融 市 场 学 - 复旦大学经济学院

Interest from Munis
Is not subject to federal income tax. Hence the yields are lower:
r (1- t) = rm r - before tax return on taxable bond rm - return on municipal bond t - marginal tax rate Attractive to wealthy investors.
thus the bank discount yield is 7.91% rBD=(10,000-P)/10,000 · 360/n effective annual yield is: (1+400/9600)2-1=8.51% bond equivalent yield is: rBEY=(10,000-P)/P · 365/n
Small investors buy it through mutual funds. Most issues have credit rating.
Treated for tax purposes as regular debt.
LC backed (letter of credit) optional.
违约风险保护
偿债基金 未来债务 红利限制 抵押
债券定价(Bond Pricing)
Repurchase agreements (RPs) used by dealers in
government securities. Term repo has a maturity of 30 days or more. Reverse repo is the result of a dealer finding an investor buying government securities with an agreement to sell them at a specified price at a specified future date.
复旦大学本科生课件 - 投资学

投资学
第 1章
19
金融体系:间接融资、直接融资与资金、证券的流动
资金
金融中介 机构
资金
储蓄 证券
贷款 资金
贷款人(储蓄者 投资者): 1、个人与家庭 2、企业 3、政府 4、外国投资者
证券 资金
金融市场
证券 资金
借款人(筹资者、 发行者): 1、个人与家庭 2、企业 3、政府 4、外国投资者
20
投资学
金融资产的价值与其物质形态没有任何关系:债券可
能并不比印制债券的纸张更值钱。 整个社会财富的总量与金融资产数量无关,金融资产 不是社会财富的代表。
投资学 第 1章 5
金融资产在经济中的作用
1.
2.
3.
消费的时间安排( Consumption Timing):个 人现实消费与现实收入分离,将高收入期的购 买力转移到低收入期。 风险的分配( Allocation of Risk):风险来源 于实际资产,风险在全社会的分散和优化配置。 问题:金融工具能否减少总体经济的风险? 所有权与经营权分离( Separation of Ownership),复合所有权:变不可分割的资 产为可分割的资产。例如:GE的股东有50万, 股东的退出不影响公司的经营。
投资学
第 1章
7
1.2 金融市场
1.2.1 金融市场(Financial market)是金融 资产的交易场所。 合约性质:债券市场、股票市场、期货市 场、期权市场。 期限长短:货币市场和资本市场 功能:初级(一级)市场——发行市场, 二级市场——交易市场。
区别:第一市场、第二市场等
投资学 第 1章 17
1.2.3 金融机构(Financial institutions) (1)金融中介( Financial intermediaries)为 间接融资提供服务,包括:商业银行、保险 公司、投资基金、养老基金等。 (2)证券业(Security industry)为直接融资提 供服务:
- 1、下载文档前请自行甄别文档内容的完整性,平台不提供额外的编辑、内容补充、找答案等附加服务。
- 2、"仅部分预览"的文档,不可在线预览部分如存在完整性等问题,可反馈申请退款(可完整预览的文档不适用该条件!)。
- 3、如文档侵犯您的权益,请联系客服反馈,我们会尽快为您处理(人工客服工作时间:9:00-18:30)。
Burton G. Malkiel JOF 1995
Introduction
❖ Early 1970s, EMH accepted ❖ By the early 1980s, several cracks: returns
❖ The numbers of positive alpha and negative alpha are approximately equal.
❖ Table 3
❖ Grossman and Stiglitz(1980): positive alphas for pre-expense returns confirm that mutual funds do earn gross returns to cover expenses
❖ High returns: the funds failed have been dropped out of the sample
❖ Tendency of more successful funds to survive, overstated.
❖ “incubator” funds ❖ Funds quity
❖ Hot hand: mutual funds that achieved above average returns continue to enjoy superior performance.
❖ Expense ratios will also influence
❖ Analyze the predictability of performance by two-way tables showing successful performance over successive periods.
❖ The 1980s: small stocks tended to underperform the S&P stock index.
❖ 10-year sample limited
❖ There is relationship between returns and betas in mutual funds. The betas are stable
Weaker during the 1980s
4 simulations of strategies based on the persistence
❖ Whether the persistence of performance is economically significant.
expenses ❖ conclude
1 Survivorship bias and the data set employed
❖ Today’s investors are not interested in the funds that no longer exist, which creates the biases in the figures.
funds sold to the public. ❖ Quarterly total returns.
Some survivorship in table 1
The differences is big
2. A closer look at performance
❖ The t is only -0.21, so it is indistinguishable from 0. even surviving funds do not produce excess returns for investors after expenses.
❖ Over 20 year period 1971 to 1991, the relationships between betas and total returns disappear.
3. The “Hot Hand” Phenomenon: the persistence of mutual fund returns
❖ hot hand phenomenon
❖ Section 1: data ❖ Section 2: performance of the equity mutual
funds ❖ Section 3: hot hand phenomenon ❖ Section 4: simulate investment strategies ❖ Section 5: relation between returns and
❖ Jensen(1968): performance of mutual funds was inferior to randomly selected portfolios with equivalent risk
❖ Henriksson(1984): fund managers have enough private information to offset expenses.
❖ But positive alphas are small and insignificant. EGDH(1993): inappropriate benchmarks, if corrects for the non-S&P stocks, the positive alphas disappear.
are not independent and correlated over time. The predictability of returns ❖ Most efficiency test are joint tests ❖ Eugene Fama:”Sequels are rarely as good as the originals.”