蔡司电子水准仪使用说明书
蔡司电子水准仪使用说明书

蔡司电子水准仪使用说明书一、仪器键面按钮功能1、显示屏下面按钮ON/OFF 开机/关机★打开/关掉照明显示◎显示屏对比度调整DISP 单独距离测量MEAS 测量、记录键2、显示屏右面按钮MENU 进入主菜单INFO 显示主要仪器参数(电池量、时间、左右路线长)DISP 进行所有内容,显示预选显示资料PNr 输入单独/连续点号REM 输入点的代码与附加信息EDIT 打开数据管理编辑RPT 重复测量INV 正尺和倒尺测量的转换3、按钮上面的标识0…9 用于输入数字值+/- 符号输入.十进制位号▼▲屏幕翻滚查询4、软按钮屏幕下面的一排按钮为软按钮,对应屏幕最下一行相应的功能。
二、预设置(MENU)1、INPUT(软按钮MOD的功能用于修改设置)1 Reff.coeff. 0.130 (折射系数:-1 — +1)2 Vt.offset 0.00000 (标尺偏距:0 — 5M)3 Data4 Time2、LIMITS/TESTS1 Max.dist. 100(最大测量距离:10 — 100M)2 Min.sight. 0.200003 Max.sight 2.800004 Max.diff. 0.004005 Test 30cm ON3、ADJUSTMENT4、DATA TRANSFER1 INTERFACE 11 DINI → PERIPHERY (DINI到外部设备)2 PERIPHERY → DINI3 SET PARAMETERS (参数设置)(1 FORMAT REC E2 PROTOC. XON-XOFF3 BAUD RATE 96004 PARITY NONE5 STOP BITS 16 TIME OUT 90 S7 LINE FEET YES8 NAME COMP1)2 INTERFACE 2 (参照INTERFACE 1)3 PC-DEMO OFF (电脑演示)4 UPDATE/SERVICE (升级/服务)1 FORMAT PC Card (PC卡格式化)2 UPDATE DINI (升级)5、SET REC.PARAM(记录设置)1 RECORDING OF DATA(记录数据)1 REMOTE CONTRL OFF(远程控制)2 RECORD PC Card(PC卡记录)3 ROD READINGS RMC(记录数据格式RMC)4 PNO INCREMENT 1(点号自动增加的步长)5 TIME OFF2 PARAMETER SETTING(参数设置)1 FORMAT REC E (格式)2 PROTOC REC500(协议)3 BAUD RATE 9600(波特率)4 PARITY NONE5 STOP BITS 16 TIME OUT OFF(超时)7 LINE FEED YES(换行)6、SET INSTR. PARAM.(仪器设置)1 HEIGHT UNIT M(高程单位)2 INPUT UNIT M(输入单位)3 DISPLAY R 0.0001M(最小显示)4 SHUT OFF 10 MIN(关机等待时间)5 SOUND ON(声音)6 LANGUAGE E_ _ 340(语言)7 DATE YY.MM.DD(日期)8 TIME 24H(时间)7、LINE ADJUSTMENT(路线平差)三、水准路线测量1、选择水准路线主键面→ Line软按钮→出现三种水准路线模式供选择(cont line of Project:从工程文件中进行选择;continue line:继续上次的水准路线;new line:建立新的水准路线)2、水准路线数据采集1)选择水准路线模式→ Input line number(输入线路名)→选择测量模式(如BBFF)→ Inp benchmark height(输入起始点高程) → Inp point number(输入起始点名称) →Input point code(输入点代码,不输入时直接按OK) →按MEAS键开始测量。
【蔡司ZEISS】ZEN Blue Lite2_3英文版-光路管理-简易使用手册

亮度;左侧第二个节点略向下移,增大Gamma值,进 左侧第二个节点略向上移,减小Gamma值,增强图片
一步压制背景。
整体亮度。
选取图片中的感兴趣区 域
• 图像拍摄完成后,在图像下方的Graphics工具栏中,使用 • ROI按钮,截取感兴趣的区域,形成一张新的图片。
• 感兴趣区域ROI选择按钮。点击此按 钮,在图像中用红色 虚线方框框选感 兴趣区域,使用Ctrl+Shift+C按钮,可
ZEN Blue Lite 简易使用手册
9
彩色图像拍摄 3
再次点击Set Exposure按钮,根据白平 衡参数重新确定曝光时间。 点击Snap按钮,完成图像拍摄。
ZEN Blue Lite 简易使用手册
10
拍摄实用技 巧
勾选Auto Exposure,软件将默认在拍摄前 自 动计算曝光时间。 如果觉得自动曝光所得的图片亮度过高,可 以在Auto Exposure Intensity输入框中减 少百 分数,软件将在自动曝光时,相应缩 短曝光 时间,降低图片亮度。 点击Set Exposure后,软件自动计算所得的 曝光时间将显示在Camera工具栏下的 Exposure输入框中。也可以在此输入框中根 据需要自定义曝光时间,然后直接点击 Snap按钮拍摄,从而保证各实验组拍摄条 件相同。
从左至右依次为散点图,折线图,柱形图, 饼图和环形饼图的图形格式按钮。
ZEN Blue Lite 简易使用手册
20
图片叠 加
如需将拍摄所得的二张图片叠加起来,可以 在Processing主页面的Method工具栏中搜 索Add Channel选项。选中该选项后,该方 法名称将出现在Single按钮的上方。
2
DNA03电子水准仪使用说明

DNA03电子水准仪使用说明一、设备准备1.将DNA03电子水准仪放置在平稳的水平面上,确保仪器稳定并不会被振动或移动。
2.检查电子水准仪的电源电量,确保足够使用一段时间。
3.清理仪器的镜头和测量引导系统,确保没有灰尘或杂质影响测量结果。
二、测量操作1.打开电子水准仪的电源开关,等待仪器初始化完成。
2.设置仪器的水平线对准方式,可以通过仪器菜单进行设置,常用的有自动调平和手动调平两种方式。
-自动调平:仪器会自动通过内部调平器将仪器水平,适用于较为平整的场地。
-手动调平:需要使用调平螺丝和气泡水平管来调整仪器的水平状态,适用于复杂场地。
3.选择测量模式,DNA03电子水准仪提供了单次测量和连续测量两种模式。
-单次测量模式:适用于测量单个点的水平差,按下测量按钮即可进行一次测量。
-连续测量模式:适用于连续测量多个点的水平差,按下测量按钮后,仪器会自动测量并显示结果。
4.当仪器稳定后,将测量引导系统对准测量点,确保镜头准确瞄准。
5.按下测量按钮,待仪器完成测量后,读取并记录测量结果。
6.如果使用连续测量模式,将测量引导系统对准下一个测量点,重复步骤4-5三、维护保养1.使用完毕后,关闭电子水准仪的电源开关。
2.清理仪器表面和镜头,可以使用干净的布轻轻擦拭,不要用水或化学溶剂直接清洗。
3.检查仪器的调平系统,确保其调整螺丝和气泡水平管的状态良好。
5.充电电子水准仪的电池,确保电量充足。
四、注意事项1.在使用DNA03电子水准仪时,要注意避免长时间的暴露在高温或低温环境中,以防损坏仪器的内部元件。
2.使用过程中,应尽量避免仪器受到强烈的震动或撞击,如需要将仪器搬运,应采取适当的防护措施。
3.避免直接暴露在阳光下,以免影响测量结果,可以使用遮阳板进行防护。
4.在使用连续测量模式时,连续测量点的间隔时间要足够,以确保仪器有足够的时间进行测量和计算结果。
5.当电池电量较低时要及时充电,以免影响使用。
通过以上设备准备、测量操作和维护保养的具体步骤,可以帮助用户正确使用DNA03电子水准仪,并保证测量结果的准确性和可靠性。
数字水准仪 CL04 使用说明书

数字水准仪CL04ELECTRONIC DIGITAL LEVEL丨操丨作丨手丨册丨第一版OPERATION MANUAL V1.2引言祝贺您购买本高精度数字水准仪。
本手册包括操作手册和重要的安全指南以及安置和操作仪器的说明,详细内容请参考“安全指南”。
请您在使用仪器前仔细阅读本手册。
产品编号在仪器的标签上,标有该仪器的型号和仪器的系列号。
请将你的仪器型号和系列号填在下面,以便你在需要的时候,与本仪器的生产厂家或经销商联系。
本手册使用下列符号的含义:※危险:它表示非常严重的危险情况,如不避免,将造成人身伤害甚至死亡。
※警告:它表示潜在的或意外操作所导致的危险情况,如不避免,将造成人身伤害甚至死亡。
※小心:如不避免,可能造成轻微的损坏或明显的设备、经济损失和环境损坏。
☞要正确、有效的使用仪器,必须注意的重要信息。
一般操作注意事项在使用本仪器之前,务必检查并确认该仪器各项功能运行正常。
●避免条码尺面和每节标尺联接处被弄脏或损伤在标尺存放或运输时条码尺面和联接处可能会受到碰撞和损伤,如果条码被弄脏或损伤就难以精确读数和测量,因为仪器需要读出标尺的黑白条形码作为电信号,仪器的测量精度也会由此而降低,有时甚至无法进行测量。
●三脚架水准仪应尽量使用木制三脚架,使用金属三脚架可能会产生晃动,从而影响测量精度,三脚架每根腿上的螺旋必须切实固紧。
●三角基座如果基座安装不正确,测量精度可能受到影响,经常检查基座上的校正螺丝,基座上的中心固定螺旋要旋紧。
●装箱及防止仪器受震作为精密测量仪器,在运输过程中,应尽可能减小震动或冲击,剧烈震动可能导致测量功能受损,仪器装箱时,务必关闭电源并取下电池。
●小心搬动仪器搬动仪器时必须握住提手,且把仪器从三脚架上取下。
●避免仪器直接受到日晒雨淋或受潮长时间将仪器放置在高温(+50℃)环境下,会对仪器的使用产生不良的影响,不要将仪器的物镜对准太阳光,否则会损坏仪器内部的部件。
●避免温度突变仪器温度突变会导致测程缩短,当仪器从很热的汽车中搬出时,要让仪器逐渐适应周围的温度后方可使用。
Leica_Dna03_10电子水准仪操作教程

六、数据成果导出
共 17页
第 15页
南宁市骏徕仪器有限公司
38、按步骤 31,切换到水准处理界面,在标题栏上点右键—选择“查看”找要 想要查阅击右键,选择“另存为”
共 17页
第 16页
南宁市骏徕仪器有限公司
40、输入文件名,并勾选“包含标题”后点击“保存”,到此完成数据成果的导 出。
第 2页
南宁市骏徕仪器有限公司
三、开始外业水准测量 1、轻轻按压 [开机键],仪器即正常开机。 2、轻轻按压 [程序键],进入应用程序菜单。 3、在出现如下图所示中,选择进入第“3 线路测量”。
4、在出现如下图所示中,选择“1 作业”,进行新建一作业组。
5、在出现如下图所示中,把光标移到“增加”上,并按压键盘上的回车键,进 行新建作业的操作。
五、数据处理
共 17页
第 11页
南宁市骏徕仪器有限公司
26、点击软件“文件”—“新建项目”
27、输入项目名,点确定。
28、点“输入”—“原始数据”
29、把“文件类型”改为“DNA 03/10 原始数据(* .lev)”,找到前面从仪器下
共 17页
第 12页
南宁市骏徕仪器有限公司
载下来的文件,点中文件后点输入。
共 17页
第 17页
20、安装完成后第一次运行软件时要求输入注册码,按要求输入后点“注册”完 成程序的注册。
21、运行 leica geo office 软件后进入“工具”—“数据交换管理”
共 17页
第 9页
南宁市骏徕仪器有限公司
22、点开串口,并在对应的端口上点右键,并点击设置。 23、选择对应的端口,仪器选 DNA,波特率及结束符和仪器内的设置一致,一般 不建议改动。
蔡司 i-Solution DT-L DT DT-M 用户手册说明书
Features included in i-Solution DT-L/ DT/ DT-M iSolution DT-L is the program focused on core material science applications.iSolution DT has all features for various science and inspection applications.iSolution DT-M is the motorized stage control application version having all features of iSolution DT.It has many new developed functions alsoInclude:Live Measurement and Overlay SettingsUsers can perform measurements on the live preview image, using the crosshair or grid masks to center and count. The grid masks include calibration data. Calibration marker (scale bar) can be placed on the live preview image. The marker (scale bar) can also be burned on each captured image automatically. Anystandard file format image can be chosen to see it above live preview image.Calibration (Auto, Manual)All measurements start with an accurate calibration. Auto, Semi-Auto calibration functions allow the software to calculate the pixels-per-unit value automatically. Only setting the unit for the calibration scale and the distance between the scale marks is needed. This feature greatly improves the accuracy and repetition of measurements. Manual calibrations are easily added and saved for recall from a drop down menu. All calibrations can be saved as files, which let the calibration be retrieved by simply opening the saved files later.Calibration can be protected by password option. Two password options, one in calibration menu itself and the other in camera resolution option, protect calibration by unexpected change. A scale bar can be permanently added to each image. Scale bar properties for color, size and text are simple to optimize for any image background.Z-Axis Extended Focus Imaging (EFI), with displacement compensation for stereo microscopesSamples with curves or of varying heights are difficult to bring into focus under highly magnified conditions. And more a stereomicroscope takes images with tilting due to its own structural characteristics. Thus, each image is out of its supposed position when you move microscope to the Z-axis getting the right focus. Our displacement compensation function allows you to rearrange these images automatically and manually.Software can combine a stack of images sequentially captured at different levels of focus and combine them into a single in-focus image. You can count on our software not to leave any trace of the composites.3D Visualization. . . clearly view complex structuresA Three-dimensional picture can be created from any image. The 3-D presentation is based upon intensity values of the image and can be displayed as a normal or wire frame image. Z axis information can easily be adjusted to optimize the 3-D effect. To better visualize an image in 3-D, software offers full 360 degrees of rotation on X-Y-Z axis. A 3D image can then saved in JPG, TIF or BMP format.Image Stitching. . . create a mosaic of the “Big Picture”With our software, you can create auto and manual composites of continuously captured images in order to minimize the reduction in the field-of-view that typically comes with increased magnification. Combined images are automatically corrected for brightness without leaving any stitching mark. Live Image Comparison. . . for fast inspection and size verificationFor QA testing or quick go/no-go inspections any stored image can be used as a reference image onto which the live preview image is projected.Time Lapse Capture and Movie File Production. . . Import into Power PointSoftware features a Time Lapse Capture function that supports TIF, BMP and JPG file formats. The Time Lapse Capture function also includes an Auto Save feature byyyyy/mm/dd/hour/minute/second. You can save video movie recordings in AVI, MPG, MPEG, and MOV formats.Combine Image Planes - Fluorescence ImagingMerge and pseudo color monochrome images into a single RGB composite.Advanced - Fluorescence Image mergeFluorescence merging function allows several images to one composite image.There is rich list of pre-defined dyes already.One can choose desired emission wavelength in nanometers also and then correspondent color is calculated automaticallyExport Into Excel® - with one mouse clickA single mouse click exports the original image with measurement, calibration, annotation overlay, measurement data, statistics, and chart.Manual Measurement Tools - Including Various Perpendicular DistanceSoftware’s versatile manual measurement features include tools for measuring lengths, areas, and angles and can even auto detect an object's outline and then make specified measurements. The software is equipped with a wide choice of powerful measurement tools including 3-point circle functionality, Npoint circle measurement functionality, parallel line distance measurement, perpendicular distance measurement and object distance measurement. In addition, a zoom-in window can be used to determine the accurate measuring point of an object.Once you've measured a specimen you can easily export all of the images, measurement data and statistics to an Excel® file. With i-Solution DT, comprehensive statistics and data are just one effortless mouse click away.Line ProfilingSingle, multiple, parallel and polyline commands provide Gray/Red/Green/Blue intensity values for specific lines within an image. The profile data of each pixel on the line can be exported to MS Excel. Auto TraceUsing an automatic edge detection algorithm, our software will perform an auto trace measurement function around a closed object. This function greatly increases accuracy and saves time when makingmeasurements of complex shapes.Image ProcessingManual Brightness, Contrast, Gamma, Background Subtraction, Shading Correction, Histogram, Clone, Crop, AOI, Resize, Rotate, Split, Merge Monochrome series into RGB Color, Combine different exposure Images for highlight reduction, Image Mode Change, Grayscale, RGB, HSB, YUV Pseudo Color view, Full range of enhancement and morphology filters 8bit and 16bit per channel Manual MeasurementsPoint Count, Straight Line, Circle by radius, Circle by N points, Circle by diameter, Circle by 3 points, rectangle, polygon, polyline, splice lines from a common point, auto trace, angle parallel lines, perpendicular width, perpendicular from common line, angle between 2 lines, distance, perpendicular distance.Shading CorrectionThe edge parts of captured image by low magnification have background shading frequently, which can be removed by the shading correction function. The color of the original image remains the same though. A standard image is acquired from a blank space on the slide glass, or from an out of focus image in a metallurgical specimen. Such a standard image is used to correct the background shading of all other captured images.AnnotationLine, arrow, polyline, spline, rectangle, ellipse, textRegion of Interest- ROI. . . . with unique add/subtract capabilityRectangle, arbitrary rectangle, circle, arbitrary ellipse, polyline, spline, magic wand ROI itself can be saved to work with other images. The saved ROI can be placed on the exact same location of other images.View and Zoom ImageManual zoom In-Out, User Defined, Fit to Window, 1600% Zoom in Window for Accurate Edge Detect, sizeable context Window to view all open ImagesImage EditingUndo, Redo, Copy, Paste, Paste New, Delete, Delete All, Annotate, Image InformationSave OptionsTXT File Format, image and measurement data together in Proprietary .img File Format for future editing and data collectionSupported Image File Formatsjpg, jpeg, tif, tiff, bmp, gif, pcx, tga, mpg, mpeg, avi, mov, img, rpt, txt and etc.Report GeneratorCreate Report, Insert Image and Data, Insert other OLE ObjectsWindow ViewSplit Horizontal, Split Vertical, Cascade, Tile Horizontal, Tile Vertical, Arrange icons, Dynamic User Interface (UI), Classic, ModernTime Lapse Sequence ControlPlay Forward, Backward, Making Movie File (mpg, avi, mov) with Still Images, Split Single Image from Sequence FileAuto/Manual Thresholding for Count and SizeIntensity and color based thresholding tools for identifying, counting and categorizing objects.Ideal for automatic objects counting and percentage of area measurements.Objects Editing… enhanced measurement accuracy!Target threshold objects can be edited by all measurement parameters or with filters to clean, close, open, dilate, erode, automatic separate and fill holes.Densitometryi-Solution software automatically calculates Optical Density (OD) by absolute and relative figures, semi automatically, or manually based on user configuration. Images and OD figures can then be exported directly to an MS PowerPoint file.Perfect Focus Enhancementi-Solution implements a perfect function of focus compensation irrespective of the status of lights and specimen.Macro-Enabled RecordingCreate and save customized measurement settings and sequencesData CollectorSelect desired measurements then easily collect and tabulate data from multiple samples. Reflected Light Subtractioni-Solution creates clear, evenly illuminated images by removing the bright saturated light from a highly reflective sample.Automatic count for live and stained cellsConglomerated live and stained cells are separated automatically and counted.Particle AnalysisParticle data in many images is given by statistics and individual form. Each object is viewed with data together.Phase Analysis & Advanced Thresholdi-Solution conducts phase analysis on an entire image or within a specified Region of Interest (ROI) and it can allow to sort images using Gray Scale, RGB, HSB or YUV.Thickness Measurement (Layer Depth Measurement)Average thickness is measured automatically by defining box. The number of scan lines can be defined by users.Stereometry for BiovolumeThe 3D volume of an object is calculated by using 2D measuring parameters.67 selectable measurement parametersA complete menu of measurement types with a description of the parameter3D reconstructionA 3D rendering picture can be created from Z stacked images. A real 3D rendering picture is made by many Z stacked images. The 3-D presentation can be displayed as a normal or wire frame image. To better visualize an image in 3-D, software offers full 360 degrees of rotation on X-Y-Z axis. A 3D image can then saved in JPG, TIF or BMP format.Illuminator controlProgram controls illuminator shutter.Live cell countLive cells having irregular shape can be counted automatically, which can be hardly possible by ordinary thresholding method.Grain Size MeasurementiSolution DT provides the standard measurement environment in structure analysis of metal and materials according to ASTM E112 (2000). Both intercept lines and planimetric counting are available.Ferrite in Cast IronPercent Ferrite is calculated by excluding the graphite area. Graphite can be sorted for calculation including portions with the same gray intensity value of the background pearlite.Graphite Analysis in Nodular Cast IroniSolution DT may automatically generate measured data on the international standards regarding the cast iron. It provides graphite types and nodularity data according to the international standards such as ASTM A247-67 (1998), ISO 945 (1975), JIS G5502 (2001), KSD4302 (2002) with a single click. Chart NavigatorThe Chart Navigator permits direct comparison between the live or captured image and a series of reference images. The user-friendly interface makes you quickly find the image you need which matches or is similar to the live or captured image out of a large number of reference images. Both the live image and the reference image can be exported to MS Excel by simple mouse click. Synchronize zoom function makes it enable to see the same view size whatever zoom ratio the live or captured image has.Particle analysisIt gives particle analysis result with each object shape and statistic data.The below features are included in iSolution DT and DT-M only, not in DT-L Non-metallic Inclusion RatingThe functions in iSolution DT is intended to determine the inclusion content of steel according ASTM E45 (2002), ASTM E1122 (1996), DIN 50602 (1985), ISO 4967(1998), KSD 0204 (2002), JIS G0555 (2003). Two analysis approaches, Stereological measurements and JK inclusions ratings are implemented.Yarn filament analysisThe function is intended for processing a narrow class of special images with filament objects. There are four types of filament objects supported by the program: triangle, circles, FD circle, and polygon. Automatic Fruit Size AnalysisIt measures fruit size automatically.Volume fraction based on ASTM E562-05It gives the volume fraction of residual Austenite and Ferrite based on ASTM E562-05Rust Analysis based on ASTM D610-08 and JIS H 8681-2It gives the rust analysis result based on ASTM D610-08 and JIS H 8681-2Microindentation hardnessIt gives microindentation hardness test result based on Knoop and Vickers.The below features are included in iSolution DT-M onlyMotorized stage controliSolution DT-M controls motorized stage of Marzhauser, Ludl, Prior scientific, and ASIVirtual microscopeWith motorized control stage, it gives automatic image stitching for scanning whole slide area. While making a whole large area image, image stitching and microscope focus enhancement can be done at the same time. Even with stereomicroscope, such a function is available.Image analysis with automatic image stitchingImage analysis with data collector can be done having automatic image stitching at the same time. Image analysis data can be achieved while making a large stitched image by motorized control stage, which gives analysis data and whole picture at the same time.Automatic focus adjustmentWhile stage is moved, focus is adjusted automatically by software function alone, not with any other additional hardware device.Banding analysis based on ASTM E1268It gives banding analysis result based on ASTM E1268 standard.Adding customized modules by requestSystem Requirements• PC with a Pentium-class processor; Pentium 300MMX or higher recommended• Microsoft Windows Win7/Vista/WinXP/2000/ME/Win98SE operating system• 32 MB of RAM or more (128 MB recommended)• 15 MB or more hard-disk space (50 MB recommended)• CD-ROM drive• VGA or higher-resolution monitor; Super VGA recommended (1024 x 768 pixel and 24 bit and more color support video card is recommended)• Microsoft Mouse or compatible pointing device• USB- or LPT-port for hardware key (depends on delivery).Supported imaging devices1. TWAIN Driver2. DirectShow/ WDM (Windows driver mode) driver3. i-Link DevicesAll PixeLINK cameras.Optronics digital cameras- MicroFire- MacroFire- QuantiFire and QuantiFire XI- Microcast- All MPX series cameras- All QPX series camerasJenoptik ProgRes digital cameras- C3 (cooled and non-cooled)- C5 (cooled and non-cooled)- C14- ProgRes CF and CFScan (cooled, non-cooled, and scan)- ProgRes MF (cooled, non-cooled, and scan)-ProgRes all CMOS cameras.Nikon digital cameras- DS-U2 Fi1- DS 5M/2M-U2- DS 5M/2M-U1- DXM 1200C- DXF 1200FPixera digital camera- Penguin series all models- Pro series all modelsScion corporation digital camera-CFW series all modelsMatrix vision-mvBlueFox digital cameraArtray- ARTCAM-500MI- ARTCAM-300MI- ARTCAM-200MI- ARTCAM-130MI (color, mono, and NIR) - ARTCAM-036MI (color, mono, and TWIN) - ARTCAM-500P- ARTCAM-200SH- ARTCAM-150P-II (color and mono)- ARTCAM-098 (color and mono)- ARTCAM-34MCLumenera- Infinity 1 series all models- Infinity 2 series all models- Infinity 3 series all models- Infinity X and Infinity X-21XLi camera- M series cameras- DC series cameras- DX series camerasSpot digital camera- Insight- FlexQimaging digital cameras- MicroPublisher- RetigaAll Leica digital cameras by TWAINCarl Zeiss AxioCam by TWAINFlashBus frame grabber- Spectrim Lite- Spectrim Pro- MV LiteMatrox frame grabber- Meteor IIAvermedia frame grabber- EZMakerConsumer digital camerasIMT i-Solution Inc. 。
DNA03电子水准仪使用说明

Coll.Err(视线倾斜误差(i 角))
显示当前倾斜误差(i 角)大小。可以修改为仪器新的存 贮值。
Code (编码)
输入及选择编码。
Decimals 显示的小数位和人工输入的小数位。
GSI – format
数据以GSI 格式输出数据。
GSI - 8 8 位字符输出格式。可以是字母也可以是数字.
【设置限差】 2/2 DistB-F:
on on on on on on
值 on
Precise : 精密测量模式激活与否。
Distbal : 前后距离差=后视距离-前视距离。
Maxdist:仪器到标尺的最大距离。 Mindist:仪器到标尺的最小距离。 StafEnds : 读数到标尺两端的最小距离。 DistEnds : 最大最小距离。
GSI – 16
16位字符输出格式。可以是字母也可以是数字。
Earth curvature correction(地球曲率改正)
Yes —— 进行改正。 No —— 不进行改正。
通讯设置 通过RS232 接口在仪器和计算机间传输数据的通讯参数 Baudrate (波特率) 1200 、2400 、4800 、9600 、1 92 00 ( bits /秒) Data bits (数据位)
∑后视读数= -)∑前视读数=
∑平均高差=
测段小结
一测段的往返测结束后,计算下列数值。
测段距离:
D中=(D往+D返)/2
往返测高差闭合差f h:
f h =h 往 +h 返 若高差闭合差符合限差要求,则计算往返测高差平均值: h均=(h往-h返)/2
电子水准仪使用说明书(内容全面可编辑)
数据格式-Rec_E 数据文件
ห้องสมุดไป่ตู้
数据格式- Rec 500 数据文件
其他信息
电子水准测量时需要的条件: 尺子上必须有 30cm 的刻度区域 可见,也就是大约在十字丝上方必须有15cm 的条码可见; 电池是锂电池, 一次充电 4 小时可以连续使用3个工作日; 电子水准仪是高精度仪器需要小心使用:日常护理和检查是非 常必要的; 一般在标准的像台上进行圆气泡的调节.
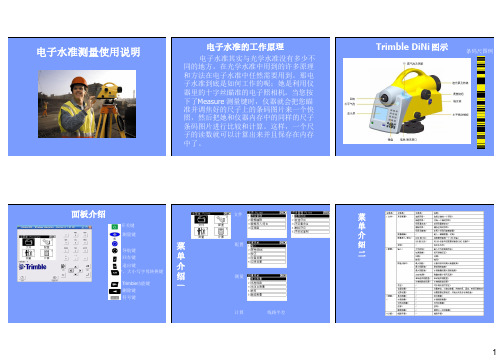
电子水准测量使用说明
电子水准的工作原理
电子水准其实与光学水准没有多少不 同的地方。在光学水准中用到的许多原理 和方法在电子水准中任然需要用到。那电 子水准到底是如何工作的呢;她是利用仪 器里的十字丝瞄准的电子照相机。当您按 下了Measure 测量键时,仪器就会把您瞄 准并调焦好的尺子上的条码图片来一个快 照,然后把她和仪器内存中的同样的尺子 条码图片进行比较和计算。这样,一个尺 子的读数就可以计算出来并且保存在内存 中了。
注:如果要进行平差计算,请选择数据记录格式为RMC;
操作流程-测量-单点测量
测量->单点测量
1、输入点号,如3 2、瞄准标尺,点击测量按钮进行测量 3、在屏幕的左边“结果”部分可以看 到测量的结果; 在屏幕的右边“下一点”部分是下一 个要测量的点的信息 4、如果对测量的结果不满意,还可以 利用进行重测
注意: A、路线平差可以对闭合路线和附和路线进行平差; B、在您对一个内存中的闭合环进行平差后,被平差 过的信息会被保存起来,所以记住在平差之前要下载 下来他的原始数据;
操作流程-计算-平差(二)
4、输入起点、终点的高程; 5、闭合差是否满足要求; 6、平差成功;
- 1、下载文档前请自行甄别文档内容的完整性,平台不提供额外的编辑、内容补充、找答案等附加服务。
- 2、"仅部分预览"的文档,不可在线预览部分如存在完整性等问题,可反馈申请退款(可完整预览的文档不适用该条件!)。
- 3、如文档侵犯您的权益,请联系客服反馈,我们会尽快为您处理(人工客服工作时间:9:00-18:30)。
蔡司电子水准仪使用说明书
一、仪器键面按钮功能
1、显示屏下面按钮
ON/OFF 开机/关机
★打开/关掉照明显示
◎显示屏对比度调整
DISP 单独距离测量
MEAS 测量、记录键
2、显示屏右面按钮
MENU 进入主菜单
INFO 显示主要仪器参数(电池量、时间、左右路线长)DISP 进行所有内容,显示预选显示资料
PNr 输入单独/连续点号
REM 输入点的代码与附加信息
EDIT 打开数据管理编辑
RPT 重复测量
INV 正尺和倒尺测量的转换
3、按钮上面的标识
0…9 用于输入数字值
+/- 符号输入
.十进制位号
▼▲屏幕翻滚查询
4、软按钮
屏幕下面的一排按钮为软按钮,对应屏幕最下一行相应的功能。
二、预设置(MENU)
1、INPUT(软按钮MOD的功能用于修改设置)
1 Reff.coeff. 0.130 (折射系数:-1 —+1)
2 Vt.offset 0.00000 (标尺偏距:0 —5M)
3 Data
4 Time
2、LIMITS/TESTS
1 Max.dist. 100(最大测量距离:10 —100M)
2 Min.sight. 0.20000
3 Max.sight 2.80000
4 Max.diff. 0.00400
5 Test 30cm ON
3、ADJUSTMENT
4、DATA TRANSFER
1 INTERFACE 1
1 DINI →PERIPHERY (DINI到外部设备)
2 PERIPHERY →DINI
3 SET PARAMETERS (参数设置)
(1 FORMAT REC E
2 PROTOC. XON-XOFF
3 BAUD RATE 9600
4 P ARITY NONE
5 STOP BITS 1
6 TIME OUT 90 S
7 LINE FEET YES
8 NAME COMP1)
2 INTERFACE 2 (参照INTERFACE 1)
3 PC-DEMO OFF (电脑演示)
4 UPDATE/SERVICE (升级/服务)
1 FORMAT PC Card (PC卡格式化)
2 UPDATE DINI (升级)
5、SET REC.PARAM(记录设置)
1 RECORDING OF DATA(记录数据)
1 REMOTE CONTRL OFF(远程控制)
2 RECORD PC Card(PC卡记录)
3 ROD READINGS RMC(记录数据格式RMC)
4 PNO INCREMENT 1(点号自动增加的步长)
5 TIME OFF
2 PARAMETER SETTING(参数设置)
1 FORMAT REC E (格式)
2 PROTOC REC500(协议)
3 BAUD RATE 9600(波特率)
4 PARITY NONE
5 STOP BITS 1
6 TIME OUT OFF(超时)
7 LINE FEED YES(换行)
6、SET INSTR. PARAM.(仪器设置)
1 HEIGHT UNIT M(高程单位)
2 INPUT UNIT M(输入单位)
3 DISPLAY R 0.0001M(最小显示)
4 SHUT OFF 10 MIN(关机等待时间)
5 SOUND ON(声音)
6 LANGUAGE E_ _ 340(语言)
7 DATE YY.MM.DD(日期)
8 TIME 24H(时间)
7、LINE ADJUSTMENT(路线平差)
三、水准路线测量
1、选择水准路线主键面→Line软按钮→出现三种水准路线模式供选择(cont line of Project:从工程文件中进行选择;continue line:继续上次的水准路线;new line:建立新的水准路线)
2、水准路线数据采集
1)选择水准路线模式→Input line number(输入线路名)
→选择测量模式(如BBFF)→Inp benchmark height(输入起始点高程) →Inp point number(输入起始点名称) →Input point code(输入点代码,不输入时直接按OK) →按MEAS键开始测量。
2)DIST键只用于测距离,不记录。
读数前应调焦看清尺面,然后方可读数。
3)已知点在观测前应先输入点名(PNR—4键用于输入点名)。
4)在读数过程中如有障碍物影响读数精度,则会出现提示,按确认键后选“NO”表示不重测,按“YES”表示重测刚才的测段。
5)当读数大于2.8或小于0.2时也会出现警告提示,按“NO”表示忽略警告,存储数据;按“YES”表示重测刚才的测段。
6)当中间按到结束键时应按“NO”键表示不符合到已知点。
7)当观测完最后一点后,按“LEND”结束观测线路,然后按提示进行。
(Inp benchmark height(输入结束点高程) →Inp point number(输入结束点名称、默认为最后一点点名) →Input point code(输入点代码,不输入时直接按OK))。
四、数据传输
1、用数据传输电缆线连接水准仪和计算机。
2、打开Zhonghan Data Processor软件,Language →Simlified Chinese (GB) 进行汉化。
3、数据传输→仪器类型→蔡司DINI 电子水准仪
4、数据传输→通讯参数设定→对通讯口、波特率、奇偶校验、;流控制、数据位、停止位进行设置。
5、连接水准仪和计算机,
打开水准仪,MENU →4、DATA TRANSFER → 1 INTERFACE 1 →1 DINI →PERIPHERY (DINI到外部设备)进行传输,
确认后进行选择,按“all”将传输整个项目的数据;按“?”进入下一个界面。
?PNO选择项目?Cod选择代码?Adr选择地址?Lno选择线路
Adr选择地址:输入起始地址和结束地址;
Lno选择线路:输入线路名,出现线路起始地址,确认;输入结束线路名(同名),出现线路结束地址,确认后即进行传输。
五、数据处理
1、打开dini水准数据处理程序。
2、在“数据处理”栏中按“选择”按钮,选择编辑好的水准线路数据文件(TXT文件、单线路数据),按“计算”按钮后出现对话框,提示输入起始点真高,输入后按“OK”,在原文件夹下生成同名的DAT文件。
3、在“表格处理”栏中选择水准等级;单击“选择”按钮选择生成的DAT文件;在“水准表”栏中输入测量时间。
按“水
准表”按钮出现对话框,输入起始点真高后按OK,输入终点真高后OK。
即可在相同目录下生成水准成果表。
附注:1、水准计算模板应放在(C:/模板文件/)下
2、模板文件可进行修改。