经济学原理曼昆第七版第章消费者选择理论多选题答案
经济学原理曼昆第七版第章消费者选择理论多选题答案

B.牛奶更多,早餐麦片更少
C.牛奶更少,早餐麦片更多
D.牛奶更少,但对早餐麦片的影响并不清楚
【答案】C
【解析】分析收入效应和替代效应的综合影响。
牛奶价格上升
收入效应
替代效应
总效应
牛奶(正常物品)
减少
减少
减少
早餐麦片(低档物品)
增加
增加
增加
5.如果通心粉价格上升而消费者购买更多通心粉,我们就可以推断:
斜率是-2(很多人漏掉负号。)
3.你只消费苏打水和比萨饼。有一天,苏打水的价格上升了,比萨饼的价格下降了,而且,你与价格变动以前的满足程度相同。
a.用图形说明这种情况。
b.你对这两种物品的消费量会如何变动?你的反应如何取决于收入效应和替代效应?
c.你能买得起价格变动前你消费的苏打水和比萨饼的组合吗?
2.在无差异曲线上任何一点,该曲线的斜率衡量消费者的__________.
A.收入
B.用一种物品换另一种物品的意愿
C.对两种物品是替代品还是互补品的认知
D.需求弹性
【答案】B
【解析】无差异曲线的斜率是边际替代率。
3. Mathew和Susan是衬衫和帽子市场上的两个追求最优化的消费者,他们用100美元买一件衬衫,用50美元买一顶帽子。Mathew买了4件衬衫和6顶帽子,而Susan买了6件衬衫和12顶帽子。从这些信息,我们推断,Mathew的边际替代率是每件衬衫__________顶帽子,而Susan是每件衬衫_______顶帽子。
6.说明下面每一种说法正确还是错误。解释你的答案。
a.“所有的吉芬物品都是低档物品。”
b.“所有的低档物品都是吉芬物品。”
定义
曼昆《经济学原理》第七版课后习题的答案(中文版)!!30
曼昆《经济学原理》第七版课后习题的答案(中文版)!!30曼昆《经济学原理》第七版课后习题的答案(中文版)!!练习题1、任何一个所得税表都体现了两种税率——平均税率和边际税率。
(题中的表见课本12章)a、平均税率定义为支付的总税收除以收入。
对表12—7中的比例税制来说,赚5万美元、10万美元和20万美元的人,其平均税率分别是多少?在累退税制和累进税制中相对应的平均税率是多少?答:从表12—7中很容易看出,赚5万美元、10万美元和20万美元的人,其平均税率都是25%。
在累退税制中,赚5万美元、10万美元和20万美元的人,其平均税率分别是30%,25%,20%。
在累进税制中,赚5万美元、10万美元和20万美元的人,其平均税率分别是20%,25%,30%。
b、边际税率定义为额外收入支付的税收除以增加的额外收入。
计算比例税制下,收入从5万美元增加到10万美元的边际税率。
计算收入从10万美元增加到20万美元的边际税率。
计算累退税制和累进税制下相对应的边际税率答:(1)比例税制。
当收入从5万美元增加到10万美元时,税收量增加了1.25万,因此边际税率为1.25/5=0.25,即25%。
当收入从10万美元增加到20万美元时,税收量增加了2.5万,因此边际税率为2.5/10=0.25,即25%。
(2)累退税制。
当收入从5万美元增加到10万美元时,税收量增加了1万,因此边际税率为1/5=0.2,即20%。
当收入从10万美元增加到20万美元时,税收量增加了1.5万,因此边际税率为1.5/10=0.15,即15%。
(3)累进税制。
当收入从5万美元增加到10万美元时,税收量增加了1.5万,因此边际税率为1.5/5=0.3,即30%。
当收入从10万美元增加到20万美元时,税收量增加了3.5万,因此边际税率为3.5/10=0.35,即35%。
c、描述这三种税制中每一种的平均税率和边际税率之间的关系。
一般来说,某人在决定是否接受工资比目前工作略高一点的工作时,哪一种税率更适用?在判断税制的纵向平等时,哪一种税率更适用?答:在比例税制下,平均税率和边际税率相等,且都不随收入变动而变动。
曼昆《经济学原理(微观经济学分册)》课后习题详解(第7篇)【圣才出品】
曼昆《经济学原理(微观经济学分册)》课后习题详解(第7篇)【圣才出品】第7篇深⼊研究的论题第21章消费者选择理论⼀、概念题1.预算约束线(budget constraint )答:预算约束线⼜称消费可能线和价格线,指对消费者可以承受(在消费者收⼊和消费者希望购买的物品价格既定时)的消费组合的限制。
预算约束线表⽰消费者⽀付得起的消费组合。
假定以I 表⽰消费者的既定收⼊,以P 1和P 2分别表⽰商品1和商品2的价格,以X 1和X 2分别表⽰商品1和商品2的数量,那么,相应的预算等式为:P 1X 1+P 2X 2=I 。
上式表⽰:消费者的全部收⼊等于他购买商品1和商品2的总⽀出。
⽽且,可以⽤1I P 和2I P 来分别表⽰全部收⼊仅购买商品1或商品2的数量,它们分别表⽰预算约束线的横截距和纵截距。
此外,上式还可以改写成如下形式:12122P I X X P P =?+。
式中的预算约束线⽅程表明,预算约束线的斜率为12P P ?,纵截距为2I P 。
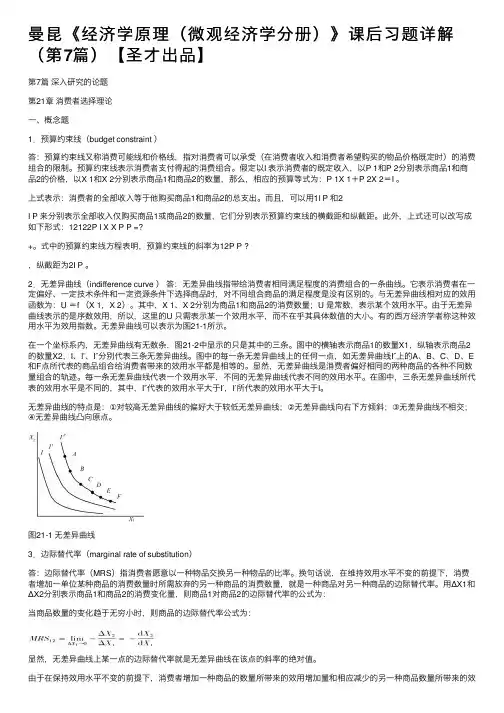
2.⽆差异曲线(indifference curve )答:⽆差异曲线指带给消费者相同满⾜程度的消费组合的⼀条曲线。
它表⽰消费者在⼀定偏好、⼀定技术条件和⼀定资源条件下选择商品时,对不同组合商品的满⾜程度是没有区别的。
与⽆差异曲线相对应的效⽤函数为:U =f (X 1,X 2)。
其中,X 1、X 2分别为商品1和商品2的消费数量;U 是常数,表⽰某个效⽤⽔平。
由于⽆差异曲线表⽰的是序数效⽤,所以,这⾥的U 只需表⽰某⼀个效⽤⽔平,⽽不在乎其具体数值的⼤⼩。
有的西⽅经济学者称这种效⽤⽔平为效⽤指数。
⽆差异曲线可以表⽰为图21-1所⽰。
在⼀个坐标系内,⽆差异曲线有⽆数条,图21-2中显⽰的只是其中的三条。
图中的横轴表⽰商品1的数量X1,纵轴表⽰商品2的数量X2,I、I′、I″分别代表三条⽆差异曲线。
图中的每⼀条⽆差异曲线上的任何⼀点,如⽆差异曲线I″上的A、B、C、D、E 和F点所代表的商品组合给消费者带来的效⽤⽔平都是相等的。
曼昆《经济学原理(微观经济学分册)》(第7版)课后习题详解
曼昆《经济学原理(微观经济学分册)》(第7版)课后习题详解第1章经济学十大原理一、概念题1.稀缺性(scarcity)答:经济学研究的问题和经济物品都是以稀缺性为前提的。
稀缺性指在给定的时间内,相对于人的需求而言,经济资源的供给总是不足的,也就是资源的有用性与有限性。
人类消费各种物品的欲望是无限的,满足这种欲望的物品,有的可以不付出任何代价而随意取得,称之为自由物品,如阳光和空气;但绝大多数物品是不能自由取用的,因为世界上的资源(包括物质资源和人力资源)是有限的,这种有限的、为获取它必须付出某种代价的物品,称为“经济物品”。
正因为稀缺性的客观存在,地球上就存在着资源的有限性和人类的欲望与需求的无限性之间的矛盾。
经济学的一个重要研究任务就是:“研究人们如何进行抉择,以便使用稀缺的或有限的生产性资源(土地、劳动、资本品如机器、技术知识)来生产各种商品,并把它们分配给不同的社会成员进行消费。
”也就是从经济学角度来研究使用有限的资源来生产什么、如何生产和为谁生产的问题。
2.经济学(economics)答:经济学是研究如何将稀缺的资源有效地配置给相互竞争的用途,以使人类的欲望得到最大限度满足的科学。
时下经常见诸国内报刊文献的“现代西方经济学”一词,大多也都在这个意义上使用。
自从凯恩斯的名著《就业、利息和货币通论》于1936年发表之后,西方经济学界对经济学的研究便分为两个部分:微观经济学与宏观经济学。
微观经济学是以单个经济主体(作为消费者的单个家庭或个人,作为生产者的单个厂商或企业,以及单个产品或生产要素市场)为研究对象,研究单个经济主体面对既定的资源约束时如何进行选择的科学。
宏观经济学则以整个国民经济为研究对象,主要着眼于对经济总量的研究。
3.效率(efficiency)答:效率指人们在实践活动中的产出与投入之比值,或者是效益与成本之比值,如果比值大,效率就高;反之,比值小,效率就低。
效率与产出或者收益的大小成正比,而与成本或投入成反比,也就是说,如果想提高效率,必须降低成本或投入,提高收益或产出。
曼昆《经济学原理(宏观经济学分册)》(第7版)配套题库【课后

【课后
读书笔记模板
01 思维导图
03 目录分析 05 读书笔记
目录ห้องสมุดไป่ตู้
02 内容摘要 04 作者介绍 06 精彩摘录
思维导图
本书关键字分析思维导图
章节
经济学
问题
真题
争论
教材
原理
题库
原理
部分 第章
增长
习题
经济
总需求
宏观经济
失业
政策
分册
内容摘要
精彩摘录
精彩摘录
这是《曼昆《经济学原理(宏观经济学分册)》(第7版)配套题库【课后习题+章节题库(含名校考研真 题)+模拟试题】》的读书笔记模板,可以替换为自己的精彩内容摘录。
谢谢观看
内容摘要
本书特别适用于参加研究生入学考试指定考研参考书目为曼昆《经济学原理(宏观经济学分册)》的考生, 也可供各大院校学习曼昆《经济学原理(宏观经济学分册)》的师生参考。本题库是曼昆《经济学原理(宏观经 济学分册)》(第7版)教材的配套题库,主要包括以下内容:第一部分为课后习题及详解。对曼昆《经济学原理 (宏观经济学分册)》(第7版)教材每章的课后习题进行了详细的分析和解答,并对个别知识点进行了扩展。课 后习题答案多次修改,质量上乘,非常标准,特别适合应试作答和临考冲刺。第二部分为章节题库(含名校考研 真题)及详解。严格按照曼昆《经济学原理(宏观经济学分册)》(第7版)教材内容进行编写,共分14章。每 一章都精心挑选名校考研真题以及经典常见考题,并予以详细解答。所选考题具有一定的代表性,既注重基础知 识的掌握,让学员具有扎实的专业基础,也对一些重难点部分(包括教材中未涉及到的知识点)进行详细阐释, 以使学员全方位备考。熟练掌握本书考题的解答,有助于学员理解和掌握有关概念、原理,并提高解题能力。第 三部分为模拟试题及详解。参照曼昆《经济学原理(宏观经济学分册)》(第7版)教材,根据各高校历年考研真 题的命题规律及热门考点精心编写了两套考前模拟试题,并提供详尽、标准解答。
曼昆经济学原理课后答案第七章消费者、生产者与市场效率
复习题1.解释买者的支付意愿、消费者剩余和需求曲线如何相关。
答:需求曲线反映了买者的支付意愿。
在任何一种数量时,需求曲线给出的价格表示边际买者的支付意愿。
需求曲线以下和价格以上的总面积是一种物品或劳务市场上所有买者消费者剩余的总和。
2.解释卖者的成本、生产者剩余和供给曲线如何相关。
36答:供给曲线的高度与卖者的成本相关。
在任何一种数量时,供给曲线给出的价格表示边际卖者的成本。
价格之下和供给曲线以上的面积衡量市场的生产者剩余。
3.在供求图中,标出市场均衡时的生产者剩余和消费者剩余。
答:APE 的面积代表消费者剩余;PBE 的面积代表生产者剩余。
图7-1 供求图4.什么是效率?它是经济决策者的唯一目标吗?答:效率是指资源配置使社会所有成员得到的总剩余最大化的性质。
除了效率外,经济决策者还应该关心平等。
实际上,市场交易的好处很像在市场参与者之间分割一块蛋糕,经济决策者不仅要关心如何将经济蛋糕做大,即效率;还要考虑如何在市场参与者之间分这块蛋糕,这就涉及公平问题。
5.看不见的手有什么作用?答:每一个市场参与者都会尽力追求自己的利益,看不见的手指引他们在相互竞争中达到一个并非他们本意想要达到的目的,这就是市场均衡点。
在均衡点上,消费者剩余和生产者剩余总和最大化,整个社会福利达到最大。
6.说出两种市场失灵的名称。
解释为什么每一种都可能使市场结果无效率。
答:市场失灵包括市场势力和外部性。
如果某一市场上存在市场势力,即只有极少部分(可能是一个)买者或卖者可以控制市场价格,他们就会使价格趋向于对他们这一小部分人有益的水平。
于是,市场价格和数量背离供求平衡,社会福利达不到最大,市场失去效率。
外部性是某些市场参与者的行为对旁观者福利的影响。
它使市场福利还要取决于买者评价和卖者成本之外的其他因素。
由于买者和卖者在决定消费和生产时并没有考虑这种负作用。
所以,从整个社会角度来看,市场均衡可能是无效率的。
问题与应用1.Melissa用120美元购买了一个iPod,并得到了80美元的消费者剩余。
曼昆经济学原理第七课后题及答案
二十三章1下列每种交易会影响CDP的哪一部分(如果有影响的话)并解释之。
A.家庭购买了一台新冰箱。
答:家庭购买了一台新冰箱会增加GDP中的消费(C)部分,因为家庭用于家用电器的支出计算在消费的耐用品类中。
B.杰妮姑妈买了一所新房子。
答:杰妮姑妈买了一所新房子会增加GDP中的投资(1)部分,因为家庭住宅能长期供人居住,提供服务。
它比一般耐用消费品的使用寿命更长,因此把住宅房屋的投资计算在投资中。
C.福特汽车公司由其存货中出售了一部雷鸟牌汽车。
答:福利汽车公司由其存货中出售了一部雷鸟牌汽车会减少现期GDP中的投资,因为销售中间物品存货时,企业的存货投资是负的,因而减少了当期的GDP。
C.你买了一个比萨饼。
答:我买了一个比萨饼会增加GDP中的消费(C),因为我用于购买食品的支出计算在消费的非耐用品类中。
D.加利福尼亚重新铺设了101号高速公路。
答:加利福尼亚重新铺设了101号高速公路增加了GDP中的政府购买(G),因为修建高速公路是政府的行为。
E.你的父母购买了一瓶法国红酒。
答:我的父母购买了一瓶法国红酒会减少GDP中的净出口(NX),因为法国红酒是进口食品,它的购买增加了美国的进口。
F.本田公司扩大其在俄亥俄州马利斯维尔的工厂。
答:本田公司扩大其在俄亥俄州马利斯维尔的工厂增加了GDP中的净出口(NX),因为本田公司是一家日本企业,它在美国的投资减少了美国对日本本田汽车的进口,使NX增加2.GDP组成部分中的“政府购买”并不包括用于社会保障这类转移支付的支出。
想想GDP 的定义,解释为什么转移支付不包括在政府购买内答:因为转移支付并不是要交换现在生产的物品或劳务,从宏观经济的角度看,转移支付就像税收和回扣一样。
转移支付和税收一样改变了家庭收入,但并没有反映经济的生产。
由于GDP是要衡量在某一既定时期一个国家从物品与劳务的生产中得到的收入,所以,不把转移支付包括在政府购买内。
6.考虑以下美国GDP的数据:A.1996年到1997年间名义收入增长率是多少(注意:增长率是一个时期到下一个时期百分比的变动。
经济学原理曼昆课后答案chapter7.doc
Problems and Applications1.If an early freeze in California sours the lemon crop, the supply curve for lemons shiftsto the left, as shown in Figure 7-5.The result is a rise in the price of lemons and adecline in consumer surplus from A + B + C to just A. So consumer surplus declines by the amount B + C.Figure 7-5In the market for lemonade, the higher cost of lemons reduces the supply of lemonade,as shown in Figure 7-6.The result is a rise in the price of lemonade and a decline inconsumer surplus from D + E + F to just D, a loss of E + F. Note that an event that affectsconsumer surplus in one market often has effects on consumer surplus in other markets.Figure 7-62. A rise in the demand for French bread leads to an increase in producer surplus in themarket for French bread, as shown in Figure 7-7.The shift of the demand curve leads to an increased price, which increases producer surplus from area A to area A + B + C.Figure 7-7The increased quantity of French bread being sold increases the demand for flour, asshown in Figure 7-8.As a result, the price of flour rises, increasing producer surplusfrom area D to D + E + F. Note that an event that affects producer surplus in onemarket leads to effects on producer surplus in related markets.Figure 7-83. a.Bert’ s demand schedule is:Price Quantity DemandedMore than $7 0$5 to $7 1$3 to $5 2$1 to $3 3$1 or less 4Bert’ s demand curve is shown in Figure 7 -9.Figure 7-9b.When the price of a bottle of water is $4, Bert buys two bottles of water.Hisconsumer surplus is shown as area A in the figure.He values his first bottle ofwater at $7, but pays only $4 for it, so has consumer surplus of $3.He valueshis second bottle of water at $5, but pays only $4 for it, so has consumersurplus of $1.Thus Bert’ s total consumer surplus is $3 + $1 = $4, which isthe area of A in the figure.c.When the price of a bottle of water falls from $4 to $2, Bert buys three bottlesof water, an increase of one. His consumer surplus consists of both areas Aand B in the figure, an increase in the amount of area B. He gets consumersurplus of $5 from the first bottle ($7 value minus $2 price), $3 from thesecond bottle ($5 value minus $2 price), and $1 from the third bottle ($3 valueminus $2 price), for a total consumer surplus of $9. Thus consumer surplusrises by $5 (which is the size of area B) when the price of a bottle of water fallsfrom $4 to $2.4. a. Ernie ’ s supply schedule for water is:Price Quantity SuppliedMore than $7 4$5 to $7 3$3 to $5 2$1 to $3 1Less than $1 0Ernie’ s supply curve is shown in Figure 7 -10.Figure 7-10b.When the price of a bottle of water is $4, Ernie sells two bottles of water.Hisproducer surplus is shown as area A in the figure.He receives $4 for his firstbottle of water, but it costs only $1 to produce, so Ernie has producer surplusof $3.He also receives $4 for his second bottle of water, which costs $3 toproduce, so he has producer surplus of$1. Thus Ernie’ s total producersurplus is $3 + $1 = $4, which is the area of A in the figure.c.When the price of a bottle of water rises from $4 to $6, Ernie sells three bottlesof water, an increase of one.His producer surplus consists of both areas Aand B in the figure, an increase by the amount of area B.He gets producersurplus of $5 from the first bottle ($6 price minus $1 cost), $3 from the secondbottle ($6 price minus $3 cost), and $1 from the third bottle ($6 price minus $5price), for a total producer surplus of $9.Thus producer surplus rises by $5(which is the size of area B) when the price of a bottle of water rises from $4to $6.5. a. From Ernie ’ s supply schedule and Bert ’ s demand schedule, the quantitydemanded and supplied are:Price Quantity Supplied Quantity Demanded$ 2 1 34 2 26 3 1Only a price of $4 brings supply and demand into equilibrium, withan equilibrium quantity of 2.b.At a price of $4, consumer surplus is $4 and producer surplus is $4, as shownin problems 3 and 4.Total surplus is $4 + $4 = $8.c.If Ernie produced one fewer bottle, his producer surplus would decline to $3,as shown in problem 4.If Bert consumed one fewer bottle, his consumersurplus would decline to $3, as shown in problem 3. So total surplus would declineto $3 + $3 = $6.d.If Ernie produced one additional bottle of water, his cost would be $5, but theprice is only $4, so his producer surplus would decline by $1.If Bertconsumed one additional bottle of water, his value would be $3, but the priceis $4, so his consumer surplus would decline by $1.So total surplus declinesby $1 + $1 = $2.6. a.The effect of falling production costs in the market for stereos results in a shiftto the right in the supply curve, as shown in Figure 7-11.As a result, theequilibrium price of stereos declines and the equilibrium quantity increases.b.The decline in the price of stereos increases consumer surplus from area A to A+ B + C + D, an increase in the amount B + C + D.Prior to the shift in supply,producer surplus was areas B + E (the area above the supply curve and belowthe price).After the shift in supply, producer surplus is areas E + F + G.Soproducer surplus changes by the amount F + G - B, which may be positive ornegative.The increase in quantity increases producer surplus, while thedecline in the price reduces producer surplus.Since consumer surplus risesby B + C + D and producer surplus rises by F + G - B, total surplus rises by C+ D+F+G.c.If the supply of stereos is very elastic, then the shift of the supply curvebenefits consumers most.To take the most dramatic case, suppose thesupply curve were horizontal, as shown in Figure 7-12.Then there is noproducer surplus at all.Consumers capture all the benefits of fallingproduction costs, with consumer surplus rising from area A to area A + B.Figure 7-11Figure 7-127. Figure 7-13 shows supply and demand curves for haircuts. Supply equals demand ata quantity of three haircuts and a price between $4 and $5. Firms A, C, and D shouldcut the hair of Sally Jessy, Jerry, and Montel. Oprah ’ s willingness to pay is too low and firm B ’ s costs are too high, so they do not participate. The maximum total surplus isthe area between the demand and supply curves, which totals $11 ($8 value minus$2 cost for the first haircut, plus $7 value minus $3 cost for the second, plus $5 valueminus $4 cost for the third).Figure 7-138. a.The effect of falling production costs in the market for computers results in ashift to the right in the supply curve, as shown in Figure 7-14.As a result, theequilibrium price of computers declines and the equilibrium quantity increases.The decline in the price of computers increases consumer surplus from area Ato A + B + C + D, an increase in the amount B + C + D.Figure 7-14Prior to the shift in supply, producer surplus was areas B + E (the area abovethe supply curve and below the price).After the shift in supply, producersurplus is areas E + F + G.So producer surplus changes by the amount F + G- B, which may be positive or negative.The increase in quantity increasesproducer surplus, while the decline in the price reduces producer surplus. Sinceconsumer surplus rises by B + C + D and producer surplus rises by F + G - B,total surplus rises by C + D + F + G.——Figure 7-15b.Since adding machines are substitutes for computers, the decline in the priceof computers means that people substitute computers for adding machines,shifting the demand for adding machines to the left, as shown in Figure 7-15.The result is a decline in both the equilibrium price and equilibrium quantity ofadding machines.Consumer surplus in the adding-machine market changesfrom area A + B to A + C, a net gain of C - B.Producer surplus changes fromarea C + D + E to area E, a net loss of C + D.Adding machine producers aresad about technological advance in computers because their producersurplus declines.c.Since software and computers are complements, the decline in the price andincrease in the quantity of computers means that people’ s demand forsoftware increases, shifting the demand for software to the right, as shown inFigure 7-16. The result is an increase in both the price and quantity of software.Consumer surplus in the software market changes from B + C to A+B, a net increase of A - C. Producer surplus changes from E to C + D + E, anincrease of C + D, so software producers should be happy about the technologicalprogress in computers.d.Yes, this analysis helps explain why Bill Gates is one the world’ s richest msince his company produces a lot of software that’ s a complement withcomputers and there has been tremendous technological advance incomputers.——Figure 7-169. a. Figure 7-17 illustrates the demand for medical care. If each procedure has aprice of $100, quantity demanded will be Q 1 procedures.Figure 7-17b.If consumers pay only $20 per procedure, the quantity demanded will be Q 2procedures.Since the cost to society is $100, the number of proceduresperformed is too large to maximize total surplus.The quantity thatmaximizes total surplus is Q 1 procedures, which is less than Q2.c.The use of medical care is excessive in the sense that consumers getprocedures whose value is less than the cost of producing them.As a result,——the economy’ s total surplus is reduced.d.To prevent this excessive use, the consumer must bear the marginal cost ofthe procedure.But this would require eliminating insurance.Anotherpossibility would be that the insurance company, which pays most of themarginal cost of the procedure ($80, in this case) could decide whether theprocedure should be performed.But the insurance company doesn’ t get thebenefits of the procedure, so its decisions may not reflect the value to theconsumer.10. a. Figure 7-18 illustrates the effect of the drought. The supply curve shifts tothe left, leading to a rise in the equilibrium price from P 1 to P 2 and a decline inthe equilibrium quantity from Q 1 to Q 2 .Figure 7-18b.If the price of water is not allowed to change, there will be an excess demandfor water, with the shortage shown on the figure as the difference between Q 1and Q 3 .c.The system for allocating water is inefficient because it no longer allocateswater to those who value it most highly.Some people who value water atmore than its cost of production will be unable to obtain it, so societysurplus isn’ t maximized.The allocation system seems unfair as well.Water is allocated simply on pastusage, rewarding past wastefulness.If a family’ s demand for water increases,——say because of an increase in family size, the policy doesn ’ t allow them to obtain more water. Poor families, who probably used water mostly fornecessary uses like drinking, would suffer more than wealthier families whowould have to cut back only on luxury uses of water like operating backyardfountains and pools. However, the policy also keeps the price of water lower,which benefits poor families, since otherwise more of their family budgetwould have to go for water.d. If the city allowed the price of water to rise to its equilibrium price P 2 , theallocation would be more efficient. Quantity supplied would equal quantitydemanded and there would be no shortage. Total surplus would bemaximized.Whether the market allocation would be more or less fair than theproportionate reduction in water under the old policy is difficult to say, but it islikely to be more fair. Notice that the quantity supplied would be higher (Q 2)in this case than under the water restrictions (Q 3 ), so there ’ s less reduction inwater usage. To make the market solution even more fair, the governmentcould provide increased tax relief or welfare payments for poor families whosuffer from paying the higher water prices.。
曼昆版经济学原理第七版课后题及答
1下列每种交易会影响CDP的哪一部分(如果有影响的话)?并解释之。
A.家庭购买了一台新冰箱。
答:家庭购买了一台新冰箱会增加GDP中的消费(C)部分,因为家庭用于家用电器的支出计算在消费的耐用品类中。
B.杰妮姑妈买了一所新房子。
答:杰妮姑妈买了一所新房子会增加GDP中的投资(1)部分,因为家庭住宅能长期供人居住,提供服务。
它比一般耐用消费品的使用寿命更长,因此把住宅房屋的投资计算在投资中。
C.福特汽车公司由其存货中出售了一部雷鸟牌汽车。
答:福利汽车公司由其存货中出售了一部雷鸟牌汽车会减少现期GDP中的投资,因为销售中间物品存货时,企业的存货投资是负的,因而减少了当期的GDP。
C.你买了一个比萨饼。
答:我买了一个比萨饼会增加GDP中的消费(C),因为我用于购买食品的支出计算在消费的非耐用品类中。
D.加利福尼亚重新铺设了101号高速公路。
答:加利福尼亚重新铺设了101号高速公路增加了GDP中的政府购买(G),因为修建高速公路是政府的行为。
E.你的父母购买了一瓶xx红酒。
答:我的父母购买了一瓶法国红酒会减少GDP中的净出口(NX),因为法国红酒是进口食品,它的购买增加了美国的进口。
F.本田公司扩大其在俄亥俄州马利斯维尔的工厂。
答:本田公司扩大其在俄亥俄州马利斯维尔的工厂增加了GDP中的净出口(NX),因为本田公司是一家日本企业,它在美国的投资减少了美国对日本本田汽车的进口,使NX增加2.GDP组成部分中的“政府购买”并不包括用于社会保障这类转移支付的支出。
想想GDP的定义,解释为什么转移支付不包括在政府购买内?答:因为转移支付并不是要交换现在生产的物品或劳务,从宏观经济的角度看,转移支付就像税收和回扣一样。
转移支付和税收一样改变了家庭收入,但并没有反映经济的生产。
由于GDP是要衡量在某一既定时期一个国家从物品与劳务的生产中得到的收入,所以,不把转移支付包括在政府购买内。
6.考虑以下xxGDP的数据:A.1996年到1997年间名义收入增长率是多少?(注意:增长率是一个时期到下一个时期百分比的变动。
曼昆《经济学原理(微观经济学分册)》(第7版)课后习题详解
曼昆《经济学原理(微观经济学分册)》(第7版)课后习题详解第1章经济学十大原理一、概念题1.稀缺性(scarcity)答:经济学研究的问题和经济物品都是以稀缺性为前提的。
稀缺性指在给定的时间内,相对于人的需求而言,经济资源的供给总是不足的,也就是资源的有用性与有限性。
人类消费各种物品的欲望是无限的,满足这种欲望的物品,有的可以不付出任何代价而随意取得,称之为自由物品,如阳光和空气;但绝大多数物品是不能自由取用的,因为世界上的资源(包括物质资源和人力资源)是有限的,这种有限的、为获取它必须付出某种代价的物品,称为“经济物品”。
正因为稀缺性的客观存在,地球上就存在着资源的有限性和人类的欲望与需求的无限性之间的矛盾。
经济学的一个重要研究任务就是:“研究人们如何进行抉择,以便使用稀缺的或有限的生产性资源(土地、劳动、资本品如机器、技术知识)来生产各种商品,并把它们分配给不同的社会成员进行消费。
”也就是从经济学角度来研究使用有限的资源来生产什么、如何生产和为谁生产的问题。
2.经济学(economics)答:经济学是研究如何将稀缺的资源有效地配置给相互竞争的用途,以使人类的欲望得到最大限度满足的科学。
时下经常见诸国内报刊文献的“现代西方经济学”一词,大多也都在这个意义上使用。
自从凯恩斯的名著《就业、利息和货币通论》于1936年发表之后,西方经济学界对经济学的研究便分为两个部分:微观经济学与宏观经济学。
微观经济学是以单个经济主体(作为消费者的单个家庭或个人,作为生产者的单个厂商或企业,以及单个产品或生产要素市场)为研究对象,研究单个经济主体面对既定的资源约束时如何进行选择的科学。
宏观经济学则以整个国民经济为研究对象,主要着眼于对经济总量的研究。
3.效率(efficiency)答:效率指人们在实践活动中的产出与投入之比值,或者是效益与成本之比值,如果比值大,效率就高;反之,比值小,效率就低。
效率与产出或者收益的大小成正比,而与成本或投入成反比,也就是说,如果想提高效率,必须降低成本或投入,提高收益或产出。
- 1、下载文档前请自行甄别文档内容的完整性,平台不提供额外的编辑、内容补充、找答案等附加服务。
- 2、"仅部分预览"的文档,不可在线预览部分如存在完整性等问题,可反馈申请退款(可完整预览的文档不适用该条件!)。
- 3、如文档侵犯您的权益,请联系客服反馈,我们会尽快为您处理(人工客服工作时间:9:00-18:30)。
收入效应
替代效应
总效应
消费
增加
增加
收入效应>替代效应时,闲暇增加,工作减少,工资上升导致劳动供给减少,右下方倾斜
收入效应<替代效应时,闲暇减少,工作增加,工资上升导致劳动供给增加,右上方倾斜
闲暇
增加
减少
劳动供给曲线
右下方
右上方
复习题
1.某消费者收入为3000美元。一杯红酒3美元,一磅奶酪6美元。画出该消费者的预算约束线。这条预算约束线的斜率是多少?
即
关系
Clair
6
=
6
Phil
6
>
3
Alex
3
=
3
Haley
6
>
3/2
Luke
3
<
6
根据边际效用递减规律,减少消费,其边际效用会增加。
斜率是-2(很多人漏掉负号。)
3.你只消费苏打水和比萨饼。有一天,苏打水的价格上升了,比萨饼的价格下降了,而且,你与价格变动以前的满足程度相同。
a.用图形说明这种情况。
b.你对这两种物品的消费量会如何变动?你的反应如何取决于收入效应和替代效应?
c.你能买得起价格变动前你消费的苏打水和比萨饼的组合吗?
吉芬商品
价格升高,需增加
反方向
同方向
同方向
右上方
8.考虑你关于工作多少小时的决策。
a.画出假设你的收入不纳税时的预算约束线。在同一个图上,画出假设纳15%个人所得税时的预算约束线。
b.说明税收如何引起工作时数增加、减少或不变。解释原因。
税收增加上升
收入效应
替代效应
总效应
消费
减少
减少
收入效应>替代效应时,闲暇减少;
第21章 消费者选择理论
1. Emilio购买价格为10美元的比萨饼和价格为2美元的苏打水。他的收入为100美元。如果以下哪一个事件出现,他的预算约束线就会平行向外移动?
A.比萨饼的价格下降到5美元,苏打水大学价格下降到1美元,而他的收入减少为50美元。
B.比萨饼的价格上升到20美元,苏打水大学价格上升到4美元,而他的收入仍保持不变。
2.在无差异曲线上任何一点,该曲线的斜率衡量消费者的__________.
A.收入
B.用一种物品换另一种物品的意愿
C.对两种物品是替代品还是互补品的认知
D.需求弹性
【答案】B
【解析】无差异曲线的斜率是边际替代率。
3. Mathew和Susan是衬衫和帽子市场上的两个追求最优化的消费者,他们用100美元买一件衬衫,用50美元买一顶帽子。Mathew买了4件衬衫和6顶帽子,而Susan买了6件衬衫和12顶帽子。从这些信息,我们推断,Mathew的边际替代率是每件衬衫__________顶帽子,而Susan是每件衬衫_______顶帽子。
通心粉价格上升
收入效应
替代效应
总效应
通心粉
(低档物品)
增加
减少
收入效应>替代效应时,销售量增加
其它
(正常物品)
减少
增加
6.在哪种情况下,劳动供给曲线向上方倾斜____D______.
A.闲暇是正常物品
B.消费是正常物品
C.对闲暇的收入效应大于替代效应
D.对闲暇的替代效应大于收入效应
【答案】D
【解析】
A.通心粉是正常物品,而且收入效用大于替代效应
B.通心粉是正常物品,而且替代效应大于收入效用
C.通心粉是低档物品,而且收入效用大于替代效应
D.通心粉是低档物品,而且替代效应大于收入效用
【答案】C
【解析】首先,排除A和B.
通心粉价格上升而消费者购买更多通心粉,说明该需求曲线向右上方移动,是吉芬物品,则收入效应大于替代效应。
6.说明下面每一种说法正确还是错误。解释你的答案。
a.“所有的吉芬物品都是低档物品。”
b.“所有的低档物品都是吉芬物品。”
定义
替代效应与价格
收入效应与价格
总效应与价格
需求需求形状
正常商品
价格升高,需求减少;收入增加,需求增加。
反方向
反方向
反方向
右下方
低档商品
低档
收入增加,需求减少
反方向
同方向
反方向
右下方
C.比萨饼的价格下降到8美元,苏打水大学价格下降到1美元,而他的收入增加为120美元。
D.比萨饼的价格上升到20美元,苏打水大学价格上升到4美元,而他的收入增加到400美元。
【答案】D
【解析】预算约束线:10x+2y=100
对于A:5x+y=50,此预算线和原预算线是同一条曲线。
对于D:20x+4y=400,预算线平行向外移动。
A.两种物品都更少
B.牛奶更多,早餐麦片更少
C.牛奶更少,早餐麦片更多
D.牛奶更少,但对早餐麦片的影响并不清楚
【答案】C
【解析】分析收入效应和替代效应的综合影响。
牛奶价格上升
收入效应
替代效应
总效应
牛奶(正常物品)
减少
减少
减少早Leabharlann 麦片(低档物品)增加增加
增加
5.如果通心粉价格上升而消费者购买更多通心粉,我们就可以推断:
A.2,1
B.2,2
C.4,1
D.4, 2
【答案】B
【解析】无差异曲线的斜率是边际替代率。MRS=MUx/MUy=Px/Py.
对于两个消费者,其预算线分别是100x+5y=700;100x+5y=1200。
4. Charlie只购买牛奶和早餐麦片,牛奶是正常物品,而早餐麦片是低档物品,当牛奶价格上升时,Charlie购买的__________.
收入效应<替代效应时,闲暇增加;
收入效应=替代效应时,闲暇不变。
闲暇
减少
增加
13.五个消费者有以下苹果和梨的边际效用:
苹果的边际效用
梨的边际效用
Clair
6
12
Phil
6
6
Alex
3
6
Haley
6
3
Luke
3
12
每个梨的价格是2美元,每个苹果的价格是1美元。如果有的话,这些消费者最优的水果选择是哪一个?对那些没有最优选择的人,他们如何改变自己的支出?