江西(2009年)国民经济和社会发展统计公报
地区旅游环境分析_以江西省为例
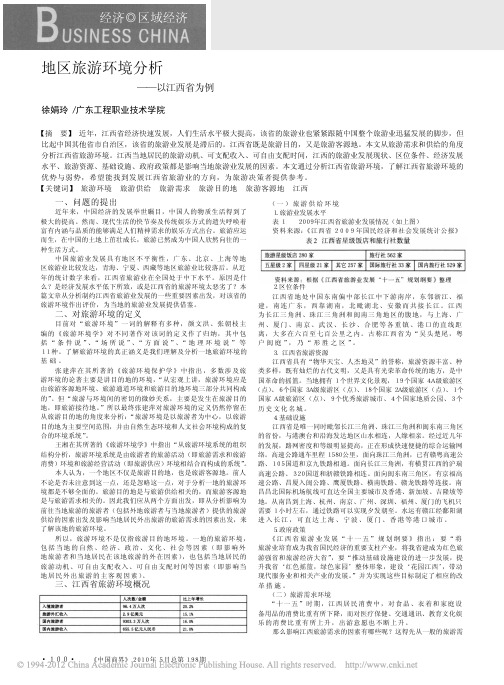
·100·《中国商界》2010年5月总第198期一、问题的提出近年来,中国经济的发展举世瞩目,中国人的物质生活得到了极大的提高。
然而、现代生活的快节奏及传统娱乐方式的遗失呼唤着富有内涵与品质的能够满足人们精神需求的娱乐方式出台。
旅游应运而生,在中国的土地上茁壮成长,旅游已然成为中国人欣然向往的一种生活方式。
中国旅游业发展具有地区不平衡性,广东、北京、上海等地区旅游业比较发达,青海、宁夏、西藏等地区旅游业比较落后。
从近年的统计数字来看,江西省旅游业在全国处于中下水平。
原因是什么?是经济发展水平低下所致,或是江西省的旅游环境太恶劣了?本篇文章从分析制约江西省旅游业发展的一些重要因素出发,对该省的旅游环境作出评价,为当地的旅游业发展提供借鉴。
二、对旅游环境的定义目前对“旅游环境”一词的解释有多种,颜文洪、张朝枝主编的《旅游环境学》对不同著作对该词的定义作了归纳,其中包括“条件说”、“场所说”、“方面说”、“地理环境说”等11种。
了解旅游环境的真正涵义是我们理解及分析一地旅游环境的基础。
张建萍在其所著的《旅游环境保护学》中指出,多数涉及旅游环境的论著主要是讲目的地的环境,“从宏观上讲,旅游环境应是由旅游客源地环境、旅游通道环境和旅游目的地环境三部分共同构成的”。
但“旅游与环境间的密切的微妙关系,主要是发生在旅游目的地,即旅游接待地。
”所以最终张建萍对旅游环境的定义仍然停留在从旅游目的地的角度来分析:“旅游环境是以旅游者为中心,以旅游目的地为主要空间范围,并由自然生态环境和人文社会环境构成的复合的环境系统”。
王湘在其所著的《旅游环境学》中指出“从旅游环境系统的组织结构分析,旅游环境系统是由旅游者的旅游活动(即旅游需求和旅游消费)环境和旅游经营活动(即旅游供应)环境相结合而构成的系统”。
本人认为,一个地区不仅是旅游目的地,也是旅游客源地。
前人不论是否未注意到这一点,还是忽略这一点,对于分析一地的旅游环境都是不够全面的。
中华人民共和国2009年国民经济和社会发展统计公报(英文)

Statistical Communiqué of the People's Republic of China on the 2009 National Economic and Social DevelopmentNational Bureau of Statistics of ChinaFebruary 25, 2010In 2009, under the leadership of the CPC Central Committee and the State Council, the people of all nationalities of China, taking as the guidance of Deng Xiaoping Theory and the important thought of “Three Represents”, implemented earnestly the scientific approach to the economic and social development, carefully put into effect the proactive fiscal policy and moderately easy monetary policy, carried out the package of plans and policies aiming at dealing with the international financial crisis in an all round way, national economic performance recovered and posed to the good direction and all social undertakings achieved new progress.I. General OutlookIn 2009, the gross domestic product (GDP) of the year was 33,535.3 billion yuan, up by 8.7 percent over the previous year. Analyzed by different industries, the value added of the primary industry was 3,547.7 billion yuan, up by 4.2 percent, that of the secondary industry was 15,695.8 billion yuan, up by 9.5 percent and the tertiary industry was 14,291.8 billion yuan, up by 8.9 percent. The value added of the primary industry accounted for 10.6 percent of the GDP, dropped by 0.1 percentage point over that in the pervious year, that of the secondary industry accounted for 46.8 percent, down by 0.7 percentage point, and that of the tertiary industry accounted for 42.6 percent, up by 0.8 percentage point.The general level of consumer prices in China was down by 0.7 percent over the previous year. Of this total, the prices for food went up by 0.7 percent. The prices for investment in fixed assets were down by 2.4 percent. The producer prices for manufactured goods dropped by 5.4 percent, of which, the prices for means of production down by 6.7 percent, and for means of subsistence decreased by 1.2 percent. The purchasing prices for raw materials, fuels and power went down by 7.9 percent. The producer prices for farm products were down by 2.4 percent. The prices for means of agricultural production were down by 2.5 percent. The sales prices for housing in 70 large andmedium-sized cities were up by 1.5 percent, of which, that for new residential buildings went up by 1.3 percent, for second hand housing grew by 2.4 percent, and the prices for rental and leasing were down by 0.6 percent.Table 1: General Level of Consumer Prices in 2009Unit: % Item NationalAverage Urban Rural General level of consumer prices -0.7 -0.9 -0.3 Food 0.7 1.0 0.1 Of Which: Grain 5.6 5.7 5.5 Meat, poultry and related products -8.7 -8.5 -9.2Oil -18.3 -17.9 -18.8Fresh eggs 1.5 1.3 2.0Fresh vegetables 15.4 15.0 16.7Fresh fruits 9.1 9.0 9.5 Tobaccos and alcohols 1.5 1.7 1.3 Clothing -2.0 -2.2 -1.6 Household appliances and services 0.2 0.3 0.0 Medical, health and personal articles 1.2 1.1 1.5 Transportation and telecommunications -2.4 -2.7 -1.8-0.7 -1.2 0.6 Recreational, educational, cultural articles andservicesHousing -3.6 -4.6 -1.5At the end of 2009, the total of employed people in China numbered 779.95 million, 5.15 million more than that of 2008. Of this total, 311.20 million were employed in urban areas, a net increase of 9.10 million, a newly increase of 11.02 million. The urban unemployment rate through unemployment registration was 4.3 percent at the end of 2009, an increase of 0.1 percentage point over that of 2008.At the end of 2009, China’s foreign exchange reserves reached 2,399.2 billion US dollars, an increase of 453.1 billion US dollars as compared with that at the end of the pervious year. At the end of the year, the exchange rate was 6.8282 RMB to 1 USD, an appreciation by 0.1 percent over that at the end of 2008.In 2009, the total fiscal revenue reached 6,847.7 billion yuan, up by 11.7 percent or an increase of 714.7 billion yuan over that in the previous year. Of this total, the taxes collected in the whole year reached 5,951.5 billion yuan, up by 9.8 percent or an increase of 529.1 billion yuan over 2008.II. AgricultureIn 2009, the sown area of grain was 108.97 million hectares, an increase of 2.17 million hectares as compared with that in the previous year; the sown area of cotton was 4.95 million hectares, a decline of 800 thousand hectares; the sown area of oil-bearing crops was 13.60 million hectares, an increase of 760 thousand hectares; the sown area of sugar crops was 1.88 million hectares, a drop of 110 thousand hectares.The total output of grain in 2009 was 530.82 million tons, an increase of 2.11 million tons or up by 0.4 percent over the previous year. Of this total, the output of summer crops was 123.35 million tons, up by 2.2 percent, and that of theearly rice was 33.27 million tons, up by 5.3 percent over the previous year. The output of autumn grain was 374.20 million tons, a drop of 0.6 percent.In 2009, the output of cotton was 6.40 million tons, a decrease of 14.6 percent over the previous year, that of oil-bearing crops was 31.00 million tons, up by 5.0 percent and that of sugar crops was 122.00 million tons, a drop of 9.1 percent, that of tobacco was 2.80 million tons, up by 6.7 percent, and that of tea was 1.35 million tons, up by 7.1 percent.The total output of meat for the year reached 76.42 million tons, up by 5.0 percent. Of this total, the output of pork was 48.89 million tons, up by 5.8 percent, and that of beef and mutton was 6.36 and 3.89 million tons, up by 3.6 percent and 2.4 percent respectively. At the end of the year, 469.85 million pigs are registered in the total stocks, up by 1.5 percent, and 645.07 million pigs are slaughtered, up by 5.7 percent. The production of milk was 35.18 million tons, down by 1.1 percent; the total output of eggs was 27.41 million tons, up by 1.4 percent.The total output of aquatic products was 51.20 million tons, up by 4.6 percent. Of this total, the output of cultured aquatic products was 36.35 million tons, up by 6.5 percent; and that of fished aquatic products was 14.85 million tons, up by 0.1 percent over the previous year.The total production of timber for the year 2009 reached 69.38 million cubic meters, a drop of 14.4 percent.Over 1.471 million hectares of farmland was increased with effective irrigation systems and another additional 1.826 million hectares of farmland was guaranteed by water-saving irrigation systems.III. Industry and ConstructionIn 2009, the total value added of the industrial sector was 13,462.5 billion yuan, up by 8.3 percent over the previous year. The value added of industrial enterprises above the designated size was up by 11.0 percent. Of this total, thatof the state-owned and state-holding enterprises grew by 6.9 percent, that of the collective enterprises went up by 10.2 percent, that of the share-holding enterprises increased by 13.3 percent, that of the enterprises by foreign investors and investors from Hong Kong, Macao and Taiwan soared by 6.2 percent and 18.7 percent growth for private enterprises. Analyzed by light and heavy industries, the growth of the light industry was 9.7 percent and that of the heavy industry was 11.5 percent.In 2009, of the industrial enterprises above designated size, the growth of value added for the mining and washing of coal industry was 8.3 percent over the previous year; for the extraction of petroleum and natural gas was 4.8 percent; for processing of food from agricultural product 15.9 percent; for textile industry 8.5 percent; for manufacture of general machinery 11.0 percent; for manufacture of special purpose machinery 13.0 percent; for manufacture of transport equipment 18.4 percent, of which, 20.3 percent for automobile manufacturing, and 20.7 percent for ship manufacturing; for manufacture of communication equipment, computers and other electronic equipment 5.3 percent and for manufacture of electrical machinery and equipment 12.0 percent. The growth of the value added for the major six high energy consuming industries were 10.6 percent, of which, that of the manufacture of non-metallic mineral products was 14.7 percent, manufacture of raw chemical materials and chemical products 14.6 percent, smelting and pressing of ferrous metals 12.8 percent, smelting and pressing of non-ferrous metals 9.9 percent, production and supply of electric power and heat power 6.0 percent and 5.2 percent for processing of petroleum, coking, processing of nuclear fuel. The value added growth for the high-tech industry was 7.7 percent over the previous year.Table 2: Output of Major Industrial Products and the Growth Rates in 2009Product Unit Output Increaseover2008 (%) Yarn10000 tons2393.5 12.7Cloth100 million meters740.0 4.2 Chemical fibers10000 tons2730.0 13.0Sugar (final product)10000 tons1321.2 -8.9 Cigarettes100 million22901.5 3.2Color TV sets100009898.8 9.6 Of which: LCD TV sets100006765.3 85.2 Household refrigerators 10000 5930.5 24.7 Room air conditioners 100008078.2 -1.9Total primary energy production100 million tons of28.0 5.8standard coal equivalentCoal100 million tons30.50 8.8Crude oil100 million tons 1.89 -3.1Natural gas100 million cubic851.7 6.1metersElectricity100 million 37146.5 6.3The profits made by the industrial enterprises above the designated size in the first 11 months of 2009 were 2,589.1 billion yuan, an increase of 7.8 percent over the same period of last year.Table 3: Profits and Growth of Industrial Enterprises above the DesignatedSize in the First Eleven Months of 2009Unit: 100million yuansame periodlast year (%) Industrial enterprises above designated size 25891 7.8Of which: State-owned and state-holding7514 -4.5enterprisesOf which: Collective enterprises 545 10.3 Share-holding enterprises 13890 4.2 Enterprises by foreign investors or7511 16.9 investors from Hong Kong, Macaoand TaiwanOf which: Private enterprises 6849 17.4In 2009, the value added of construction enterprises in China was 2,233.3 billion yuan, up by 18.2 percent over the previous year. The profits made by construction enterprises qualified for general contracts and specialized contracts reached 266.3 billion yuan, up by 21.0 percent, of which the profits made by the state-owned and state-holding enterprises were 69.7 billion yuan, up by 23.9 percent.IV. Investment in Fixed AssetsThe completed investment in fixed assets of the country in 2009 was 22,484.6 billion yuan, up by 30.1 percent over the previous year. Of the total investment, that in urban areas was 19,413.9 billon yuan, up by 30.5 percent; and that in rural areas reached 3,070.7 billion yuan, up by 27.5 percent. An analysis by regions showed that the investment in eastern areas was 9,565.3 billion yuan, up by 23.0 percent over the previous year, in central areas was 4,984.6 billion yuan, a growth of 35.8 percent, in western areas 4,966.2 billion yuan, a growth of 38.1 percent, and in northeastern areas 2,373.3 billion yuan, up by 26.8 percent.In the urban areas, the investment in the primary industry was 337.3 billion yuan, up by 49.9 percent; that in the secondary industry was 8,227.7 billion yuan, up by 26.8 percent; and that in the tertiary industry was 10,848.9 billion yuan, up by 33.0 percent.Table 4: Fixed Assets Investment in Urban Areas and Its Growth by Sector in 2009Unit: 100 million yuanTable 5: Newly Increased Production Capacity through Fixed Assets Investment in2009In 2009, the investment in real estate development was 3,623.2 billion yuan, up by 16.1 percent. Of this total, the investment in commercial residential buildings reached 2,561.9 billion yuan, an increase of 14.2 percent, that in office buildings was 137.8 billion yuan, up by 18.1 percent, and that in buildings for commercial business was 417.2 billion yuan, up by 24.4 percent.Table 6: Main Indicators for Real Estate Development and Sales in 2009V. Domestic TradeIn 2009, the total retail sales of consumer goods reached 12,534.3 billion yuan, up by 15.5 percent over the previous year. An analysis on different areas showed that the retail sales of consumer goods in cities reached 8,513.3 billion yuan, up by 15.5 percent and the retail sales of consumer goods at and below county level was 4,021.0 billion yuan, up by 15.7 percent. Analyzed by different sectors, the sales of the wholesales and retail trade reached 10,541.3 billion yuan, up 15.6 percent; the sales of the lodging and catering industry was 1,799.8 billion yuan, up 16.8 percent, and the sales of the other industries was 193.2 billion yuan, up 2.5 percent.Of the total retail sales by wholesale and retail enterprises above designated size, the year-on-year growth of sales for motor vehicles was 32.3 percent, that for grain and oil was 13.0 percent, for meat and eggs 8.3 percent, for clothing 20.8 percent, for daily necessities 15.6 percent, for cultural and office goods 6.7 percent. The sales of telecommunication equipment dropped by 1.3 percent. Theyear-on-year growth of sales for cosmetics 16.9 percent, for gold, silver and jewelry 15.9 percent, for traditional Chinese drugs and western drugs 21.7 percent, for electric and electronic appliances for household use and audio-video equipment 12.3 percent, for furniture 35.5 percent and building and decoration materials 26.6 percent.VI. Foreign Economic RelationsThe total value of imports and exports in 2009 reached 2,207.2 billion US dollars, down by 13.9 percent over the previous year. Of this total, the value of goods export was 1,201.7 billion US dollars, down by 16.0 percent, and the value of goods import was 1,005.6 billion US dollars, down by 11.2 percent. The balance of imports and exports was (exports minus imports) 196.1 billion US dollars, a decrease of 102.0 billion US dollars over the previous year.Table 7: Total Value of Imports and Exports and the Growth Rates in 2009Unit: 100 million USDTable 8: Main Export Commodities in Volume and Value and the Growth Rates in2009Table 9: Main Import Commodities in Volume and Value and the Growth Rates in2009Table 10: Imports and Exports by Major Countries and Regions and the GrowthRates in 2009Unit: 100 million USDThe year 2009 witnessed the establishment of 23,435 enterprises with foreign direct investment in non-financial sectors, down by 14.8 percent; and the foreign capital actually utilized was 90.0 billion US dollars, down by 2.6 percent. Of the total foreign direct investment actually utilized, the share of investment in manufacturing was 52.0 percent over the pervious year, the real estate 18.7 percent, leasing and business service 6.8 percent, wholesales and retail trade 6.0 percent and transportation, storage and post service 2.8 percent.Table 11: Total Value of Foreign Direct Investment and the Growth Rates in 2009In 2009, the overseas direct investment (non-financial sectors) by Chinese investors was 43.3 billion US dollars, up by 6.5 percent over the previous year. In 2009, the accomplished business revenue through contracted overseas engineering projects was 77.7 billion US dollars, up by 37.3 percent, and the business revenue through overseas labor contracts was 8.9 billion US dollars, up by 10.6 percent over the previous year.VII. Transportation, Post, Telecommunications and TourismThe value added of the transportation, storage, post and telecommunication sectors reached 1,705.8 billion yuan in 2009, up 3.7 percent over the previous year.Table 12: Freight Traffic by All Means of Transportation and the Growth Ratesin 2009Table 13: Passenger Traffic by All Means of Transportation and the GrowthRates in 2009Waterways 100 million persons 2.2 2.9 Civil aviation 100 million persons 2.3 19.7Passenger flows 100 million24773.6 6.8person-kilometersRailways 100 million7878.9 1.3person-kilometersHighways 100 million13450.7 7.8person-kilometersWaterways 100 million69.1 5.8person-kilometersCivil aviation 100 million3374.9 17.1person-kilometersThe volume of freight handled by ports above the designated size throughout the year totaled 6.91 billion tons, up 8.2 percent over the previous year, of which freight for foreign trade was 2.14 billion tons, up 8.6 percent. Container shipping handled 120.82 million standard containers, down by 5.8 percent. The total number of motor vehicles for civilian use reached 76.19 million (including 13.31 million tri-wheel motor vehicles and low-speed trucks) by the end of 2009, up 17.8 percent, of which private-owned vehicles numbered 52.18 million, up 25.0 percent. The total number of cars for civilian use stood at 31.36 million, up by 28.6 percent, of which private-owned cars numbered 26.05 million, up by 33.8 percent.The turnover of post and telecommunication services totaled 2,731.3 billion yuan, up 14.6 percent over the previous year. Of this total, post services accounted for 163.2 billion yuan, up 16.4 percent, and telecommunication services 2,568.1 billion yuan, up 14.4 percent. By the end of 2009, with a decrease of 16.44 million lines of office switchboards, the total capacity stood at 492.19 million lines. The newly increased capacity of mobile phone switchboard was 275.80 million lines with the total capacity reaching 1,421.11 million lines. The year also saw 313.69 million fixed telephone subscribers. This included 211.78 million urban subscribers and 101.91 million rural subscribers. Mobile phone users numbered 747.38 million by the end of 2009, with 106.14 million new subscribers in the year. In total, the number of fixed and mobile phone users reached 1,061.07 million, an increase of 79.47 million as compared with that at the end of 2008. Phone coverage is 79.9 sets per 100 persons. The number of Internet users was 380 million, of which wide-band users were 350 million, and the coverage rate of Internet was 28.9 percent.The year 2009 saw 1.90 billion domestic tourists, up 11.1 percent over the previous year. The revenue from domestic tourism totaled 1,018.4 billion yuan, up 16.4 percent. The number of inbound visitors to China totaled 126.48 million, a year-on-year decline of 2.7 percent. Of this total, 21.94 million were foreigners, down 9.8 percent; and 104.54 million were Chinese compatriotsfrom Hong Kong, Macao and Taiwan, down 1.1 percent. Of all the inbound tourists, overnight visitors counted 50.88 million, down 4.1 percent. Foreign exchange earnings from international tourism topped 39.7 billion US dollars, down 2.9 percent. The number of China’s outbound visitors totaled 47.66 million, up 4.0 percent. Of this total, 42.21 million were on private visits, a year-on-year rise of 5.2 percent, or 88.6 percent of all outgoing visitors.VIII. Financial IntermediationBy the end of 2009, money supply of broad sense (M2) was 60.6 trillion yuan, reflecting a year-on-year increase of 27.7 percent. Money supply of narrow sense (M1) was 22.0 trillion yuan, up 32.4 percent. Cash in circulation (M0) was 3.8 trillion yuan, up 11.8 percent.Savings deposit in Renminbi and foreign currencies in all items of financial institutions totaled 61.2 trillion yuan at the end of 2009, an increase of 13.2 tirllion yuan. Of this total, the savings deposit in Renminbi stood at 59.8 trillion yuan, an increase of 13.1 trillionyuan. Loans in Renminbi and foreign currencies in all items of financial institutions reached 42.6 trillion yuan, an increase of 10.5 trillion yuan. Of this total, that in Renminbi was 40.0 trillion yuan, an increase of 9.6 trillion yuan.Table 14: Savings Deposit and Loans in RMB and Foreign Currencies in All Financial Institutions and the Growth Rates in 2009Unit: 100 million yuanItem Year-end figure Increase over 2008 (%)Savings deposit 612006 27.7Of which: By enterprises 224357 36.5 By urban and rural households 264761 19.5Of which: Deposits in RMB 260772 19.7 Loans 425597 33.0Of which: Short-term 151353 17.7 Medium and long-term 235579 43.5Loans in Renminbi from rural financial cooperation institutions (i.e. rural credit cooperatives, rural cooperation banks, and rural commercial banks) totaled 4.7 trillion yuan by the end of 2009, an increase of 972.7 billion yuan as compared with the beginning of 2009. The loans in Renminbi for consumption use from all financial institutions totaled 5.5 trillion yuan, an increase of 1,797.6 billion yuan. Of all consumption loans, short-term loans for individuals totaled 0.6 trillion yuan,an increase of 246.5 billion yuan, and medium- and long-term loans for individuals reached 4.9 trillion yuan, an increase of 1,551.1 billion yuan.Funds raised in 2009 by enterprises through issuing stocks and share rights on stock market amounted to 365.3 billion yuan, an increase of 125.5 billion yuan over the previous year. Of this total, 99 A-shares were issued, receiving 206.2 billion yuan worth of capital altogether, an increase of 99.5 billion yuan. The refinancing of A-shares (including rationing shares, public newly issued, nonpublic newly issued and warrants) received 159.1 billion yuan worth of capital altogether, an increase of 25.9 billion yuan over 2008. The listed companies financed 81.3 billion yuan through convertible bonds, bonds with attached warrants and corporate bonds, a decrease of 18.5 billion yuan. A total of 36 growth enterprise board stocks were issued for the first time, receiving 20.4 billion yuan.In 2009, corporate funds raised by the non-listed companies reached 425.2 billion yuan, an increase of 188.5 billion yuan over that in the previous year. The short-term financing funds of enterprises were 461.2 billion yuan, an increase of 28.1 billion yuan; and the medium-term notes were 698.7 billion yuan, an increase of 525.0 billion yuan. Funds raised by medium- and small-sized enterprises through collection notes reached 1.27 billion yuan.The premium received by the insurance companies totaled 1,113.7 billion yuan in 2009, up 13.8 percent over the previous year. Of this total, life insurance premium amounted to 745.7 billion yuan, health and casualty insurance premium 80.4 billion yuan, and property insurance premium 287.6 billion yuan. Insurance companies paid an indemnity worth of 312.5 billion yuan, of which, life insurance indemnity was 126.9 billion yuan, health and casualty insurance indemnity 28.1 billion yuan, and property insurance indemnity 157.6 billion yuan.IX. Education, Science and TechnologyIn 2009, the post-graduate education enrollment was 1.405 million students with 511 thousand new students and 371 thousand graduates. The general tertiary education enrollment was 21.447 million students with 6.395 million new students and 5.311 million graduates. Vocational secondary schools of various types had 21.787 million enrolled students, including 8.736 million new entrants, and 6.192 million graduates. Senior secondary schools had 24.343 million enrolled students, including 8.303 million new entrants, and 8.237 million graduates. Students enrolled in junior secondary schools totaled 54.409 million, including 17.885 million new entrants, and 17.977 million graduates. The country had a primary education enrollment of 100.715 million students, including 16.378 million new entrants, and 18.052 million graduates. There were 428 thousand students enrolled in special education schools, with 64 thousand new entrants. Kindergartens accommodated 26.578 million children.The amount of expenditures on research and development activities (R&D) was worth 543.3 billion yuan in 2009, up 17.7 percent over 2008, accounting for 1.62 percent of GDP. Of this total, 27.2 billion yuan was appropriated for fundamental research programs. A total number of 639 projects under the National Key Technology Research and Development Program and 1,328 projects under the Hi-tech Research and Development Program (the 863 Program) were implemented. The year 2009 saw a total of 127 national engineering research centers and 85 national engineering laboratories. The number of state validated enterprise technical centers reached 636 by the end of the year. The technical centers at the provincial level numbered 5,011. Venture capital investment plan had been initiated and implemented to boostnew emerging industries, and 20 venture investment funds were established. Some 977 thousand patent applications were accepted from home and abroad, of which 878 thousand were domestic applications, accounting for 89.9 percent of the total. A total number of 315 thousand patent applications for new inventions were accepted, of which 229 thousand were from domestic applicants or 72.8 percent of the total. A total of 582 thousand patents were authorized in 2009, of which 502 thousand were domestic patents, accounting for 86.2 percent of the total. A total of 128 thousand patents for new inventions were authorized, of which 65 thousand were domestic ones, accounting for 50.9 percent. Till the end of year 2009, the number of patents in force was1.520 million, of which 1.193 million patents were domestic ones, accounting for 78.5 percent; the number of patents in force for inventions was 438 thousand, of which 180 thousand was domestic ones, accounting for 41.1 percent. A total of 214 thousand technology transfer contracts were signed, representing 303.9 billion yuan in value, up 14.0 percent over the previous year. The year 2009 saw 6 times of successful launch of satellites. The first petaflop super computer Galaxy 1 was developed successfully, and ChangEr 1 satellite hit moon successfully.By the end of 2009, there were altogether 25,000 laboratories for product inspection, including 414 national inspection centers. There were 168 organizations for product certification and management system certification, which accumulatively certified products in 41 thousand enterprises. A total of 3,760 authorized measurement institutions enforced compulsory inspection on 45.60 million measurement instruments in the year. A total of 3,158 national standards were developed or revised in the year, including 2,102 new standards. There were 2,737 weather warning signals sent by national and provincial meteorological stations, and 3,950 weather alerts. There were1,457 seismological monitor stations and 32 seismological remote monitor network stations. The numbers of oceanic observation stations were 66. Mapping departments published 2,060 maps and 307 mapping books.X. Culture, Public Health and SportsAt the end of 2009, there were 2,478 art-performing groups, 3,214 culture centers, 2,833 public libraries, 1,996 museums, 251 radio broadcasting stations, 272 television stations, 2,087 radio broadcasting and television stations and 44 educational television stations throughout China. Subscribers to cable television programs numbered 173.98 million. Subscribers to digital cable television programs were 62.00 million. Radio broadcasting and television broadcasting coverage rates were 96.3 percent and 97.2 percent respectively. The country produced 456 feature movies and 102 science, educational, documentary, cartoon and special movies. A total of 43.7 billion copies of newspapers and 3.1 billion copies of magazines were issued, and 7.0 billion copies of books published. By the end of the year, there were 4,035 archives in China and 79.91 million documents were made accessible to the public.By the end of 2009, there were 289 thousand health institutions in China, including 60 thousand general hospitals and health centers, 26 thousand community health service centers, 3,013 maternal and child health-care institutions, 1,315 specialized health institutions, 3,543 epidemic disease prevention centers (stations) and 2,706 health monitoring institutions and 193 thousand clinics. There were 5.22 million health workers in China, including 2.16 million practicing doctors and assistant practicing doctors and 1.74 million registered nurses. General hospitals and health centers in China possessed 3.96 million beds. The number of rural health care centers was 39 thousand, possessing 910 thousand beds and employing 898 thousand health care。
2009年南昌市国民经济和社会发展统计公报
2009年南昌市国民经济和社会发展统计公报【法规类别】经济统计【发布部门】南昌市统计局国家统计局南昌调查队【发布日期】2010.04.15【实施日期】2010.04.15【时效性】现行有效【效力级别】地方规范性文件2009年南昌市国民经济和社会发展统计公报(南昌市统计局、国家统计局南昌调查队 2010年4月15日)2009年是进入新世纪以来我市经济发展最具挑战性的一年。
面对前所未有的压力和挑战,在市委、市政府的坚强领导下,全市上下深入学习实践科学发展观,全面贯彻落实胡锦涛总书记提出的“三保一弘扬”重要指示精神,坚定信心,迎难而上,奋力拼搏,国民经济实现了持续回升,各项社会事业全面进步,人民生活继续改善。
一、综合经济总量:据初步核算,全年实现地区生产总值1837.50亿元,按可比价格计算,比上年增长13.1%。
其中,第一产业增加值109.65亿元,增长7.7%;第二产业增加值1018.69亿元,增长14.6%;第三产业增加值709.16亿元,增长11.7%。
三次产业结构由2008年的6.1:55.4:38.5调整为2009年的6.0:55.4:38.6。
人均生产总值39669元,增长12.3%。
非公经济:在全市生产总值中,非公有制经济实现增加值1031.37亿元,增长15.5%,占全市生产总值的比重由上年的54.6%提高到56.1%。
财政收支:全年完成财政总收入249.88亿元,按同口径计算,比上年增长11.5%。
其中,地方财政一般预算收入115.88亿元,增长13.4%。
从收入完成情况看,完成增值税9.10亿元,增长3.1%;营业税44.96亿元,增长25.3%;企业所得税10.89亿元,增长8.0%。
全年地方财政一般预算支出181.75亿元,比上年增长22.7%。
其中,交通运输支出16.25亿元,增长1.8倍;医疗卫生支出14.46亿元,增长57.1%;科学技术支出3.28亿元,增长46.1%;农业支出8.78亿元,增长31.4%;教育支出26.67亿元,增长17.1%;环境保护支出2.43亿元,增长12.6%;社会保障和就业支出26.33亿元,增长8.8%。
广安市2009年国民经济和社会发展统计公报
广安市2009年国民经济和社会发展统计公报2009年,市委、市政府深入落实科学发展观,认真贯彻党中央、国务院积极的财政政策和适度宽松的货币政策,全面落实应对国际金融危机的一揽子计划和政策措施,国民经济在逆境中实现快速回升,运行质量不断提高,各项社会事业全面进步。
一、综合经济企稳向好态势明显。
经省统计局审定,全市实现生产总值450.3亿元,同比增长14.7%,较上年提高0.5个百分点。
三次产业分别完成增加值101.3、200.1和148.9亿元,分别同比增长4.5%、23.0%和10.8%;对经济的贡献率分别为6.5%、67.5%和26.0%,拉动GDP分别增长1.0、9.9和3.8个百分点。
三次产业结构由上年的25.0:40.8:34.2调整为22.5:44.4:33.1,一产业比重比上年下降2.5个百分点,二产业比重比上年上升3.6个百分点。
工业化率为33.5%,较上年提高3.9个百分点。
民营经济对GDP贡献突出。
全市实现民营经济增加值240.1亿元,同比增长19.0%,占GDP的53.3%。
对GDP的贡献率为66.1%,拉动GDP同比增长9.7个百分点。
价格运行先抑后扬。
全年居民消费价格总水平上涨0.2%,商品零售价格下跌0.4%,农业生产资料价格上涨0.8%。
其中食品类价格上涨1.5%,居住类价格下跌1.4%,其中建房及装修材料价格总体持平,租房价格上涨0.5%,水电燃料价格上涨0.4%。
企业家信心明显回升。
全年企业家信心指数为150.2,比上年提高26.1点;企业景气指数为144.6,比上年提高28.2点,企业生产状况持续好转。
其中,建筑业、房地产业、社会服务业、住宿餐饮业企业的生产经营状况改善较为明显,企业景气指数分别较上年上升38.4点、60.0点、20.0点、22.9点。
二、农业全年实现农业总产值167.0亿元,同比增长5.0%,实现增加值101.3亿元,同比增长4.5%。
主要农产品稳定增长。
新余2009统计公报
新余市2009年国民经济和社会发展统计公报2010-04-16 09:07 来源:新余市统计局国家统计局新余调查队字体:大中小2009年,全市人民在市委、市政府的正确领导下,以邓小平理论和“三个代表”重要思想为指导,深入贯彻落实科学发展观,全面落实中央“保增长、调结构、促改革、惠民生”的决策部署和政策措施,全市经济保持平稳较快增长,呈现企稳回升、加速向好的良好态势,主要经济指标好于预期,各项社会事业协调发展。
一、综合全年全市生产总值(GDP)484.17亿元,比上年增长13.5%。
分产业看,第一产业增加值33.18亿元,增长6.9%;第二产业增加值283.31亿元,增长12.9%;第三产业增加值167.68亿元,增长16.8%。
三次产业结构为6.9:58.5:34.6。
人均生产总值达42606元。
非公有制经济实现增加值296.21亿元,增长15.5%,占GDP的比重达61.2%,比上年提高1个百分点。
全年财政收入56.58亿元,比上年增加1.51亿元,增长2.7%,其中税收收入46.32亿元。
地方财政收入33.03亿元,增长26.6%。
财政支出58.67亿元,增长31.5%,其中医疗卫生支出增长60.7%,环境保护支出增长89.2%,城乡社区事务支出增长89.9%。
全年居民消费价格比上年下降0.43%。
八大类消费品价格呈“四升四降”格局,其中食品上涨0.46%,烟酒及用品上涨0.95%,家庭设备用品及服务上涨0.36%,医疗保健及个人用品上涨2.7%;衣着下降3.7%,交通通信下降3.41%,娱乐教育文化用品及服务下降0.52%,居住下降0.96%。
工业品出厂价格指数80.62%,下降19.38%;原材料、燃料、动力购进价格指数81.1%,下降18.9%。
表1:2009年居民消费价格比上年涨跌幅度年末从业人员69.44万人,比上年末增加1.1万人。
其中城镇29.69万人,增加0.99万人。
年末城镇登记失业率为3.4%,比上年末下降0.1个百分点。
国家统计局2009年国民经济和社会发展统计公报
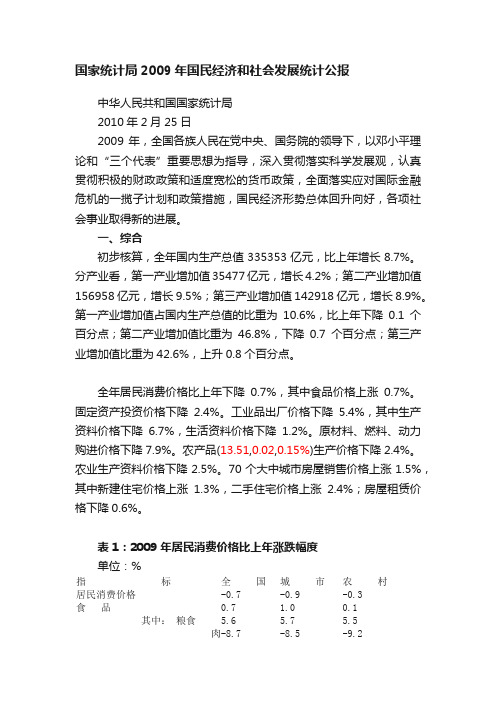
国家统计局2009年国民经济和社会发展统计公报中华人民共和国国家统计局2010年2月25日2009年,全国各族人民在党中央、国务院的领导下,以邓小平理论和“三个代表”重要思想为指导,深入贯彻落实科学发展观,认真贯彻积极的财政政策和适度宽松的货币政策,全面落实应对国际金融危机的一揽子计划和政策措施,国民经济形势总体回升向好,各项社会事业取得新的进展。
一、综合初步核算,全年国内生产总值335353亿元,比上年增长8.7%。
分产业看,第一产业增加值35477亿元,增长4.2%;第二产业增加值156958亿元,增长9.5%;第三产业增加值142918亿元,增长8.9%。
第一产业增加值占国内生产总值的比重为10.6%,比上年下降0.1个百分点;第二产业增加值比重为46.8%,下降0.7个百分点;第三产业增加值比重为42.6%,上升0.8个百分点。
全年居民消费价格比上年下降0.7%,其中食品价格上涨0.7%。
固定资产投资价格下降2.4%。
工业品出厂价格下降5.4%,其中生产资料价格下降6.7%,生活资料价格下降1.2%。
原材料、燃料、动力购进价格下降7.9%。
农产品(13.51,0.02,0.15%)生产价格下降2.4%。
农业生产资料价格下降2.5%。
70个大中城市房屋销售价格上涨1.5%,其中新建住宅价格上涨1.3%,二手住宅价格上涨2.4%;房屋租赁价格下降0.6%。
表1:2009年居民消费价格比上年涨跌幅度单位:%指标全国城市农村居民消费价格-0.7 -0.9 -0.3食品0.7 1.0 0.1其中:粮食 5.6 5.7 5.5肉-8.7 -8.5 -9.2禽及其制品油脂-18.3 -17.9 -18.81.5 1.32.0鲜蛋15.4 15.0 16.7鲜菜9.1 9.0 9.5鲜果烟酒及用品 1.5 1.7 1.3衣着-2.0 -2.2 -1.6家庭设备用品及服务0.2 0.3 0.0医疗保健及个人用品 1.2 1.1 1.5交通和通信-2.4 -2.7 -1.8娱乐教育文化用品及服务-0.7 -1.2 0.6居住-3.6 -4.6 -1.5 年末全国就业人员77995万人,比上年末增加515万人。
2009年河池市国民经济和社会发展统计公报
2009年河池市国民经济和社会发展统计公报作者:来源:发表时间:2010-5-21 17:39:31 访问次数:502009年,河池市各族人民在自治区党委、自治区人民政府的领导下,以邓小平理论和“三个代表”重要思想为指导,深入贯彻落实科学发展观,认真贯彻积极的财政政策和适度宽松的货币政策,全面落实应对国际金融危机的一揽子计划和政策措施,国民经济形势总体回升向好,各项社会事业取得新的进展。
一、综合初步核算,全市生产总值(GDP)达到382.83亿元,比上年增长8.18%。
分产业看,第一产业增加值83.04亿元,增长4.62%;第二产业增加值165.86亿元,增长6.32%;第三产业增加值133.93亿元,增长12.67%。
第一、二、三产业增加值占地区生产总值的比重分别为21.69%、43.32%和34.99%。
第一、二、三产业对经济增长的贡献率分别为12.47%、33.03%和54.51%。
按常住人口计算全市人均生产总值达到9992元。
2009年居民消费价格指数累计98.3%。
年末全市就业人员185.58万人,增长1.61 %。
其中城镇就业34.43万人,净增1.41万人,增长4.27%。
全年新增就业2.58万人。
年末城镇登记失业率3.38%,比上年末下降0.11个百分点。
全年财政收入40.32亿元,比上年增长0.21%,其中一般预算收入21.04亿元,增长17.49%。
各项税收收入11.55亿元,增长2.59%。
一般预算支出93.40亿元,增长16.82%。
二、农业全年粮食种植面积275.20千公顷,比上年增加4.01千公顷;油料种植面积7.26千公顷,增加1.70千公顷;甘蔗种植面积75.19千公顷,增加3.72千公顷;蔬菜种植面积58.91千公顷,增加2.63千公顷;果园面积38.83千公顷,增加0.87千公顷;桑园面积36.35千公顷,减少2.83千公顷。
全年粮食产量102.93万吨,增长0.09%;油料产量0.77万吨,增长44.89%;甘蔗产量460.31万吨,增长1.59%;蔬菜产量(含食用菌)100.81万吨,增长2.55%;园林水果产量23.29万吨,增长11.53%。
江西省人民政府关于下达我省2009年国民经济和社会发展计划的通知
江西省人民政府关于下达我省2009年国民经济和社会发展计划的通知文章属性•【制定机关】江西省人民政府•【公布日期】2009.03.20•【字号】赣府发[2009]1号•【施行日期】2009.03.20•【效力等级】地方规范性文件•【时效性】现行有效•【主题分类】城乡建设综合规定正文江西省人民政府关于下达我省2009年国民经济和社会发展计划的通知(赣府发〔2009〕1号)各市、县(区)人民政府,省政府各部门:省发展和改革委员会《关于我省2009年国民经济和社会发展计划的报告》已经省政府同意,现将该报告及所附的《江西省2009年国民经济和社会发展计划主要指标》印发给你们,请据此安排和部署工作。
2009年,是新中国成立60周年,也是推进“十一五”规划顺利实施的关键一年。
做好今年国民经济和社会发展工作,对于有效应对国际国内复杂多变的经济环境,保持经济社会平稳较快发展,维护改革发展稳定大局至关重要。
根据省委十二届八次全会部署和省十一届人大二次会议决议,今年全省国民经济和社会发展的主要预期目标是:生产总值增长11%;财政总收入增长15%,地方财政收入增长13.6%;全社会固定资产投资增长30%,力争40%;社会消费品零售总额增长15%;城镇居民人均可支配收入增长8%,农民人均纯收入增长8%;居民消费价格总水平涨幅控制在4%左右;万元生产总值能耗下降4%,化学需氧量排放量下降2%,二氧化硫排放量下降2%;人口自然增长率控制在8‰以内。
实现上述目标,必须全面贯彻落实党的十七大、十七届三中全会、中央经济工作会议和胡锦涛总书记在我省视察时的重要讲话精神,以科学发展观为指导,全力以赴保增长,千方百计保民生,加大力度保稳定,弘扬伟大的井冈山精神,努力变挑战为机遇,变压力为动力,变经济波动期为发展机遇期,确保经济社会平稳较快发展,不断迈出富民兴赣新步伐,以优异成绩迎接新中国成立60周年。
各地、各部门要围绕省委十二届八次全会确定的战略部署和省十一届人大二次会议审议通过的目标任务,坚定信心,真抓实干,咬定发展不放松,在应对挑战中赢得新机遇,在破解难题中实现新发展;以昂扬向上的斗志、坚韧不拔的毅力、求真务实的作风、创造性的工作,扩内需保增长,抓项目促发展,调结构上水平,强改革增活力,重民生稳社会;以更加扎实有力的措施,努力在加大投入、促进消费,增强发展拉动力上,在抓好工业、夯实农业,提升发展支撑力上,在深化改革、扩大开放,创新发展活力上,在实施民生工程、发展社会事业,促进社会和谐上,在以鄱阳湖生态经济区建设为龙头,扎实推进绿色生态江西建设上有更大作为,全面完成2009年国民经济和社会发展的各项任务。
关于2009年国民经济和社会发展的统计公报.doc
潮州市统计局关于2009年国民经济和社会发展的统计公报2009年3月22日2009年,面对国际金融危机的严峻考验,在市委、市政府的正确领导下,全市人民上下一心、迎难而上、化危为机,认真贯彻落实中央各项决策部署和一系列政策措施,按照省委、省政府“三促进一保持”的要求,做好保增长、保民生、保稳定工作,有效遏制经济增长下滑态势,力促经济形势企稳向好,社会事业全面发展。
一、综合经济形势企稳向好,第三产业贡献率明显提高。
2009年,潮州经济经历了“触底反弹—企稳向好—稳步回升”的一系列过程,经初步核算,全年实现生产总值480.2亿元,比上年增长12.5%,增速比全省平均水平高3个百分点。
其中,第一产业增加值35.5亿元,增长5.9%;第二产业增加值265.9亿元,增长10.7%,对GDP增长的贡献率为48.5%,拉动经济增长6.1个百分点;第三产业增加值178.8亿元,增长16.5%,对GDP增长的贡献率为48.3%,拉动经济增长6个百分点,第三产业对经济增长的拉动作用明显提高。
在第三产业中,交通运输、仓储和邮政业增长12.7%,批发零售业增长25.3%,住宿和餐饮业增长15.3%,金融业增长14.5%,房地产业增长19.3%,其他服务业增长10.9%。
产业结构优化调整,三次产业比例关系由上年的7.8:56.3:35.9调整为7.4:55.4:37.2。
人均生产总值18681元,比上年增长11.9%。
物价下降。
2009年居民消费价格总水平比上年下降3%,CPI比全省平均水平低0.7个百分点。
八大类消费品价格一升七降,烟酒及用品类价格上涨1.7%,食品类价格下降1.4%,衣着类下降2.4%,医疗保健和个人用品类下降0.2%,居住类下降8.4%,家庭设备用品及维修服务类下降1%,交通和通讯类价格下降6.5%,娱乐教育文化用品及服务类价格下降1.7%。
商品零售价格总指数下降3.3个百分点。
就业形势基本稳定。
2009年末城镇在岗职工人数11.59万人,比上年末增长0.5%,年末城乡私营企业和个体工商登记户数共52267户,比上年末减少234户,其中,私营企业增加952家,个体工商户减少1186户。
2009年金昌市国民经济和社会发展统计公报
2009年金昌市国民经济和社会发展统计公报--------------------------------------------------------------------------------金昌市统计局国家统计局金昌调查2010年3月31日2009年,全市各族人民在市委、市政府的正确领导下,以邓小平理论和“三个代表”重要思想为指导,深入贯彻落实科学发展观,以调整经济结构、促进循环经济为切入点,坚持“强投入、抓接续、保增长、促和谐”的工作主线,积极克服世界金融危机带来的不利影响,全市经济实现趋稳回升,各项社会事业取得了新的进步。
一、综合经统计,2009年全市共实现地区生产总值194.75亿元,按可比价计算,比上年增长14.2%。
其中,第一产业增加值10.24亿元,下降1.84%;第二产业增加值155.68亿元,增长16.09%;第三产业增加值28.83亿元,增长8.23%。
人.均GDP达到41060元(折合6011美元),比上年增长13.52%。
全市居民消费价格总指数为101.7%,比上年上涨1.7个百分点。
其中食品价格指数上涨5.7%,衣着价格指数下降2.2%,烟酒及用品价格指数上涨0.3%,家庭设备用品及维修服务价格指数上涨0.6%,医疗保健价格指数下降0.8%,交通和通信价格指数上涨1.3%,娱乐教育文化用品价格指数下降0.2%,居住价格指数上涨0.6%。
商品零售价格总指数上涨1.9%。
建筑安装工程价格指数上涨0.65%;工业品出厂价格指数下降22.41%;固定资产投资价格指数上涨1.45%;房屋销售价格指数上涨4.1%;服务项目价格指数上涨0.4%。
全市城镇新增就业人数9026人,解决高校毕业生就业1019人,城镇登记失业率3.6%,与上年持平。
输转城乡富余劳动力7.7万人(次),培训农民6.6万人(次),实现劳务收入5.67亿元,比上年增长26%。
2009年反映企业对宏观经济环境的企业家信心指数为155.66,在较好景气区间运行,与上年相比上升7.72个百分点;反映企业综合生产经营情况的企业景气指数为138.1,在景气区间运行,比上年同期上升2.35个百分点。
- 1、下载文档前请自行甄别文档内容的完整性,平台不提供额外的编辑、内容补充、找答案等附加服务。
- 2、"仅部分预览"的文档,不可在线预览部分如存在完整性等问题,可反馈申请退款(可完整预览的文档不适用该条件!)。
- 3、如文档侵犯您的权益,请联系客服反馈,我们会尽快为您处理(人工客服工作时间:9:00-18:30)。
江西省统计局国家统计局江西调查总队2009年,是新世纪以来我国经济社会发展最为困难的一年,也是我们应对国际金融危机取得显著成效的一年。
在省委、省政府的坚强领导下,全省人民坚持以科学发展观为指导,全面贯彻落实胡锦涛总书记视察我省提出的“三保一弘扬”总体要求,全力以赴保增长,千方百计保民生,加大力度保稳定,全省经济社会保持平稳较快发展,主要经济指标好于年初预期,多项指标在全国位次前移,经济发展呈现回升向好、逆势上扬的良好态势,各项社会事业取得了新的成就。
一、综合初步核算,全年全省生产总值7589.2亿元,比上年增长13.1%,连续三年实现13%以上增长。
分产业看,第一产业增加值1098.3亿元,增长4.5%;第二产业增加值3890.3亿元,增长17.1%;第三产业增加值2600.6亿元,增长10.7%。
三次产业结构调整为14.5:51.2:34.3,二三一结构进一步强化和巩固。
三次产业对经济增长的贡献率分别为5.0%、68.1%和26.9%。
非公有制经济快速发展,实现增加值4090.6亿元,增长16.0%,占GDP的比重达53.9%。
全年财政总收入突破900亿元,达928.7亿元,比上年增长13.7%。
其中,地方财政收入581.2亿元,增长18.9%。
税收收入实现较快增长。
税收总收入777.5亿元,增长13.3%。
财政收入较快增长为加强和改善宏观调控、大力实施“民生工程”等提供了强有力的财力支持。
全年地方财政支出1548.6亿元,增长28.0%。
其中,医疗卫生支出增长44.3%,农林水事务支出增长35.7%。
全年居民消费价格下降0.7%。
其中,城市下降0.6%,农村下降0.8%。
从八大类别看,食品类价格上涨0.1%,烟酒及用品类上涨0.4%,家庭设备用品及服务类、医疗保健及个人用品类均上涨1.1%,娱乐教育文化用品及服务业上涨0.3%,其他类价格均呈不同幅度下降。
商品零售价格下降0.9%。
工业品出厂价格下降7.0%。
原材料、燃料、动力购进价格下降9.3%。
固定资产投资价格下降3.9%。
农产品生产价格下降3.2%。
表1 居民消费价格比上年涨跌幅度年末从业人员2445.2万人,比上年增加40.7万人。
全年城镇新增就业人员47.5万人。
年末城镇登记失业率为3.4%。
二、农业粮食连续六年实现增产,全年总产量首次突破400亿斤,达400.5亿斤,增长2.3%。
全年粮食种植面积3604.6千公顷,比上年增长0.7%;油料种植面积716.4千公顷,增长8.7%;棉花种植面积75.5千公顷,增长13.4%;蔬菜种植面积509.7千公顷,减少0.6%。
全年完成造林面积243.2千公顷。
全年肉类总产量300.9万吨,增长15.0%,其中猪肉增长15.4%。
生猪出栏2814.5万头,增长10.9%。
年末生猪存栏1680.1万头,增长9.8%。
全年水产品产量205.3万吨,增长7.8%。
表2 主要农产品产量及其增长速度单位:万吨年末省级以上龙头企业407家,全年实现销售收入1200.1亿元,比上年增长13.3%;实现利润48.5亿元,增长9.0%。
规模以上农产品加工企业2192家,增长19.0%;实现销售收入1293亿元,增长20.1%。
农民专业合作组织8416个,增长90.1%;合作组织成员8.9万户,增长84.4%。
全年农田有效灌溉面积达1840.4千公顷,新增有效灌溉面积14.0千公顷。
年末农业机械总动力3358.9万千瓦,比上年末增长14.0%,其中农用排灌动力机械825.9万千瓦,增长20.2%;联合收割机达3.8万台,增长31.0%。
实际机耕面积达2579.4千公顷;机械收获面积1994.6千公顷,占农作物总播种面积的比重达37.1%,提高1.7个百分点。
农用化肥施用量(折纯)135.8万吨,增长2.1%。
三、工业和建筑业全年工业增加值3170.1亿元,比上年增长18.4%,占生产总值的比重达41.8%。
其中,规模以上工业增加值2610.8亿元,增长20.1%。
支柱产业保持较快发展。
六大支柱产业完成工业增加值1484.5亿元,增长18.6%,对规模以上工业增长的贡献率为53.9%。
表3 规模以上工业增加值及其增长速度全年规模以上工业原煤产量2982.5万吨,增长15.3%;钢材1647.4万吨,增长29.1%;水泥6153.2万吨,增长17.7%;机制纸及纸板139.6万吨,增长18.8%;汽车28.5万辆,增长35.0%;十种有色金属94.2万吨,增长9.1%。
表4 规模以上工业主要产品产量及其增长速度全年规模以上工业产品销售率98.8%,比上年提高0.3个百分点;实现主营业务收入9814.2亿元,比上年增长16.3%;实现利润496.8亿元,增长49.5%;实现利税942.7亿元,增长34.0%。
在37个行业中,有34个行业实现了盈利,其中利润增长20%以上的有32个。
工业经济效益综合指数233.8%,提高14.9个百分点。
年末入园投产工业企业达7936家,比上年增长4.9%;全年安置从业人数139.1万人,增长3.2%。
全年园区完成工业增加值2102.7亿元,增长21.6%;主营业务收入、利润、利税分别完成6687.3亿元、348.0亿元和627.6亿元,分别增长19.4%、34.9%和25.4%。
年主营业务收入超100亿元的园区达20家,比上年增加7家,其中南昌高新技术产业开发区达537.8亿元,南昌经济技术产业开发区325.7亿元。
全年具有建筑业资质等级总承包和专业承包建筑业企业完成建筑业总产值1285.0亿元,增长24.2%;按建筑业总产值计算,全员劳动生产率人均17万元,增长12.4%。
四、固定资产投资全年全社会固定资产投资6642.4亿元,比上年增长40.0%。
其中,城镇固定资产投资6006.7亿元,增长38.9%。
分产业看,第一产业投资225.8亿元,增长67.5%;第二产业投资3630.9亿元,增长40.7%,其中工业投资3607.5亿元,增长40.7%;第三产业投资2785.7亿元,增长37.3%。
非国有投资增势强劲,完成投资4860.0亿元,增长43.3%,占全社会固定资产投资的比重由上年的71.5%提高到73.2%。
表5 分行业全社会固定资产投资及其增长速度单位:亿元德兴至南昌、上饶至武夷山等7条高速公路相继开工;鹰潭至瑞金、石城至吉安等高速公里进展顺利;瑞金至赣州高速公路建成通车。
全年新增高速公路通车里程117公里;硬化改造农村公路11500公里。
衡茶吉铁路全面开工,昌九城际、向莆等铁路建设进展顺利,京九(北段)、峰福等铁路电气化改造全面完成。
全年改造铁路281.8公里。
昌北机场扩建加快推进。
贵溪电厂、景德镇电厂“上大压小”项目开工建设,华能井冈山电厂二期、新昌电厂1号机组建设投运,统调电力装机新增162.5万千瓦。
500千伏鄂赣Ⅲ回建成投运。
江西艺术中心、江报传媒大厦等重大社会公益性项目进展顺利。
全年房地产开发投资634.5亿元,比上年增长15.9%。
商品房竣工面积1646.8万平方米,增长3.8%;商品房销售额602.8亿元,增长63.4%。
五、国内贸易全年社会消费品零售总额2484.4亿元,比上年增长19.3%。
分城乡看,城市市场1330.6亿元,增长19.4%;县及县以下市场1153.8亿元,增长19.2%。
住宿和餐饮业快速增长,实现零售额278.6亿元,增长22.3%;批发零售贸易业实现零售额2185.6亿元,增长19.0%。
在限额以上批发零售业零售额中,汽车类实现零售额114.3亿元,增长70.3%;家具类3.6亿元,增长1.5倍;金银珠宝类7亿元,增长20.1%;化妆品类5.7亿元,增长35.3%;电子出版物及音像制品类2.5亿元,增长26.4%。
年成交额在亿元以上的商品交易市场88家,实现成交额1047.6亿元。
其中,年成交额在10亿元以上的有23家,成交额825.2亿元。
六、对外经济全年进出口总额126.65亿美元,比上年下降7.0%,比上半年收窄9.4个百分点。
其中,出口73.64亿美元,下降4.7%;进口53.01亿美元,下降10.0%。
在出口中,外商投资企业出口额32.26亿美元,下降14.6%;私营及其他企业30.97亿美元,增长32.8%;国有企业出口额10.40亿美元,下降35.8%。
全年纺织服装、鞋类等传统大宗商品出口分别增长12.7%、18.5%。
机电产品出口19.33亿美元,增长24.5%。
对美国、香港、东盟等国家或地区出口保持增长,分别增长29.9%、9.7%和8.9%。
表6 进出口总额及其增长速度单位:亿美元全年新批外商投资企业821个,增长19.2%,其中新批合同外资1000万美元以上大项目94个。
实际使用外商直接投资40.24亿美元,增长11.7%。
全年新增具有世界500强投资背景的企业1家,总数达37家。
实际引进省外单项投资5000万元以上工业项目资金1367.1亿元,增长24.2%。
九江城西港、上饶“无水港”建成运营;开通南昌—宁波、吉安—厦门、吉安—深圳铁海联运班列,铁海联运线路增加至9条,江西至沿海主要口岸的出海通道全部打通;新增南昌—仁川定期包机和南昌—台北空中直航两条国际(地区)航线。
国际友好城市增加8对。
全年对外承包工程、劳务合作和设计咨询合同项目233个,合同金额10.67亿美元,增长39.5%;完成营业额7.56亿美元,增长34.4%。
七、交通、邮电和旅游全年铁路、公路、水运完成旅客运输量70491.7万人,增长7.0%;完成货物运输量85630万吨,比上年增长6.7%。
机场旅客吞吐量453.8万人,增长21.0%。
其中,昌北机场旅客吞吐量393.8万人,增长18.3%。
全年完成邮电业务总量624.2亿元,比上年增长26.3%。
其中,邮政业务量31.1亿元,增长15.9%;电信业务量593.1亿元,增长26.8%。
年末局用电话交换机总容量619.5万门。
固定电话用户748.5万户,其中城市电话用户448.0万户,乡村电话用户300.5万户。
新增移动电话用户270万户,年末达到1547.3万户。
宽带网用户达245.9万户,增长36.2%。
全年共接待国内旅游人数9303.3万人次,比上年增长16.0%;国内旅游收入655.5亿元,增长21.0%。
共接待入境旅游人数96.4万人次,增长20.2%;旅游外汇收入2.9亿美元,增长15.1%。
八、金融、证券和保险业年末金融机构人民币存款余额9296.4亿元,比上年增长29.0%,同比加快6.9个百分点。
其中,企业存款余额2598.3亿元,增长40.8%;城乡居民储蓄存款余额5092.7亿元,增长22.2%。
金融机构贷款余额6347.0亿元,增长39.7%,同比加快21.5个百分点。