锐钛矿与金红石的XRD区分
钛白粉的性质——晶体性质
世上无难事,只要肯攀登
钛白粉的性质——晶体性质
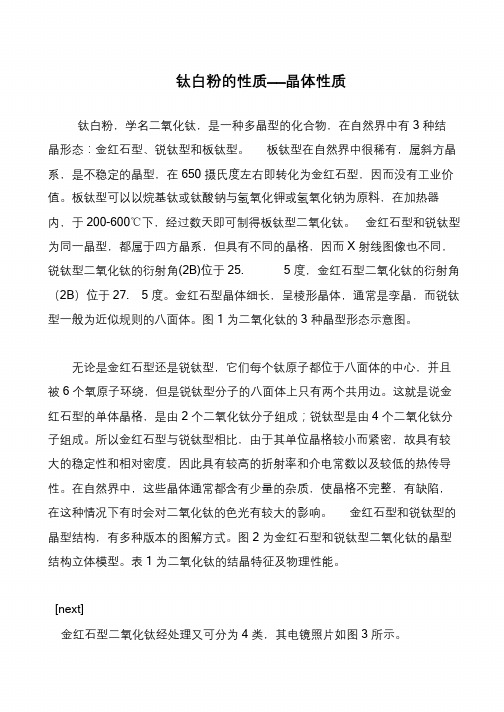
钛白粉,学名二氧化钛,是一种多晶型的化合物,在自然界中有3 种结
晶形态:金红石型、锐钛型和板钛型。
板钛型在自然界中很稀有,属斜方晶系,是不稳定的晶型,在650 摄氏度左右即转化为金红石型,因而没有工业价值。
板钛型可以以烷基钛或钛酸钠与氢氧化钾或氢氧化钠为原料,在加热器内,于200-600℃下,经过数天即可制得板钛型二氧化钛。
金红石型和锐钛型为同一晶型,都属于四方晶系,但具有不同的晶格,因而X 射线图像也不同,锐钛型二氧化钛的衍射角(2B)位于25. 5 度,金红石型二氧化钛的衍射角(2B)位于27. 5 度。
金红石型晶体细长,呈棱形晶体,通常是孪晶,而锐钛型一般为近似规则的八面体。
图1 为二氧化钛的3 种晶型形态示意图。
无论是金红石型还是锐钛型,它们每个钛原子都位于八面体的中心,并且被6 个氧原子环绕,但是锐钛型分子的八面体上只有两个共用边。
这就是说金红石型的单体晶格,是由2 个二氧化钛分子组成;锐钛型是由4 个二氧化钛分子组成。
所以金红石型与锐钛型相比,由于其单位晶格较小而紧密,故具有较大的稳定性和相对密度,因此具有较高的折射率和介电常数以及较低的热传导性。
在自然界中,这些晶体通常都含有少量的杂质,使晶格不完整,有缺陷,在这种情况下有时会对二氧化钛的色光有较大的影响。
金红石型和锐钛型的晶型结构,有多种版本的图解方式。
图2 为金红石型和锐钛型二氧化钛的晶型结构立体模型。
表1 为二氧化钛的结晶特征及物理性能。
[next]
金红石型二氧化钛经处理又可分为4 类,其电镜照片如图3 所示。
自 然界 中主要有锐钛矿 相和金红石相两种 晶
自然界中主要有锐钛矿相和金红石相两种晶
型结构。
锐钛矿相纳米T i O 2 材料具有很高的光电
活性,又对可见光透过性好,无须掺杂或复合就对
3 8 7 .5 n m以下的紫外光有很强的吸收能力,并且
其紫外吸收边很陡。
利用纳米T i O 2 这些本征特性
并结合光伏效应原理,为紫外光的传感技术提供
了理论依据
(E u 3 + 掺杂T i O 2 纳米晶的制备及光致发光研究
夏天,曹望和,田莹,付姚,周立新
( 大连海事大学光电子技术研究所,辽宁大连1 1 6 0 2 6 ))
2 θ/( 。
)
西北大学
硕士学位论文
TiO<,2>纳米管阵列阳极氧化法制备、改性及光电催化性能研究
姓名:冯娟娟
纳米技术的根本是通过改变材料的尺寸将数量级降低
到纳米级,使材料的有效面积相对增加来改变材料的应用特征
1972年,Fujishima和Honda首先报道了用Ti02作为光催化剂分解水制备
这一发现立刻引起了学术界的广泛关注,证实了太阳能转化为化学能的可能性,在能源日益枯竭的时代,将太阳能转化为化学能来缓解能源危机有重大的实用意义。
TiO2半导体纳米复合材料XRD分析
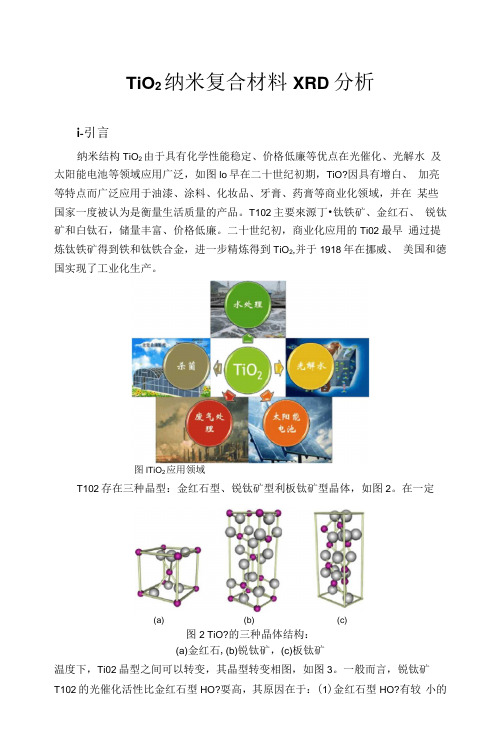
TiO2纳米复合材料XRD分析i-引言纳米结构TiO2由于具有化学性能稳定、价格低廉等优点在光催化、光解水及太阳能电池等领域应用广泛,如图lo早在二十世纪初期,TiO?因具有增白、加亮等特点而广泛应用于油漆、涂料、化妆品、牙膏、药膏等商业化领域,并在某些国家一度被认为是衡量生活质量的产品。
T102主要來源丁•钛铁矿、金红石、锐钛矿和白钛石,储量丰富、价格低廉。
二十世纪初,商业化应用的Ti02最早通过提炼钛铁矿得到铁和钛铁合金,进一步精炼得到TiO2,并于1918年在挪威、美国和徳国实现了工业化生产。
图lTiO2应用领域T102存在三种晶型:金红石型、锐钛矿型利板钛矿型晶体,如图2。
在一定(a) (b) (c)图2 TiO?的三种晶体结构:(a)金红石,(b)锐钛矿,(c)板钛矿温度下,Ti02晶型之间可以转变,其晶型转变相图,如图3。
一般而言,锐钛矿T102的光催化活性比金红石型HO?耍高,其原因在于:(1)金红石型HO?有较小的禁带宽度(锐钛矿HO?的禁带宽度为3.2 eV,金红石型HO?的禁带宽度为 3.0 eV),其较正的导带阻碍了氧气的还原反应;(2)锐钛矿型TiO2晶格中有较 多的缺陷和位错,从而产生较多的氧空位来捕获电子,而金红石型TiO2是T1O2 三种晶型中最稳定的晶型结构,具有较好的晶化态,缺陷少,光生空穴和电子在 实际反应中极易复合,催化活性受到很大的影响:(3)金红石型Ti 。
?光催化活 性低,同时还与高温处理过程中粒子大量烧结引起比表而积的急剧下降有关。
Anatase-200 0 200 400600 800 1000 1200CC) 图3TiO2晶型转变相图本文首先以金红石型为例计算其消光系数和结构因子,结合我最近的实验结 果分析TiO?及其复合物的XRD 表征结果。
2.金红石型TH 》结构及XRD 谱图特征b• TiO O图4 (a)金红石晶胞结构,(b)金红石晶胞垂直于(001)面的剖面图金纤石屈于四方晶系,空间群P 兰nm •晶胞参数a o =O.4S9 nm^ c o =0.?96 nm m 其结构如图 4。
锐钛型二氧化钛与金红石型二氧化钛的区分

1、(锐钛型二氧化钛与金红石型二氧化钛)的区分1.1 方法利用X射线衍射仪得到XRD图谱进行分析1.2用到的仪器X射线衍射仪X射线产生原理:高速运动的电子与物体碰撞时,发生能量转换,电子的运动受阻失去动能,其中一小部分(1%左右)能量转变为X射线,而绝大部分(99%左右)能量转变成热能使物体温度升高1.2.1 X射线管的结构阴极:又称灯丝(钨丝),通电加热后便能释放出热辐射电子。
阳极:又称靶,通常由纯金属制成(Cr,Fe,Co,Ni,Cu,Mo,Ag, W等),使电子突然减速并发射X射线。
阳极需要水强制冷却。
窗口:是X射线射出的通道,维持管内高真空,对X射线吸收较少,如金属铍、含铍玻璃、薄云母片X射线管中心焦点在X射线衍射中,总希望有较小的焦点(提高分辨率)和较强的X射线强度(缩短爆光时间)。
一般采用在与靶面成一定角度的位置接受X射线,这样可以达到焦点缩小,X射线相应增强的目的。
1.2.2 X射线特点1.2.3理论基础:布拉格方程1.2.4具体方法用X射线衍射分析法中的粉末法来分析两种结构。
只有满足Bragg方程,才能产生衍射现象,因此用粉末法对测定的晶体样品,不改变λ,要连续改变θ。
:⏹用单色的X射线照射多晶体试样,利用晶体的不同取向来改变θ,以满足Bragg方程。
试样要求:粉末,块状晶体。
⏹特点:试样容易获得,衍射花样反映晶体的全面信息。
粉末法:由于多晶体由无数取向无规的单晶组成,相当于单晶绕所有取向的轴转动,晶体内某等同晶面族{HKL}的倒易点,形成-相应倒易矢量gHKL为半径的倒易球。
一系列的倒易球与反射球相交,其交集是一系列园,则相应的衍射线束分布于以样品为中心、入射方向为轴、上述交线园为底的园锥面上。
1.2.5 两者结构分析晶胞结构的不同金红石型二氧化钛及锐钛型二氧化钛结晶类型均为正方结晶,前者为R型,后者为A型。
金红石型二氧化钛晶格结构致密,比较稳定,光化学活性小,因而耐久性由于锐钛型二氧化钛。
二氧化钛结构式
二氧化钛结构式二氧化钛(titanium dioxide,TiO2)是一种重要的功能性无机材料,具有广泛的应用前景。
它存在丰富的晶体结构,包括锐钛矿型(rutile)、金红石型(anatase)、和P42/mnm型(brookite)等。
其中,锐钛矿型和金红石型二氧化钛是最为常见的两种晶体形式。
锐钛矿型二氧化钛的结构式可以用简单的晶体单胞描述,其化学式为TiO2,重复晶胞中含有6个原子,其中正交晶胞中Ti 占据四分之一和O占据八分之三的位置。
锐钛矿晶体结构以其中的Ti原子为顶点及边缘,形成三维的八面体共享晶体结构。
锐钛矿型具有较高的电导率和较高的折射率,广泛应用于太阳能电池、光催化、气体传感等领域。
金红石型二氧化钛的结构式也可用简单的晶体单胞描述,其化学式为TiO2,重复晶胞中含有5个原子,其中正交晶胞中Ti 占据四分之一和O占据四分之三的位置。
金红石型晶体结构以其中的Ti原子为顶点形成四面体共享结构。
金红石型TiO2具有较低的电导率和较低的折射率,常用于纳米材料领域。
P42/mnm型二氧化钛(brookite)的结构式较复杂,其化学式为TiO2,重复晶胞中含有14个原子,其中正交晶胞中Ti占据四分之一和O占据四分之三的位置。
P42/mnm晶体结构通过Ti原子形成多元环结构,其稳定性略低于锐钛矿型和金红石型。
为了更好地理解二氧化钛的结构,研究者们通过X射线衍射方法、单晶电子衍射法、密度泛函理论等多种手段进行了深入研究。
例如,2014年,Li等人通过单晶电子衍射和高分辨透射电镜技术,确定了金红石型二氧化钛的完整晶体结构。
研究发现,金红石型二氧化钛的TiO6八面体存在一定的畸变程度,并且四面体与八面体之间的相互作用对其物理性质具有重要影响。
近年来,随着纳米科学和纳米技术的发展,研究者们也开始对二氧化钛纳米结构进行研究,如纳米颗粒、纳米线、纳米片等。
这些纳米结构的形成与生长机制与二氧化钛的晶体结构有密切关系,对其进行深入研究有助于提高二氧化钛纳米材料的特性和应用。
锐钛型钛白粉与金红石型钛白粉的区别

锐钛型钛白粉与金红石型钛白粉的区别金红石型钛白粉与锐钛型钛白粉是钛白粉的两大重要种类,但是由于两者性质不同,从而也导致了它们各方面的差异,下面来讲讲它们之间到底有什么区别。
钛白粉(二氧化钛)化学性质稳定,在一般情况下与大部分物质不发生反应。
在自然界中二氧化钛有三种结晶:板钛型、锐钛型钛白粉和金红石型钛白粉。
板钛型是不稳定的晶型,无工业利用价值,锐钛型钛白粉(Anatase)简称A型,和金红石型钛白粉(Rutile)简称R型,都具有稳定的晶格,是重要的白色颜料和瓷器釉料,与其他白色颜料比较有优越的白度、着色力、遮盖力、耐候性、耐热性、和化学稳定性,特别是没有毒性。
锐钛型钛白粉,即A型钛白粉。
是一种优良的白色粉末颜料,具有良好的光散射能力,因而白度好,遮盖力强,同时具有较高的化学稳定性,无毒无味,对人体无刺激作用,广泛应用于许多工业领域,如涂料、塑料、造纸及油墨等。
金红石型钛白粉,即R型钛白粉。
结合硫酸法金红石型钛白粉生产质量控制经验,集合无机包膜、有机处理、盐处理、煅烧控制、水解与产品应用等方面的创新研究,采用了先进的色相与粒径控制,锆硅铝磷多元无机包膜和新型的有机处理技术,开发的新一代高档通用型(偏水性)金红石钛白粉。
适用于各种建筑涂料、工业漆、防腐漆、油墨、粉末涂料等行业。
金红石型钛白粉与锐钛型钛白粉是钛白粉的两大重要种类,之所以说它们是钛白粉的两大重要种类,这是由于金红石型钛白粉与锐钛型钛白粉是目前市场上使用最广泛的两大钛白粉系列,但是由于两者性质不同,从而也导致了它们各方面的差异,下面列举说明金红石型钛白粉与锐钛型钛白粉有什么区别:1)内部结构晶体钛白粉共有三种不同的晶体结构,即我们常说的金红石型钛白粉、锐钛型钛白粉、板钛型钛白粉,三者晶体结构各不不同,其中金红石型钛白粉晶体结构最为稳定,而板钛型钛白粉则用途非常少,这主要是由于它内部结构晶体的不稳定,因此在自然界就没办法可以长期稳定的保存起来;2)熔点和沸点由于锐钛型在高温下会转变成金红石型,因此锐钛型二氧化钛的熔点和沸点实际上是不存在的。
怎样辨别出金红石型钛白粉
有一种白色颜料,对我们生活以及工业发展有着重要的作用,它基本上可以应用于各大行业,尤其以涂料、塑料以及造纸行业居多,它就是金红石型钛白粉,属于钛白粉的一种分类,由硫酸法与氯化法制得,环保无毒。
从上世纪开始金红石型钛白粉就已经在不断地发展了,一直火到现在,所以说金红石型钛白粉对各行业的发展来说是非常重要的。
(金红石型钛白粉-图例)【区别金红石型钛白粉】由于金红石型钛白粉太火热,所以市面上难免会有假冒的,这就需要我们正确区分:金红石型钛白粉就是R型钛白粉,我们知道钛白粉分为金红石型和锐钛型,而金红石型的用途十分广泛。
本文就金红石型钛白粉的理化性质、使用范围做一个大致的介绍。
来让大家区分开金红石型钛白粉:该物质无毒,化学性质不活泼,所以通常状况下不与其他其他物质发生反应。
二氧化钛是一种的两性氧化物。
其溶解性不好,不溶于水、脂肪酸和其他有机无机弱酸,微溶于碱溶液和热硝酸,只有在长时间煮沸条件下才能完全溶于浓度硫酸和氢氟酸。
大家都知道,二氧化钛在有三种结晶形态,其中包括金红石型、锐钛型以及板钛型。
金红石型钛白粉有稳定的结晶形态,结构紧密,与锐钛型相比有更高的硬度、密度、介电常数与折光率。
两种类型的钛白粉都属于四方晶系,但具有不相同的晶格。
金红石型的晶体细长,呈棱形,通常是孪晶;而锐钛型一般近似规则的八面体。
廊坊蓝科公司提醒大家,只有金红石型钛白粉最稳定,也只有金红石型可通过热转换获得。
截止到今天,金红石型钛白粉的工业生产方法应用较广的主要有硫酸法和氯化法。
大多数公司钛白粉的生产现采用的是硫酸法。
硫酸法的生产操作程序比较复杂,其基本化学反应由一系列的简单的化学方程构成,硫酸法有三个基本化学反应,他们分别是在酸解、水解和煅烧阶段中发生。
金红石型钛白粉作为高档白色颜料,广泛应用于内、外墙乳胶漆,各种工业涂料,复合油墨、柔版油墨,层压纸,塑料色母粒,粉末涂料等。
涂料行业是钛白粉用的最广泛的领域,特别是金红石型钛白粉,很多被涂料工业所消耗。
锐钛矿、金红石和板钛矿降解罗丹明 B 光催化活性的比较研究
2011Chinese Journal of Catalysis V ol. 32 No. 6文章编号: 0253-9837(2011)06-0983-09 国际版DOI: 10.1016/S1872-2067(10)60222-7 研究论文: 983~991锐钛矿、金红石和板钛矿降解罗丹明B光催化活性的比较张静1,*, 阎松1, 付鹿1, 王飞1, 原梦琼1, 罗根祥1, 徐倩2, 王翔2, 李灿21辽宁石油化工大学化学与材料科学学院,辽宁抚顺1130012中国科学院大连化学物理研究所催化基础国家重点实验室,辽宁大连116023摘要:详细考察并比较了采用低温制备的锐钛矿、金红石和板钛矿氧化钛降解罗丹明B的光催化活性.与传统高温焙烧制备的金红石相比,低温制备的金红石粒径小,比表面积大,表面羟基数目多,因此光催化效率明显增加.更重要的是,当锐钛矿和金红石具有相似粒径和比表面积时,金红石具有较高的光降解罗丹明B活性.对于板钛矿氧化钛而言,虽然其表观光催化活性(单位时间内降解的罗丹明B)远低于锐钛矿或金红石的表观光催化活性,但是其本征光催化活性(单位比表面积、单位时间内降解的罗丹明B)却远远高于锐钛矿或金红石的本征光催化活性.关键词:氧化钛;紫外拉曼;晶相;罗丹明 B; 光催化; 降解中图分类号:O643文献标识码:A收稿日期: 2011-01-23. 接受日期: 2011-03-15.*通讯联系人. 电话: (0413)6863390; 传真: (0413)6860548; 电子信箱: jingzhang_dicp@基金来源: 国家自然科学基金 (20903054).本文的英文电子版(国际版)由Elsevier出版社在ScienceDirect上出版(/science/journal/18722067).Photocatalytic Degradation of Rhodamine B on Anatase, Rutile,and Brookite TiO2ZHANG Jing1,*, YAN Song1, FU Lu1, WANG Fei1, YUAN Mengqiong1, LUO Genxiang1,XU Qian2, WANG Xiang2, LI Can21School of Chemistry and Materials Science, Liaoning Shihua University, Fushun 113001, Liaoning, China2State Key Laboratory of Catalysis, Dalian Institute of Chemical Physics, Chinese Academy of Sciences, Dalian 116023, Liaoning, ChinaAbstract: This study compared the photocatalytic activities for the degradation of Rhodamine B (RhB) in aqueous solutions of anatase, rutile, and brookite TiO2. The TiO2 powders were prepared at low temperature. As compared with rutile obtained by a conventional high temperature calcination, the rutile TiO2 prepared by the low temperature route had a smaller particle size, higher surface area, and more sur-face hydroxyl groups, and it gave a high photocatalytic activity. Rutile gave a faster photocatalysis reaction rate than anatase TiO2 for the same particle size and surface area. A pure brookite phase showed a lower photocatalytic activity when this was expressed in moles con-verted RhB per hour than the anatase and rutile phases. However, its areal photocatalytic activity expressed in moles converted RhB per hour per surface area was much higher than that of anatase and rutile TiO2.Key words:titania; ultra-violet Raman spectroscopy; crystal phase; Rhodamine B; photocatalysis; degradationReceived 23 January 2011. Accepted 15 March 2011.*Corresponding author. Tel: +86-413-6863390; Fax: +86-413-6860548; E-mail: jingzhang_dicp@This work was supported by the National Natural Science Foundation of China (20903054).English edition available online at Elsevier ScienceDirect (/science/journal/18722067).Heterogeneous photocatalysis is an attractive approach for the removal of inorganic and organic pollutants in air and water [1]. Among the various semiconductors, TiO2 is the most used photocatalyst because of its high efficiency, non-toxicity, chemical and biological stability, and low cost [2–4]. The catalytic performance of TiO2 is a function of984 催化学报Chin. J. Catal., 2011, 32: 983–991many factors, such as the phase structure, specific surface area, crystallite size, particle shape, and amount of surface hydroxyl groups [5,6]. The crystalline phase of the TiO2 plays a significant role in the photocatalysis [7,8]. TiO2 has three natural crystalline phases: anatase (tetragonal), rutile (tetragonal), and brookite (orthorombic). Rutile is the stable form, and anatase and brookite are metastable. The anatase phase and brookite phase transforms into the rutile phase over a wide range of temperatures [9].There are many studies on the photocatalytic activity of TiO2 in its different phases [10,11]. It is usually accepted that anatase is more efficient as a photocatalyst than rutile [12], and pure rutile is rarely active for the photodegrada-tion of organic species in aqueous solutions [13,14]. How-ever, some works have indicated that rutile titania can pos-sess high photocatalytic activity [15,16]. There are still dis-agreements on the effects of the TiO2 crystalline structure on its photocatalytic activity [17,18]. Therefore, it is of im-portance to investigate and compare the intrinsic photocata-lytic activity of TiO2 of different crystal phases.In contrast to the extensive researches on the anatase and rutile phases, few studies [19] have examined the photo-catalytic activity of pure brookite TiO2 powders or films. This is mainly because pure brookite TiO2 without any rutile or anatase phase is difficult to prepare [20]. In fact, Ohtani et al. [21] found that brookite nanocrystals possessed good photocatalytic activities for silver deposition and de-hydrogenation of 2-propanol.This paper is a contribution to the understanding of the effect of the crystalline phase on the photocatalytic activity of TiO2, and it provides new insights for designing TiO2 photocatalysts. Pure anatase, rutile, and brookite TiO2 were prepared and characterized by UV Raman spectroscopy, visible Raman spectroscopy, X-ray diffraction (XRD), dif-fuse reflectance spectroscopy (DRS), transmission electron microscopy (TEM), scanning electron microscopy (SEM), and N2 adsorption (BET). Their photocatalytic activities were compared for the photocatalytic degradation of Rho-damine B (RhB).1 Experimental1.1 Preparation of anatase and rutile TiO2Titanium chloride (98% TiCl4, China National Medicines Corporation Ltd.) was used as a precursor without further purification. It was added slowly into distilled water in an ice water bath to slow down the rapid exothermic reaction [22]. The concentration of TiCl4 in the solution was 2 mol/L. Distilled water was added to the solution to get a transparent stock solution with a TiCl4 concentration of 0.5 mol/L (pH value of the stock solution was 1.3).The stock solution was divided into two parts. One part was heated at 70 o C for 5 h under stirring (denoted as TiCl4-1). Ammonia solution was added to the other part of the stock solution under stirring until the pH of the solution reached 5. Then the solution obtained was stirred at 70 o C for 5 h (denoted as TiCl4-2). TiCl4-1 and TiCl4-2 obtained were centrifuged and washed with distilled water until chlo-ride ions were not detected in the washed water. The solid sample was dried at 120 o C for 12 h, then calcined in air at 300 and 500 o C for 2 h.1.2 Preparation of brookite TiO2The preparation of brookite TiO2 followed the procedure of Yang et al. [23]. The sodium hydroxide solution (2 mol/L) was added dropwise to a solution of 1 mol/L tita-nium sulfate (Ti(SO4)2) under stirring at room temperature. The molar ratio of NaOH to Ti(SO4)2 was maintained at 5:1. The precipitate was separated by filtering and washed with water three times. Then the slurry was sealed in a Tef-lon-lined stainless steel autoclave and hydrothermally treated at 200 o C for 24 h, cooled naturally to room tem-perature, filtered, washed, dried in air at 120 o C for 12 h, and calcined at 400 o C for 2 h. In this synthesis procedure, the molar ratio of alkali ion to titanium ion, hydrothermal synthesis temperature, and duration of the hydrothermal treatment used were important.1.3 CharacterizationUV Raman spectra were measured at room temperature with a Jobin-Yvon T64000 triple-stage spectrograph with a spectral resolution of 2 cm−1. The laser line at 325 nm of a He-Cd laser was used as the exciting source with an output of 25 mW.Visible Raman spectra were recorded at room tempera-ture on a Jobin-Yvon U1000 scanning double monochro-mator with a spectral resolution of 4 cm−1. The line at 532 nm from a DPSS 532 Model 200 532 nm single-frequency laser was used as the excitation source.X-ray powder diffraction (XRD) patterns were obtained on a Rigaku MiniFlex diffractometer with Cu Kα radiation source. Diffraction patterns were collected from 20°~60° at a speed of 5°/min.Transmission electron microscopy (TEM) images taken on a JEOL 2000EX were used for estimating particle size and morphology.The morphology was also characterized using scanning electron microscope (SEM) QUANTA 200F. Ultravio-let-visible diffuse reflectance spectra were recorded on a JASCO V-550 UV-Vis spectrophotometer.The Brunauer-Emmett-Teller (BET) surface areas of the 张 静 等: 锐钛矿、金红石和板钛矿降解罗丹明 B 光催化活性的比较 985TiO 2 samples were measured by nitrogen adsorption at 77 Kusing a Micromeritics ASAP 2000 adsorption analyzer. 1.4 Photocatalytic activity testThe photocatalytic degradation experiments were per-formed with the photodegradation of RhB carried out in a 100 ml Pyrex reactor filled with ion-exchanged water (60 ml) containing RhB (20 mg/L, 2.5 × 10⁻⁶ mol) and TiO 2 sample. The suspension was stirred for 30 min in the dark to give adsorption-desorption equilibrium of the dye before illumination. After irradiation with a 250 W high voltage mercury lamp (λ = 365 nm, Shanghai Yaming Lighting Co.) with an intensity of 1.7 mW/cm 2, a 3 ml aliquot was taken every 10 min, which was immediately centrifuged. The RhB concentration in the clear solution was analyzed by optical absorption (22PC spectrophotometer, Shanghai Lengguang Technology Co., LTD) at 553 nm. Blank experiments with the mercury lamp and without catalysts under the same conditions were performed. The blank study showed that there was no photolysis of RhB.2 Results and discussion2.1 UV Raman spectra, visible Raman spectra, and XRD analysis 2.1.1 Rutile TiO 2Figure 1 displays the XRD patterns and UV Raman spec-trum of a dried TiCl 4-1 sample. The XRD measurement showed that the TiCl 4-1 sample existed in the rutile phase because only the characteristic peaks of the rutile phase (27.6o , 36.1o , 41.2o , and 54.3o ) were observed [24]. In the UV Raman spectra, only typical rutile Raman bands (235, 444, and 612 cm –1) were observed, indicating the formation of a pure rutile TiO 2 phase. The XRD patterns and UV Ra-man spectra of rutile TiO 2 calcined at 300 and 500 o C (Fig. 1(a) and (b)) showed that the characteristic peaks of rutile TiO 2 increased in intensity and decreased in band width with increasing calcination temperature.The average crystallite size of rutile TiO 2 was calculated using Scherrer’s equation D = k λ/βcos θ, where D is the crystallite size, k the Scherrer constant (k = 0.9 assuming that the particles are spherical), λ the wavelength of the X-ray radiation (Cu K α radiation, λ = 0.15406 nm), β the line width (obtained after correction for instrumental broadening), and θ is the diffraction peak angle. The aver-age crystallite sizes of rutile calcined at the different tem-peratures were determined to be 6.5, 14.2, and 30.3 nm, respectively (Table 1). The above changes in the XRD and UV Raman peaks can be attributed to that the crystallite size and crystallinity of rutile increased gradually with calcina-tion temperature [25,26].We also characterized a commercial rutile TiO 2 (Alfa Aesar) by XRD and UV Raman spectra (Fig. 1). The UV Raman spectrum (Fig. 1(b)) suggested that a small amount of anatase phase existed in the commercial rutile TiO 2 al-though only rutile peaks were observed in the XRD pattern (Fig. 1(a)). This may be mainly due to that the rutile was20304050607080100200300400500600700800900(4)(4)(3)(2)(1)(a)I n t e n s i t y (a .u .)2θ/( o)RRARA: anataseR: rutile(1)(2)(3)× 3(b)I n t e n s i t y (a .u .)Raman shift (cm −1)Fig. 1. XRD patterns (a) and UV Raman spectra (b) of rutile TiO 2 calcined at 120 o C (1), 300 o C (2), and 500 o C (3) and commercial rutile TiO 2 (4).Table 1 Crystallite size and specific surface area of anatase, rutile, and brookite TiO 2 derived from XRD and N 2-adsorption SampleCalcination temperature (oC)D /nmBET surface area (m 2/g)Anatase 120 6.3 306.3300 13.4 134.0 500 26.7 76.9Rutile 120 6.5 303.4300 14.2 109.4 500 30.3 62.2 Commercial rutile— 500a6.1Brookite 120 46.8 19300 50.6 12 aParticle size from SEM.986 催 化 学 报 Chin . J . Catal ., 2011, 32: 983–991prepared by the calcination of the anatase phase at high temperatures. However, the anatase phase did not com-pletely transform into rutile, thus there were small amounts of anatase TiO 2 in the commercial rutile sample. It is diffi-cult to detect the existence of anatase TiO 2 by XRD when its content is less than 5% [27]. As compared with XRD, a small amount of the anatase phase can be sensitively de-tected by UV Raman spectroscopy.XPS was also used to investigate the surface composition and chemical state of the dried TiCl 4-1 and the commercial rutile. The XPS spectra of Ti 2p and O 1s are shown in Fig. 2. In Fig. 2(a), the two peaks located at 458.4 and 464.1 eV were assigned to Ti 2p 3/2 and Ti 2p 1/2, respectively. These results demonstrated that Ti existed mainly in the +4 va-lence state in the two rutile samples [28]. As illustrated in Fig. 2(b), there were at least two O chemical states, which included those of crystal lattice oxygen (529.3 eV) and hy-droxyl oxygen (531.4 eV) [29,30] in the two O 1s XPS spectra. The peak at 529.3 eV was attributed to Ti–O in the TiO 2 crystal lattice. The other oxygen contribution could be attributed to the hydroxyl group (OH), with its peak position at 531.4 eV. It was obvious that the hydroxyl content in theprepared rutile was more than that in the commercial rutile sample, indicating the loss of surface hydroxyl species from the latter during the high temperature treatment. 2.1.2 Anatase TiO 2Figure 3 shows visible Raman spectra and UV Raman spectra of TiCl 4-2 samples after these were dried at 120 o C and calcined at different temperatures. Six Raman bands at 143, 195, 395, 514, 519 (superimposed with the 514 cm –1 band), and 635 cm –1 were observed both in the visible Ra-man spectrum and UV Raman spectrum. These bands can be attributed to the six Raman-active modes of the anatase phase with the symmetries of E g , E g , B 1g , A 1g , B 1g , and E g , respectively [31]. These results in the visible and UV Ra-man spectra indicated that the TiCl 4-2 powder was a pure anatase phase. In order to study the thermal stability of the anatase TiO 2 nanoparticles, we calcined the anatase TiO 2 powder at different temperatures (300 and 500 o C) for 2 h. With the increasing of the calcination temperature to 300 oC, the high frequency region in the visible Raman spectra (Fig. 3(a)) showed interference by fluorescence. However,450455460465470475525530535540545522527532537(1)(a)Ti 2p 1/2 464.1Ti 2p 3/2 458.4(2)I n t e n s i t y (a .u .)Binding energy (eV)Binding energy (eV)Binding energy (eV)(1)(2)531.4529.3(b)I n t e n s i t y (a .u .)dried rutile531.4529.3Fig. 2. XPS spectra of Ti 2p (a) and O 1s (b) of dried TiCl 4-1 (1) and commercial rutile (2).10020030040050060070080090010001002003004005006007008009001000× 3(a)I n t e n s i t y (a .u .)Raman shift (cm −1)143395514635500 o C300 o C120 o C(b)× 3195I n t e n s i t y (a .u .)Raman shift (cm −1)143395514635500 o C300 o C 120 o CFig. 3. Visible Raman spectra (a) and UV Raman spectra (b) of the TiCl 4-2 samples calcined at different temperatures. 张静等:锐钛矿、金红石和板钛矿降解罗丹明B光催化活性的比较 987 the fluorescence can be avoided when a UV laser line (325nm) was used as the excitation line for UV Raman spectra(Fig. 3(b)). After calcination at 500 o C, most of the bands inthe UV and visible Raman spectra became narrow and in-tense, which was due to the increasing of particle size andcrystallinity with the higher calcination temperature. Ac-cording to the results, pure anatase or rutile phase TiO2 witha similar crystallite size and surface area can be obtained bycontrolling the pH value when TiCl4 was used as precursor.This made it possible to systematically investigate andcompare the photocatalytic performances of pure anataseand rutile TiO2 nanoparticles.2.1.3 Brookite TiO2Figure 4 shows XRD, visible Raman spectra, and UVRaman spectra of dried brookite and brookite calcined at400 o C. According to the XRD results (Fig. 4(a)), the TiO2powder dried at 120 o C had crystallized and all the XRDdiffraction patterns can be indexed to brookite TiO2 (JCPDS29-1360), with the peaks at 25.34o, 25.69o, and 30.81o as thediffraction from the (120), (111), and (121) planes ofbrookite, respectively. In the visible Raman spectrum (Fig.4(b)), there were fifteen Raman-active modes for thebrookite phase with the symmetries of A1g (122, 149, 192,244, 405, and 630 cm–1); B1g (212, 321, and 504 cm–1); B2g(364, 392, 463, and 583 cm–1), and B3g (284 and 455 cm–1).In the UV Raman spectrum (Fig. 4(c)), typical brookiteRaman bands at 121, 150, 244, 284, 321, 363, 402, 487,542, and 630 cm–1 were observed. These results indicatedthat a pure brookite phase was obtained and the brookitewas stable after annealing up to 300 o C.In addition, by comparing the visible Raman spectra (Fig.4(b)) and UV Raman spectra of the brookite phase (Fig.4(c)) excited by 532 and 325 nm lines, it was found that therelative intensities of the characteristic bands due to thebrookite phase in the high frequency region were different. The intensity of the band at 244 cm–1 was stronger than that of the band at 284 cm–1 in the visible Raman spectrum but the intensities of these two bands were comparable in the UV Raman spectrum. That the relative intensities of the Raman bands of the brookite phase were different for UV Raman spectroscopy and visible Raman spectroscopy was mainly due to the UV resonance Raman effect [32].2.2 UV visible diffuse reflectance spectraUV-Vis DRS of the TiO2 samples were recorded to ob-tain insight into their light absorption characteristics. Typi-cal results are shown in Fig. 5. The optical absorption of TiO2 in the wavelength range shorter than 390 nm is mainly associated with the O2−→Ti4+ charge transfer, which is re-lated to electron excitation from the valence band to the conduction band [33]. As compared with dried anatase and rutile TiO2, the band edge showed a red shift (decrease in band gap energy) with increasing calcination temperature. For example, as compared with dried rutile TiO2, there was a shift in the absorption edge of 9 nm from that observed with the rutile sample calcined at 500 o C. The decrease in band gap energy can be attributed to the increase of the par-ticle size of rutile TiO2 (from 6.5 to 30.3 nm).Figure 5(c) compares the UV-Vis DRS of anatase, rutile, and brookite TiO2. For the anatase, rutile, and brookite phases, the absorption band edges were estimated to be 390, 412, and 370 nm, respectively. The adsorption edge shifted towards shorter wavelengths in the sequence of rutile, ana-tase, and brookite TiO2, which clearly indicated a gradual increase of the band gap. The band gap energies were cal-2030405060701002003004005006007008001002003004005006007008002θ/( o )(a)Intensity(a.u.)(2)(1)(2)(1)(b)122149212321284244453634945554258363Intensity(a.u.)Raman shift (cm−1)(c)(2)(1)6354248742363321284244147121Intensity(a.u.)Raman shift (cm−1)Fig. 4.XRD patterns (a), visible Raman spectra (b), and UV Raman spectra (c) of dried brookite (1) and brookite calcined at 300 o C (2).988 催 化 学 报Chin . J . Catal ., 2011, 32: 983–991culated according to the formula [34] E g = 1240/(λg ), where λg is the wavelength corresponding to the intersection point of the vertical and horizontal parts of the spectra in Fig. 5(c). Thus, the calculated band energies of rutile, anatase, and brookite were 3.0, 3.13, and 3.35 eV, respectively. 2.3 TEM (SEM) and BET analysisThe morphologies of the anatase and rutile TiO 2 samples were analyzed by TEM (Fig. 6). Figures 6(a) and (c) show the images of dried anatase and rutile TiO 2 powders. The aggregated anatase particles consisted of many nearly spherical nanoparticles, while the aggregated rutile particles consist of many needlelike nanoparticles. The mean crystal-lite size of the primary anatase nanoparticles was 5 nm and the mean diameter of the needlelike primary rutile nanopar-ticles was 7 nm.A clear increase in the particle size of anatase and rutile TiO 2 was observed with an increase in the calcination tem-perature (Fig. 6(b) and (d)). These results are in agreement with those obtained by the Scherrer’s equation. The SEM results (Fig. 7(a)) showed that the prepared brookite powder had an ellipsoidal morphology of 50 nm (diameter) × 80 nm (length). After calcination at 300 o C, there was no obvious change in particle size (Fig. 7(b)) and specific surface area for brookite TiO 2 (Table 1).2.4 Photocatalytic activity of anatase, rutile, and brookite TiO 2RhB is an important chemical used widely in industrial production, which often causes environmental pollution [35]. Therefore, it was chosen as representative of organic pollutants to evaluate the photocatalytic activity of the ana-tase, rutile, and brookite TiO 2 samples. In a photodegrada-tion process, photoexcited electrons (e −) are transferred to the conduction band (CB) from the valence band (VB), while holes (h +) are formed in the VB when an oxide semi-conductor (TiO 2) is irradiated with light (Fig. 8) [1]. These electrons and holes can migrate to the oxide surface andA b s o r b a n c e (a .u .)A b s o r b a n c e (a .u .)Wavelength (nm)I n t e n s i t y (a .u .)Fig. 5. UV-Vis reflectance spectra of anatase (a) and rutile (b) TiO 2calcined at different temperatures, and the comparison of UV-Vis DRS of anatase, rutile, and brookite TiO 2 (c).(c)(A)a)(A)a) (a)(B)b) (B)b) (b)(d)Fig. 6. TEM images of anatase (a), anatase calcined at 500 o C (b), rutile (c), and rutile calcined at 500 o C (d).(A)(B)(a)(b)Fig. 7. SEM images of brookite TiO 2 (a) and brookite TiO 2 (b) cal-cined at 300 o C. 张 静 等: 锐钛矿、金红石和板钛矿降解罗丹明 B 光催化活性的比较 989participate in half-cell reactions that form a closed catalyticcycle. The photoexcited holes in the VB can form the hy-droxyl radical •OH (e.g. h + + OH − → •OH, h + + H 2O → •OH) that can oxidize organic pollutants and the electrons in the CB participate in a reduction process.)22H 5)2νdegradation 2Fig. 8. Schematic of the photocatalytic mechanism for TiO 2.For anatase TiO 2 calcined at different temperatures, the only-dried anatase TiO 2 showed the highest photodegrada-tion of RhB, and the photocatalytic activity gradually de-creased as the thermal treatment temperature increased (Fig. 9). As compared with the only-dried sample, the TiO 2 sam-ple calcined at 300 o C showed more crystallization (Fig. 3). A high anatase crystallinity usually means fewer defects, which act as the recombination centers for photogenerated electrons and holes [36,37]. Thus, a high crystallinity would promote photocatalytic reactions. However, the surface ar-eas were adversely decreased from 306.3 to 134.0 m 2/g (Ta-ble 1) when the calcination temperature was increased from 120 to 300 o C. The higher surface area has an active role in the adsorption of the reactant, which results in a higher photocatalytic activity [38]. Thus, it was deduced that the decrease in the activity for the anatase calcined at the high temperature can be mainly attributed to the large decrease in the surface area shown in Table 1. For rutile TiO 2 calcined at different temperatures, as expect, the calcined powder samples showed decreased photocatalytic activities.The conversion of RhB was significantly higher for the synthesized rutile TiO 2 sample after 1 h of reaction (74%) as compared to the commercial rutile TiO 2 sample (12%) (Fig. 9). As shown in Table 1, as compared with the com-mercial rutile TiO 2, the synthesized rutile TiO 2 had a smaller crystallite size and larger BET surface area. The decrease in the particle size of the synthesized rutile en-hanced the photoinduced charge transfer from the bulk of the particles to surface-absorbed reactants [39]. Moreover, the larger specific surface area of the synthesized rutile photocatalyst provided more adsorption sites for the RhB[38].In addition, an increase of OH groups was observed for synthesized rutile as compared with the commercial rutile in the XPS results (Fig. 2). Hu et al. [40] reported that an in-crease of the hydroxyl content on the surface of TiO 2 will increase the amount of •OH (h + + OH → •OH) produced on the surface of TiO 2, and the photocatalytic activity was en-hanced. Therefore, the higher reactivity of the synthesized rutile was attributed to the small particle size, large surface area, and the abundance of surface hydroxyl groups.Furthermore, it is interesting to note that synthesized rutile TiO 2 displayed a faster photocatalysis reaction rate for the degradation of RhB as compared with anatase TiO 2 (Fig. 9) when they had a similar particle size and surface area. We found that the adsorption of RhB on the surface of ana-tase and rutile were similar (8% and 5%). Sun et al. [27] also showed that their laboratory-synthesized rutile titania gave a higher activity in the degradation of phenol in water than the anatase phase with a similar surface area. They attributed the higher photocatalytic activity of rutile TiO 2 to there being more hydroxyl groups on the surface of rutile. In addition, the charge separation between photoexcited elec-trons and holes may be improved by the exposed crystal surface of the needlelike rutile nanoparticles, resulting in the improvement of photocatalytic activity [41].The pure brookite samples gave good photocatalytic ac-tivity (34.7%, Fig. 9) for the degradation of RhB in spite of the high value of E g and low surface area (19 m 2/g, Table 1). It should be noted that the surface area of brookite was lower by 15 times than those of the anatase and rutile. This was the main reason why the degradation efficiency of brookite was lower than that of anatase and rutile. Sclafani et al. [42] suggested that the factor of the BET surface area should be eliminated in order to give information on the areal photocatalytic properties of the photocatalyst. There-fore, the areal photoactivities, expressed in moles converted20406080Calcination temperature (o C)c o m m e r c i a l r u t i l eanatase rutile brookite500 o C 300 o C 120 o C C o n v e r s i o n o f R h B (%)Fig. 9. Photocatalytic activity for RhB on anatase, rutile, and brookite TiO 2 samples calcined at different temperatures.990 催 化 学 报 Chin . J . Catal ., 2011, 32: 983–991RhB per hour per surface area, of the TiO 2 samples with different crystal phases were compared (Fig. 10). It can be seen from Fig. 9 that anatase and rutile showed higher photocatalytic conversion than brookite TiO 2 under identical conditions. However, the areal photocatalytic activity was higher with brookite TiO 2 (Fig. 10). These results indicated that high crystallinity and large surface area pure brookite can be used as an effective photocatalyst.102030405060C o n v e r s i o n o f R h B m o l /(h ⋅(m 2/g ))×106Calcination temperature (oC)anatase rutile brookite500 oC 300 o CFig. 10. Areal photocatalytic activity for removal of RhB with ana-tase, rutile, and brookite TiO 2 calcined at different temperatures.The atomic symmetry of a unit cell of brookite is de-scribed by the space group Pbca. The octahedra arrange-ment produces a crystalline structure with tunnels along the c-axis in which small cations, like hydrogen or lithium, could be incorporated [43]. In addition, it was proposed that the crystal planes perpendicular to the [100] direction is completed by exposing oxygen atoms, which act as the ac-tive atoms of catalytic reactions [43]. Thus brookite is a potential material for applications in electronics and cataly-sis, besides anatase, and rutile. Some researchers have found that pure brookite nanocrystals obtained by the reaction of a mixed solution of urea and TiCl 3 showed good photocata-lytic properties for the degradation of acetaldehyde [44] and 4-chlorophenol [45], although the activity was lower than that of Degussa P25.2.5 Long term stability of the anatase, rutile, and brookite TiO 2 photocatalystsTo evaluate the stability of the catalysts, repeated ex-periments for the photodegradation of RhB were performed with anatase, ruitle, and brookite calcined at 300 o C. The results are shown in Fig. 11. After each photocatalytic reac-tion, the catalyst was recovered and washed with deionized water for reuse. The next cycle was started after setting the initial concentration of MB to 20 mg/L. As illustrated in the inset in Fig. 11, after three cycles, the catalytic activities of the three photocatalysts were slightly decreased but still maintained very high, indicating the good stability of theanatase, rutile, and brookite. However, obvious decreases of the photocatalytic activities for anatase, rutile, and brookite were found after four recycles. These decreases may be attributed to the coverage of the surface of the photocata-lysts by RhB molecules, which are very difficult to remove [46].1020304050rutileanatasefirst cycle second cycle third cycle fourth cycleC o n v e r s i o n o f R h B (%)Fig. 11. Stability of the anatase, rutile, and brookite samples shownby four reaction cycles for photodegradation of RhB.3 ConclusionsPure anatase, rutile, and brookite TiO 2 phases were syn-thesized at low temperature and characterized. The photo-catalytic degradation of RhB on these titania phases (ana-tase, rutile, and brookite) in an aqueous phase was investi-gated and compared. The lower photocatalytic activity of rutile TiO 2 prepared by conventional high temperature cal-cination was due to the large crystalline size, small surface area, and small amount of hydroxyl group on the surface. In the RhB degradation reaction, the rutile TiO 2 powder pre-pared in our lab was found to have a higher photocatalytic activity than that of anatase TiO 2 with a similar particle size and specific surface area. With brookite TiO 2, the observed photocatalytic activity was lower than that of anatase and rutile TiO 2 because of its high value of E g and low surface area. However, the areal photocatalytic activity, expressed in moles converted RhB per hour per surface area, was the highest among these three crystalline phases of TiO 2. These results indicated that high crystallinity and large surface area pure brookite can be used as an effective photocatalyst. This study provided new insights for designing new TiO 2 photocatalysts.References1 Fox M A, Dulay M T. Chem Rev , 1993, 93: 3412 匡继董, 林碧洲, 陈亦琳, 骈雪涛, 张克智, 张鸥. 催化学报 (Kuang J D, Lin B Z, Chen Y L, Pian X T, Zhang K Zh, Zhang O. Chin J Catal ), 2010, 31: 13993 Zhang K, Meng Z, OH W. Chin J Catal (催化学报), 2010, 31:。