经贸英语阅读教程Text 10
Horngren14e_SM_Ch10
CHAPTER 10DETERMINING HOW COSTS BEHAVE10-1The two assumptions are1. Variations in the level of a single activity (the cost driver) explain the variations in therelated total costs.2. Cost behavior is approximated by a linear cost function within the relevant range. Alinear cost function is a cost function where, within the relevant range, the graph of total costs versus the level of a single activity forms a straight line.10-2 Three alternative linear cost functions are1. Variable cost function––a cost function in which total costs change in proportion to thechanges in the level of activity in the relevant range.2. Fixed cost function––a cost function in which total costs do not change with changes inthe level of activity in the relevant range.3. Mixed cost function––a cost function that has both variable and fixed elements. Totalcosts change but not in proportion to the changes in the level of activity in the relevant range.10-3 A linear cost function is a cost function where, within the relevant range, the graph of total costs versus the level of a single activity related to that cost is a straight line. An example of a linear cost function is a cost function for use of a videoconferencing line where the terms are a fixed charge of $10,000 per year plus a $2 per minute charge for line use. A nonlinear cost function is a cost function where, within the relevant range, the graph of total costs versus the level of a single activity related to that cost is not a straight line. Examples include economies of scale in advertising where an agency can double the number of advertisements for less than twice the costs, step-cost functions, and learning-curve-based costs.10-4No. High correlation merely indicates that the two variables move together in the data examined. It is essential also to consider economic plausibility before making inferences about cause and effect. Without any economic plausibility for a relationship, it is less likely that a high level of correlation observed in one set of data will be similarly found in other sets of data.10-5Four approaches to estimating a cost function aremethod.1. Industrialengineeringmethod.2. Conferencemethod.analysis3. Account4. Quantitative analysis of current or past cost relationships.10-6The conference method estimates cost functions on the basis of analysis and opinions about costs and their drivers gathered from various departments of a company (purchasing, process engineering, manufacturing, employee relations, etc.). Advantages of the conference method include1. The speed with which cost estimates can be developed.2. The pooling of knowledge from experts across functional areas.3. The improved credibility of the cost function to all personnel.10-7The account analysis method estimates cost functions by classifying cost accounts in the subsidiary ledger as variable, fixed, or mixed with respect to the identified level of activity. Typically, managers use qualitative, rather than quantitative, analysis when making these cost-classification decisions.10-8The six steps are1. Choose the dependent variable (the variable to be predicted, which is some type of cost).2. Identify the independent variable or cost driver.3. Collect data on the dependent variable and the cost driver.thedata.4. Plot5. Estimate the cost function.6. Evaluate the cost driver of the estimated cost function.Step 3 typically is the most difficult for a cost analyst.10-9Causality in a cost function runs from the cost driver to the dependent variable. Thus, choosing the highest observation and the lowest observation of the cost driver is appropriate in the high-low method.10-10Three criteria important when choosing among alternative cost functions areplausibility.1. Economicfit.of2. Goodness3. Slope of the regression line.10-11 A learning curve is a function that measures how labor-hours per unit decline as units of production increase because workers are learning and becoming better at their jobs. Two models used to capture different forms of learning are1. Cumulative average-time learning model. The cumulative average time per unit declinesby a constant percentage each time the cumulative quantity of units produced doubles. 2. Incremental unit-time learning model. The incremental time needed to produce the lastunit declines by a constant percentage each time the cumulative quantity of units produced doubles.10-12Frequently encountered problems when collecting cost data on variables included in a cost function are1. The time period used to measure the dependent variable is not properly matched with thetime period used to measure the cost driver(s).2. Fixed costs are allocated as if they are variable.3. Data are either not available for all observations or are not uniformly reliable.4. Extreme values of observations occur.5. A homogeneous relationship between the individual cost items in the dependent variablecost pool and the cost driver(s) does not exist.6. The relationship between the cost and the cost driver is not stationary.7. Inflation has occurred in a dependent variable, a cost driver, or both.10-13 Four key assumptions examined in specification analysis are 1. Linearity of relationship between the dependent variable and the independent variablewithin the relevant range.2. Constant variance of residuals for all values of the independent variable.3. Independence of residuals.4. Normal distribution of residuals.10-14 No. A cost driver is any factor whose change causes a change in the total cost of a related cost object. A cause-and-effect relationship underlies selection of a cost driver. Some users of regression analysis include numerous independent variables in a regression model in an attempt to maximize goodness of fit, irrespective of the economic plausibility of the independent variables included. Some of the independent variables included may not be cost drivers.10-15 No. Multicollinearity exists when two or more independent variables are highly correlated with each other.10-16 (10 min.) Estimating a cost function.1. Slope coefficient = Difference in costsDifference in machine-hours= $5,400$4,00010,0006,000−−= $1,4004,000= $0.35 per machine-hourConstant = Total cost – (Slope coefficient × Quantity of cost driver) = $5,400 – ($0.35 × 10,000) = $1,900 = $4,000 – ($0.35 × 6,000) = $1,900The cost function based on the two observations is Maintenance costs = $1,900 + $0.35 × Machine-hours 2. The cost function in requirement 1 is an estimate of how costs behave within the relevant range, not at cost levels outside the relevant range. If there are no months with zero machine-hours represented in the maintenance account, data in that account cannot be used to estimate the fixed costs at the zero machine-hours level. Rather, the constant component of the cost function provides the best available starting point for a straight line that approximates how a cost behaves within the relevant range.10-17 (15 min.)Identifying variable-, fixed-, and mixed-cost functions.1. See Solution Exhibit 10-17.2. Contract1:y = $50Contract2:y = $30 + $0.20XContract3:y = $1XwhereX is the number of miles traveled in the day.3. Contract Cost Function123 Fixed Mixed VariableSOLUTION EXHIBIT 10-17Plots of Car Rental Contracts Offered by Pacific Corp.10-18(20 min.) Various cost-behavior patterns.1. K2. B3. G4. J Note that A is incorrect because, although the cost per pound eventually equals aconstant at $9.20, the total dollars of cost increases linearly from that point onward.5. I The total costs will be the same regardless of the volume level.6. L7. F This is a classic step-cost function.8. K9. C10-19 (30 min.) Matching graphs with descriptions of cost and revenue behavior.a.(1)b.(6) A step-cost function.c.(9)d.(2)e.(8)f.(10) It is data plotted on a scatter diagram, showing a linear variable cost function withconstant variance of residuals. The constant variance of residuals implies thatthere is a uniform dispersion of the data points about the regression line.g.(3)h.(8)10-20 (15 min.) Account analysis method.1. Variable costs:Car wash labor $260,000Soap, cloth, and supplies 42,000Water 38,000Electric power to move conveyor belt 72,000Total variable costs $412,000Fixedcosts:Depreciation $ 64,000Salaries 46,000Total fixed costs $110,000Some costs are classified as variable because the total costs in these categories change in proportion to the number of cars washed in Lorenzo’s operation. Some costs are classified as fixed because the total costs in these categories do not vary with the number of cars washed. If the conveyor belt moves regardless of the number of cars on it, the electricity costs to power the conveyor belt would be a fixed cost.2.Variable costs per car = $412,00080,000= $5.15 per carTotal costs estimated for 90,000 cars = $110,000 + ($5.15 × 90,000) = $573,50010-21 (20 min.) Account analysis1. The electricity cost is variable because, in each month, the cost divided by the number of kilowatt hours equals a constant $0.30. The definition of a variable cost is one that remains constant per unit.The telephone cost is a mixed cost because the cost neither remains constant in total nor remains constant per unit.The water cost is fixed because, although water usage varies from month to month, the cost remains constant at $60.2. The month with the highest number of telephone minutes is June, with 1,440 minutes and $98.80 of cost. The month with the lowest is April, with 980 minutes and $89.60. The difference in cost ($98.80 – $89.60), divided by the difference in minutes (1,440 – 980) equals $0.02 per minute of variable telephone cost. Inserted into the cost formula for June:$98.80 = a fixed cost + ($0.02 × number of minutes used)$98.80 = a + ($0.02 × 1,440)$98.80 = a + $28.80a = $70 monthly fixed telephone costTherefore, Java Joe’s cost formula for monthly telephone cost is:Y = $70 + ($0.02 × number of minutes used)3. The electricity rate is $0.30 per kw hourThe telephone cost is $70 + ($0.02 per minute)The fixed water cost is $60Adding them together we get:Fixed cost of utilities = $70 (telephone) + $60 (water) = $130Monthly Utilities Cost = $130 + (0.30 per kw hour) + ($0.02 per telephone min.)4. Estimated utilities cost = $130 + ($0.30 × 2,200 kw hours) + ($0.02 × 1,500 minutes)= $130 + $660 + $30 = $82010-22 (30 min.) Account analysis method. 1. Manufacturing cost classification for 2012:Account TotalCosts(1)% ofTotal CostsThat isVariable(2)VariableCosts(3) = (1) ×(2)FixedCosts(4) = (1) – (3)VariableCost per Unit(5) = (3) ÷ 75,000Direct materialsDirect manufacturing labor PowerSupervision labor Materials-handling labor Maintenance labor DepreciationRent, property taxes, admin $300,000225,00037,50056,25060,00075,00095,000100,000100%100100205040$300,000225,00037,50011,25030,00030,000$ 045,00030,00045,00095,000100,000$4.003.000.500.150.400.40Total $948,750 $633,750 $315,000 $8.45 Total manufacturing cost for 2012 = $948,750Variable costs in 2013:AccountUnitVariableCost perUnit for2012(6)PercentageIncrease(7)Increase inVariableCostper Unit(8) = (6) × (7)Variable Costper Unitfor 2013(9) = (6) + (8)Total VariableCosts for 2013(10) = (9) × 80,000Direct materialsDirect manufacturing labor PowerSupervision labor Materials-handling labor Maintenance labor DepreciationRent, property taxes, admin. $4.003.000.500.150.400.405%10$0.200.30$4.203.300.500.150.400.40$336,000264,00040,00012,00032,00032,000Total $8.45 $0.50 $8.95 $716,000Fixed and total costs in 2013:AccountFixed Costs for 2012 (11)Percentage Increase (12)Dollar Increase in Fixed Costs (13) = (11) × (12)Fixed Costs for 2013 (14) = (11) + (13)Variable Costs for 2013 (15)Total Costs (16) = (14) + (15)Direct materials Direct manufacturing labor Power Supervision labor Materials-handling labor Maintenance labor Depreciation Rent, property taxes, admin.$ 045,00030,00045,00095,000100,0000% 0 0 0 0 0 5 7 $ 0 0 0 0 0 0 4,750 7,000 $ 0 0 0 45,000 30,000 45,000 99,750 107,000 $336,000 264,000 40,000 12,000 32,000 32,000 0 0 $ 336,000264,00040,00057,00062,00077,00099,750 107,000Total $315,000 $11,750 $326,750 $716,000 $1,042,750Total manufacturing costs for 2013 = $1,042,7502. Total cost per unit, 2012 =75,000$948,750= $12.65Total cost per unit, 2013= 80,000$1,042,750 = $13.033. Cost classification into variable and fixed costs is based on qualitative, rather than quantitative, analysis. How good the classifications are depends on the knowledge of individual managers who classify the costs. Gower may want to undertake quantitative analysis of costs, using regression analysis on time-series or cross-sectional data to better estimate the fixed and variable components of costs. Better knowledge of fixed and variable costs will help Gower to better price his products, to know when he is getting a positive contribution margin, and to better manage costs.10-23 (15–20 min.)Estimating a cost function, high-low method.1. The key point to note is that the problem provides high-low values of X (annual round trips made by a helicopter) and Y÷X (the operating cost per round trip). We first need to calculate the annual operating cost Y (as in column (3) below), and then use those values to estimate the function using the high-low method.Cost Driver: Annual Round- Trips (X)OperatingCost perRound-TripAnnualOperatingCost (Y)(1) (2) (3) = (1) × (2)Lowest observation of cost driver 1,000 $350$350,000 Difference 1,000 $250,000Slope coefficient = $250,000÷1,000 = $250 per round-tripConstant = $600,000 – ($250 × 2,000) = $100,000The estimated relationship is Y = $100,000 + $250 X; where Y is the annual operating cost of a helicopter and X represents the number of round trips it makes annually.2. Theconstanta (estimated as $100,000) represents the fixed costs of operating a helicopter, irrespective of the number of round trips it makes. This would include items such as insurance, registration, depreciation on the aircraft, and any fixed component of pilot and crew salaries. The coefficientb (estimated as $250 per round-trip) represents the variable cost of each round trip—costs that are incurred only when a helicopter actually flies a round trip. The coefficient b may include costs such as landing fees, fuel, refreshments, baggage handling, and any regulatory fees paid on a per-flight basis.3. If each helicopter is, on average, expected to make 1,200 round trips a year, we can use the estimated relationship to calculate the expected annual operating cost per helicopter:Y = $100,000 + $250 XX = 1,200Y = $100,000 + $250×1,200 = $100,000 + $300,000 = $400,000With 10 helicopters in its fleet, Reisen’s estimated operating budget is 10×$400,000 = $4,000,000.10-24 (20 min.)Estimating a cost function, high-low method.1. See Solution Exhibit 10-24. There is a positive relationship between the number of service reports (a cost driver) and the customer-service department costs. This relationship is economically plausible.2. Number of Customer-ServiceServiceReports DepartmentCosts Highest observation of cost driver 455 $21,500Lowest observation of cost driver 11513,000Difference 340 $8,500Customer-service department costs = a + b (number of service reports)Slope coefficient (b) =$8,500340= $25 per service reportConstant(a) = $21,500 – ($25 × 455) = $10,125= $13,000 – ($25 × 115) = $10,125Customer-service= $10,125 + $25 (number of service reports)department costs3. Other possible cost drivers of customer-service department costs are:a. Number of products replaced with a new product (and the dollar value of the newproducts charged to the customer-service department).b. Number of products repaired and the time and cost of repairs.SOLUTION EXHIBIT 10-24Plot of Number of Service Reports versus Customer-Service Dept. Costs for Capitol Products10-25 (30–40 min.) Linear cost approximation.1. Slope coefficient (b) =Difference in costDifference in labor-hours=$533,000 $400,0006,500 3,000−−= $38.00Constant(a) = $533,000 – ($38.00 × 6,500)= $286,000Cost function = $286,000 + ($38.00 × professional labor-hours)The linear cost function is plotted in Solution Exhibit 10-25.No, the constant component of the cost function does not represent the fixed overhead cost of the Chicago Reviewers Group. The relevant range of professional labor-hours is from 2,000 to 7,500. The constant component provides the best available starting point for a straight line that approximates how a cost behaves within the 2,000 to 7,500 relevant range.2. A comparison at various levels of professional labor-hours follows. The linear cost function is based on the formula of $286,000 per month plus $38.00 per professional labor-hour.Totaloverheadcostbehavior:Month 1Month 2Month 3Month 4 Month 5 Month 6Professional labor-hours Actual total overhead costs Linear approximation Actual minus linearApproximation 2,000$335,000362,000$(27,000)3,000$400,000400,000$ 04,000$430,000438,000$ (8,000)5,000$472,000476,000$ (4,000)6,500$533,000533,000$ 07,500$582,000571,000$ 11,000The data are shown in Solution Exhibit 10-25. The linear cost function overstates costs by $8,000 at the 4,000-hour level and understates costs by $11,000 at the 7,500-hour level.3. Based on Based on LinearActual Cost Function Contribution before deducting incremental overhead $35,000 $35,000 Incremental overhead 30,000 38,000 Contribution after incremental overhead $ 5,000 $(3,000)The total contribution margin actually forgone is $5,000.SOLUTION EXHIBIT 10-25Linear Cost Function Plot of Professional Labor-Hours on Total Overhead Costs for Chicago Reviewers Group10-26 (20 min.) Cost-volume-profit and regression analysis.1a. Average cost of manufacturing = Total manufacturing costs Number of bicycle frames=$1,056,00032,000= $33 per frameThis cost is higher than the $32.50 per frame that Ryan has quoted.1b. Goldstein cannot take the average manufacturing cost in 2012 of $33 per frame and multiply it by 35,000 bicycle frames to determine the total cost of manufacturing 35,000 bicycle frames. The reason is that some of the $1,056,000 (or equivalently the $33 cost per frame) are fixed costs and some are variable costs. Without distinguishing fixed from variable costs, Goldstein cannot determine the cost of manufacturing 35,000 frames. For example, if all costs are fixed, the manufacturing costs of 35,000 frames will continue to be $1,056,000. If, however, all costs are variable, the cost of manufacturing 35,000 frames would be $33 × 35,000 = $1,155,000. If some costs are fixed and some are variable, the cost of manufacturing 35,000 frames will be somewhere between $1,056,000 and $1,155,000.Some students could argue that another reason for not being able to determine the cost of manufacturing 35,000 bicycle frames is that not all costs are output unit-level costs. If some costs are, for example, batch-level costs, more information would be needed on the number of batches in which the 35,000 bicycle frames would be produced, in order to determine the cost of manufacturing 35,000 bicycle frames.2. Expected cost to make35,000 bicycle frames= $435,000 + $19 × 35,000= $435,000 + $665,000 = $1,100,000Purchasingbicycleframesfrom Ryan will cost $32.50 × 35,000 = $1,137,500. Hence, it will cost Goldstein $1,137,500 − $1,100,000 = $37,500 more to purchase the frames from Ryan rather than manufacture them in-house.3. Goldstein would need to consider several factors before being confident that the equation in requirement 2 accurately predicts the cost of manufacturing bicycle frames.a. Is the relationship between total manufacturing costs and quantity of bicycle frameseconomically plausible? For example, is the quantity of bicycles made the only costdriver or are there other cost-drivers (for example batch-level costs of setups,production-orders or material handling) that affect manufacturing costs?b. How good is the goodness of fit? That is, how well does the estimated line fit thedata?c. Is the relationship between the number of bicycle frames produced and totalmanufacturing costs linear?d. Does the slope of the regression line indicate that a strong relationship exists betweenmanufacturing costs and the number of bicycle frames produced?e.Are there any data problems such as, for example, errors in measuring costs, trends inprices of materials, labor or overheads that might affect variable or fixed costs overtime, extreme values of observations, or a nonstationary relationship over timebetween total manufacturing costs and the quantity of bicycles produced?f.How is inflation expected to affect costs?g.Will Ryan supply high-quality bicycle frames on time?10-27 (25 min.) Regression analysis, service company.1. Solution Exhibit 10-27 plots the relationship between labor-hours and overhead costs and shows the regression line.y = $48,271 + $3.93 XEconomic plausibility. Labor-hours appears to be an economically plausible driver of overhead costs for a catering company. Overhead costs such as scheduling, hiring and training of workers, and managing the workforce are largely incurred to support labor.Goodness of fit The vertical differences between actual and predicted costs are extremely small, indicating a very good fit. The good fit indicates a strong relationship between the labor-hour cost driver and overhead costs.Slope of regression line. The regression line has a reasonably steep slope from left to right. Given the small scatter of the observations around the line, the positive slope indicates that, on average, overhead costs increase as labor-hours increase.2. The regression analysis indicates that, within the relevant range of 2,500 to 7,500 labor-hours, the variable cost per person for a cocktail party equals:Food and beverages $15.00Labor (0.5 hrs. × $10 per hour) 5.00Variable overhead (0.5 hrs × $3.93 per labor-hour) 1.97Total variable cost per person $21.973. To earn a positive contribution margin, the minimum bid for a 200-person cocktail party would be any amount greater than $4,394. This amount is calculated by multiplying the variable cost per person of $21.97 by the 200 people. At a price above the variable costs of $4,394, Bob Jones will be earning a contribution margin toward coverage of his fixed costs.Of course, Bob Jones will consider other factors in developing his bid including (a) an analysis of the competition––vigorous competition will limit Jones’s ability to obtain a higher price (b) a determination of whether or not his bid will set a precedent for lower prices––overall, the prices Bob Jones charges should generate enough contribution to cover fixed costs and earn a reasonable profit, and (c) a judgment of how representative past historical data (used in the regression analysis) is about future costs.SOLUTION EXHIBIT 10-27Regression Line of Labor-Hours on Overhead Costs for Bob Jones’s Catering Company10-28 High-low, regression1. Melissa will pick the highest point of activity, 3,390 parts (March) at $14,400 of cost, and the lowest point of activity, 1,930 parts (August) at $8,560.Cost driver:Quantity Purchased CostHighest observation of cost driver 3,390 $14,400Lowest observation of cost driver 1,930 8,560Difference 1,460 $5,840Purchase costs = a + b×Quantity purchasedSlope Coefficient = $5,8401,460= $4 per partConstant (a) = $14,400 ─ ($4×3,390) = $840The equation Melissa gets is:Purchase costs = $840 + ($4×Quantity purchased)2. Using the equation above, the expected purchase costs for each month will be:Month PurchaseQuantityExpected FormulaExpectedcostOctober 2,800 parts y = $840 + ($4×2,800) $12,040November 3,100 y = $840 + ($4×3,100) 13,240December 2,500 y = $840 + ($4×2,500) 10,8403. Economic Plausibility: Clearly, the cost of purchasing a part is associated with the quantity purchased.Goodness of Fit: As seen in Solution Exhibit 10-28, the regression line fits the data well. The vertical distance between the regression line and observations is small. An r-squared value of greater than 0.98 indicates that more than 98% of the change in cost can be explained by the change in quantity.Significance of the Independent Variable: The relatively steep slope of the regression line suggests that the quantity purchased is correlated with purchasing cost for part #4599.SOLUTION EXHIBIT 10-28According to the regression, Melissa’s original estimate of fixed cost is too low given all the data points. The original slope is too steep, but only by 33 cents. So, the variable rate is lower but the fixed cost is higher for the regression line than for the high-low cost equation.The regression is the more accurate estimate because it uses all available data (all nine data points) while the high-low method only relies on two data points and may therefore miss some important information contained in the other data.4. Using the regression equation, the purchase costs for each month will be:Month PurchaseQuantityExpected Formula ExpectedcostOctober 2,800 parts y = $1,779.60 + ($3.67×2,800) $12,056November 3,100 y = $1,779.60 + ($3.67×3,100) 13,157December 2,500 y = $1,779.60 + ($3.67×2,500) 10,955Although the two equations are different in both fixed element and variable rate, within the relevant range they give similar expected costs. This implies that the high and low points of the data are a reasonable representation of the total set of points within the relevant range.10-29(20 min.) Learning curve, cumulative average-time learning model.The direct manufacturing labor-hours (DMLH) required to produce the first 2, 4, and 8 units given the assumption of a cumulative average-time learning curve of 85%, is as follows:85% Learning CurveCumulative Cumulative CumulativeNumber Average Time Total Time:of Units (X) perUnit(y): Labor Hours Labor-Hours(1) (2) (3) = (1) ×(2)2 5,100= (6,000 ×0.85) 10,2004 4,335= (5,100 × 0.85) 17,3408 3,685= (4,335 ×0.85) 29,480 Alternatively, to compute the values in column (2) we could use the formulay = aX bwhere a = 6,000, X = 2, 4, or 8, and b = – 0.234465, which giveswhen X = 2, y = 6,000 × 2– 0.234465 = 5,100when X = 4, y = 6,000 × 4– 0.234465 = 4,335when X = 8, y = 6,000 × 8– 0.234465 = 3,685Variable Costs of Producing2 Units 4 Units 8 UnitsDirect materials $160,000 × 2; 4; 8 Direct manufacturing labor$30 × 10,200; 17,340; 29,480 Variable manufacturing overhead $20 × 10,200; 17,340; 29,480 Total variable costs $320,000306,000204,000$830,000$ 640,000520,200346,800$1,507,000$1,280,000884,400589,600$2,754,000。
经贸英语(第二版)电子教案Unit 10
5 Types of Packing
6 Time of Shipment
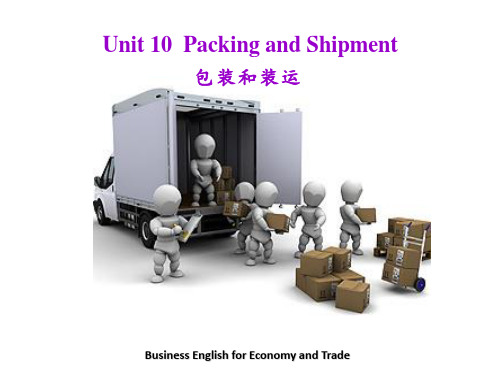
Unit 10 Packing and Shipment
Words & Expressions
packing n. 包装 reference n. 参考 transshipment n. 转运 undergo v. 经受 compact adj. 结实的 strength n. 强度 concerning prep. 关于 break the contract 违反合同 cardboard n. 纸板 reinforce v. 加固 seaworthy adj.适航的 soak v. 浸泡 water-proof adj. 防水的 selling season 销售季节
andimentary Knowledge
the goods to be shipped abroad. The packing used in (2) _t_r_a_n_s_p_o_r_ti_n_g_
goods for home trade is not usually suitable to (3) foreign shipping. Most
B
1. What shall be noted in the packing of goods in foreign trade? Why?
2. What shall be noted in the shipment of goods in foreign trade? Why?
C
3. Why is shipment a very complicated business?
need it badly.
不知你方能否将装运期提前一个月,我方急需货物。
经贸英语Unit 10

经贸英语
Text A: Vocabulary
commonsense 识 adj. 有常识的,明白事理的 n.常
e.g. 1. He has no commonsense, and he always does silly things. 他毫无常识,总是做些傻事。 2. It is commonsense to carry an umbrella in this weather. 这种天气带把伞是很自然的。
经贸英语
Text A: Useful Expressions
identify with 使等同于;认为一致 e.g. 1. Reading this book, we can identify with the main character's struggle. 读了这本书,我们会对主人翁的斗争寄予同情。 2. I found it hard to identify with any of the characters in the film. 我对这部影片里的任何角色都难以认同。
Warm –up Activity
Key
Marketing is the process of planning and executing the conception, pricing, promotion, and distribution of ideas, goods, and services to create exchange that satisfy individual and organizational and objectives.
Text A • Background Information. • Vocabulary & Useful Expression. • Understanding the Text.
商务英语阅读Unit 10 Economic Crisis

TEXT A Reading Comprehension
• 3 Observers of the meltdown have cast blame widely. Some have highlighted the practices of subprime lenders and the lack of effective government oversight.(T )
UNIT 10
Economic Crisis
CONTENTS
Teaching Aims Text A Text B Supplementary Reading
TEACHING AIMS
After studying this unit, you are required to
1. Have a general idea of the Economic Crisis .
TEXT A New Words and Expressions:
7. highlight ['hailait] vt. 突出;强调;使显著;
加亮 n. 最精彩的部分;最重要的事情;加亮区 His remarks highlighted his own function. 他的讲话突出了他个人的作用。
• 5. reined in 放慢;支配,控制;控制,放慢;控制 You must learn to rein in your temper. 你必须学会控制你的脾气。
• 6.inflate [in'fleit] vt. 使充气;使通货膨胀vi. 膨胀; 充气
A few bidders inflated the prices on purpose. 几个投标人故意抬高价钱。
实用经贸英语口译Unit (10)
foreign investment reform and opening up economic restructuring fixed-asset investment solar electricity micro control state revenue per capita GDP free trade zone special economic zone
经贸政策 Economic and Trade Policies
Unit 10
Part I 背景阅读 Background Reading
International Competition Policy and the WTO
Singapore Ministerial and the Doha Declaration
5.中国人民的生活还不富裕,中国的发展还面临着不少 突出的矛盾和问题。 Chinese people are yet to live a well-off life and China still faces daunting challenges in its development endeavor.
6. A successful transition to a more balanced and stable global economy will require very substantial changes to economic policy and financial regulation around the world.
Doha Declaration(多哈宣言)
商务英语阅读王关富unit10banking课后答案
Chapter 10The Alchemists of FinanceExercises1. Questions on the text1)What ’ s the main difference between commercial banks and investmentbanksIn today's business environment, the main business of commercial banks is to collect deposits and make loans, while that of investment banks is to underwrite stocks and bonds and advise companies on mergers and acquisitions.2)Why do investment banks try to keep quiet about their big profitsInvestment banks try to keep quiet about their big profits for twomajor reasons: first, they are under more scrutiny by regulators andinvestors; second, private equity and hedge funds have overtaken them inraising money and making excessive bets.3) W hat changes have taken place in the financial markets since the 1980sThe main changes since 1980s have been the rapid growth of financialinstruments with unprecedented breadth, depth and richness, broughtout by technology and innovation. Examples of those financial instrumentsare public and private debt securities and derivatives.4)Why do bankers and regulators worry about a possible collapse ofan investment bankThey worry about a possible collapse of an investment bank becausesuch an event will have serious implications for the whole financialsystem, and it is vital to know how such institutions evolve, how they handle risks and how well those risks are spread around the financial system.5) Which three factors can explain the huge profit for investment banksThose factors are: first, the alchemist's trick of turning debt (mostly leaden) into derivatives (mostly liquid); second, the emergence of a new class of leveraged client (hedge funds and private equity); third, seeking out new capital markets and clients aroundthe world. Meanwhile, in all these pursuits the banks are now usingtheir own money, to differing degrees.6) What does the expression “the wild east ” refer toThat expression refers to the new markets emerging in Europe and Asia.The introduction of the euro in 1999 and the rapid growth of economies in those regions have attracted investment banks.7) What makesLondon an impressive rival to NewYork as a global financialcenterLondon has becomean impressive rival to NewYork as a global financialcenter because: first, London trades a wide range of assets and isregulated on the spot; second, London is a hub for Europe and continentEuropean countries can raise capital there; third, London is alsoregarded as a springboard for emerging markets such as Chinaand Russia.8)How do investment banks manage the risksInvestment banks try to find the most talented people to handle theintricate assets; they measure the correlations between differentfinancial instruments in an attempt to spread risk; they invest hundreds of millions of dollars a year in technologies to measure and stress-test risks; they also try to boost their risk-weighted capital.9)According to the text, what’s the relationship between revenue andrisk in financeThe relationship between revenue and risk is fundamental in finance. Risk-taking is awarded by possible high revenue. Low risk often means less revenue.However, in order to gain more revenue, you need to takemore risks. You should carefully calculate the risk and balance itagainst revenue beforehand, or you will pay a high price forfoolish investment bet.10)Which one is more important to the growth of the finance industry,innovation or regulationBased on the text, both innovation and regulation are vital to thehealthy growth of the finance industry. Without innovation,investors have fewer places to gain returns on their money and those seekingmoney would have much more difficulties in obtaining it.Thus innovation boosts the rapid growth of finance industry and bringsbenefits to more people both in developed countries and developingcountries. However, innovation without proper regulation,such as the securities that no one knows how to exactly measure their risk,could lead the growth of the finance industry to a disastrous end.2. Fill in each blank of the following sentences with one of the phrases in the list given below:1) The government has taken many measures to bring down the prices ofoil.2) Employees are asked to keep quiet about their year-end bonus.3) Regulators demandthe monopoly companyto split into smaller entities.4)It ’s reported that China Telecom plans to spin off its network services unit inHK.5) The traffic had seized up for miles because of the accident.6) According to those representatives, new forces are at work in therefining industry.7)We shall never know how she managed to acquire her promotion; thereis no way to account for it.8) A nationwide law aimed at stamping out passive smoking in public spacesin Switzerland came into force on Saturday.9) Innovations will bring about dramatic changes in this industrialsector.10) I would say that, on balance , it hasn't been a bad year.3. Match the terms in column A with the explanations in column B:A B1) liquidity crisis a) a bank that provides checkingaccounts,savings accounts, and money market accountsand that accepts time deposits. 62) leveraged buy-out b) a company issues common stock or shares tothe public for the first time. 53) credit crunch c) the situation in which a business experiences alack of cash required to grow the business, payfor day-to-day operations, or meet itsdebtobligations when they are due, causing itto4)over-the-counter securities default.d)1the acquisition of anothercompany using5)initial public offeringa significant amount of borrowed money (bonds or loans) to meet the cost of acquisition. 2e) a financial institution that assistsindividuals,corporations and governments in raisingcapital by underwriting and/or acting asthe client's agent in the issuance ofsecurities. 86) commercial bank f) an aggressively managed portfolio ofinvestments that uses advanced investmentstrategies such as leveraged, long, short andderivative positions in both domestic andinternational markets with the goal ofgenerating high returns. 97) stress test g) a sharp increase in the interest rates and astrong decrease in allocated credits. 3 8) investment bank h) a process that measures whether oneinstitution has adequate capital and/or assetsto respond effectively to various, adversescenarios usually presented by a computerprogram. 79) hedge fund i) securities traded in some context other than ona formal exchange such as the NYSE, etc. 410) risk management j) the identification, assessment, andprioritization of risks followed by coordinatedand economical application of resourcestominimize, monitor, and control the probabilityand/or impact of unfortunate events or tomaximize the realization of opportunities. 104. Translate the following into Chinese:在昨年信贷危机迸发的时候,联邦的看管者们向国内的各主要金融机构注入了数以百亿计美元,而他们这么做的原由在于这些银行是这样之大以致于官员们担忧它们的破产将会拖垮整个金融系统。
新编经贸英语阅读第一至第三单元答案及参考译文

第一至第三单元Keys to unit 1Text A1) Omit.2) Economics studies the choices made by people who are faced with scarcity.3) Scarcity is a situation in which resources are limited and can be used in different ways, so we must sacrifice one thing for another.4) The resources are limited, and they can be used in different ways.5) Omit.6) Because of scarcity, people must make difficult choices: You must decide how to spend your time; the city must decide how to use its land.7) Omit.8) Together, the choices made by individuals, firms, and governments determine society's choices9) 1. What goods and services do we produce?2. How do we produce these goods and services?3. Who consumes the goods and services that are produced?10) For example, if we devote more resources to medical care, we have fewer resources for education and consumer goods. If we increase the number of people working in factories, we have fewer people to work on farms and in the classroom. Ⅱ. Translate the followings:Part APartBPart C1) 人类有多种需要和需求。
独家权威震撼发布:张中宁主编《最新西方报刊经贸文章选读》课后作业答案Lesson10

KEY TO EXERCISESSection A: Text ComprehensionI. Reference Answers to Pre-reading Questions:1.The risks to the global financial system have moderated from the extreme levels identified inthe April 2009 Global Financial Stability Report (GFSR). However, overall financial conditions remain tight. Severe recession risks have eased in response to concerted fiscal and monetary policy stimulus measures. [Paras 1-3]2.Because on both sides of the Atlantic, it is proving difficult to effectively implement measuresthat fully address the problem of impaired assets on banks' balance sheets, leaving banks vulnerable to a further deterioration in the quality of these assets if the global downturn is deeper, and more prolonged, than projected. [Para 4]3.Corporate bond markets have reopened,and are functioning more normally, but bank creditgrowth is still slowing. [Para 5]4.Because emerging markets are recovering, and emerging market assets have benefited fromthe recovery of commodity prices and improved growth prospects, especially in Asia.Emerging market equities have rebounded 30 to 60 percent since end-February, matching or outpacing mature market equities. [Para 8]5.Because continued policy efforts are needed to stave off the chance that some of the recentgains could yet be reversed. More work is needed to fix banks and markets. [Paras 11-12]Section B: ExercisesI. Vocabulary BuildupChoose the best equivalent word or phrase from the four choices marked A, B, C and D for each underlined word or phrase in the following sentences.1. C2. B3. D4. D5. C6. B7. B8. D9. C 10. A11. C 12. C 13. B 14. B 15. BII. Translation PracticeTranslate the following paragraphs into Chinese.然而,总体金融状况依然不容乐观。
- 1、下载文档前请自行甄别文档内容的完整性,平台不提供额外的编辑、内容补充、找答案等附加服务。
- 2、"仅部分预览"的文档,不可在线预览部分如存在完整性等问题,可反馈申请退款(可完整预览的文档不适用该条件!)。
- 3、如文档侵犯您的权益,请联系客服反馈,我们会尽快为您处理(人工客服工作时间:9:00-18:30)。
The S&ED is an ongoing and intensive mechanism for addressing the challenges and opportunities that the United States and China face on a wide range of bilateral, regional, and global areas of immediate and long-term strategic and economic interest. Both President Barack Obama of the U.S. and President Hu Jintao of China have placed the S&ED at the center of the bilateral relationship and are committed to delivering concrete, meaningful, and sustained progress over time on long-term strategic and economic objectives through the S&ED. The 2009 Dialogue will provide an opportunity to establish a framework for those discussions moving forward.
3. bill 议案、法案
“bill”一词在商业和贸易活动中使用较为频繁, 相关的意思包括: (1) 账单、账款 Ask the waiter to bring the bill. 叫服务生把账单拿 来。 (2) 清单、单子 a bill of expenditures 开支清单 (3) = bill of exchange 票据、汇票 We are accustomed to paying by bill at sight. 我们 的惯例是凭即期汇票支付。 (4) 钞票、纸币 a ten – dollar bill 一张10美元的钞票
Text 10
China’s Vanishing Trade Imbalance
I. Related Words and Expressions subsidize trade deficit equilibrium outsourcing productivity output consumer spending contraction public infrastructure consumer demand household consumption savings trade imbalance
5. outsourcing 外包
Outsourcing is the process of contracting an existing business function or process of an organization to an independent organization, and ceasing to perform that function or process internally, instead purchasing it as a service. Though this practice of purchasing a business function--instead of providing it internally--is a common feature of any modern economy, the term outsourcing became popular in America near the turn of the 21st century. An outsourcing deal may also involve transfer of the employees involved to the outsourcing business partner.
7. social safety net 社会保障体系
Social safety nets, or "socioeconomic safety nets", are non-contributory transfer programs seeking to prevent the poor or those vulnerable to shocks and poverty from falling below a certain poverty level. Safety net programs can be provided by the public sector (the state and aid donors) or by the private sector (NGOs, private firms, charities, and informal household transfers).
to a global recession". By this measure, four periods since 1985 qualify: 1990–1993, 1998, 2001–2002 and 2008–2009. The 2008–2012 global recession, sometimes referred to as the late-2000s recession, Great Recession, the Lesser Depression, or the Long Recession, is a marked global economic decline that began in December 2007 and took a particularly sharp downward turn in September 2008. The global recession affected the entire world economy, with higher detriment in some countries than others. It is a major global recession characterized by various systemic imbalances and was sparked by the outbreak of the 2007–2012 global financial crisis.
Байду номын сангаас
II. Notes to the Text
1. the fourth round of the U.S.-China Strategic and Economic Dialogue(S&ED) 第四轮中美战略与经济对 话。 S&ED is a high-level dialogue for the United States and China to discuss a wide range of bilateral, regional and global political, strategic, security, and economic issues between both countries. The establishment of the S&ED was announced on April 1, 2009 by U.S. President Barack Obama and Chinese President Hu Jintao. The upgraded mechanism replaced the former Senior Dialogue and Strategic Economic Dialogue started under the George W. Bush administration. The format is such that high-level representatives of both countries and their delegations will meet annually at capitals alternating between the two countries.
2. current – account surplus 经常项目盈余
The current account balance is one of two major measures of the nature of a country's foreign trade (the other being the net capital outflow). A current account surplus increases a country's net foreign assets by the corresponding amount, and a current account deficit does the reverse. Both government and private payments are included in the calculation. It is called the current account because goods and services are generally consumed in the current period.
4. duty 税、(进口)关税
accept certain foreign exports free of duty 允许 免税进口几种外国货 duty clause 关税条款 duty free certificate 免税证明 duty on value added 增值税 duty paid proof 完税凭证 duty quotas 关税配额 duty rate 税率
一国的国际收支是由两部分组成的:经常项 目和资本项目 (Capital account)。 国际收支中的经常账户是指贸易收支的总和 (商品和服务的出口减去进口),减去生产要素 收入(例如利息和股息),然后减去转移支付 (例如外国援助)。经常项目顺差(盈余)增加了一 个国家相应金额的外国资本净额;经常项目逆差( 赤字)则恰好相反。