wireshark练习及答案lab-protocol-layers
计算机网络实验课 Lab5_Wireshark_IP
Outline
• IP Datagram
• Experimental Procedures • Questions
IP Datagram
Experimental Procedures(windows)
• Step 1: Start Wireshark. • Step 2: Start Pingplotter
• 实验报告中的IP地址不能一样
• 截图后请配上文字说明 举例: The IP address of my computer:172.18.63.180
Thank you!
• Enter address: • Set packet size as 56, press Trace.
• Step 3: Pingplotter
• set packet size as 2000 • press Resume.
• Step 4: Pingplotter
• set packet size as 3500, • press Resume.
• Step 5: Stop Wireshark. • Step 6: Analysis the captured result
and answer the following questions.
Select the first ICMP Echo Request message
• 12. Print out the second fragment of the fragmented IP datagram. What information in the IP header indicates that this is not the first datagram fragment? Are the more fragments? How can you tell? (答案请截图,10分)
wireshark题目
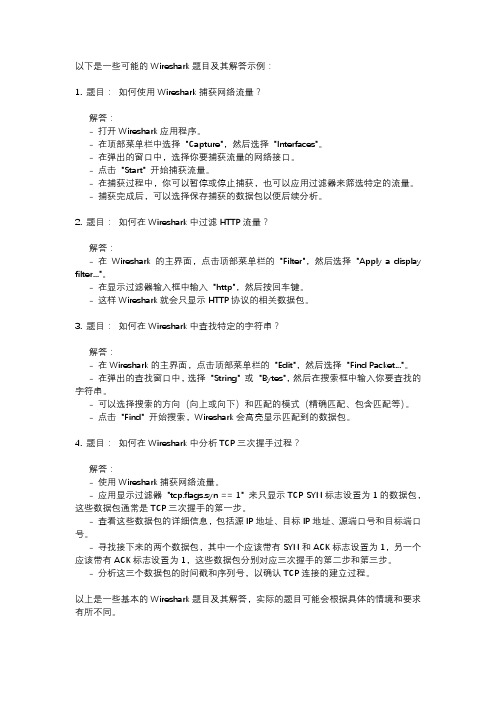
以下是一些可能的Wireshark题目及其解答示例:1. 题目: 如何使用Wireshark捕获网络流量?解答:- 打开Wireshark应用程序。
- 在顶部菜单栏中选择 "Capture",然后选择 "Interfaces"。
- 在弹出的窗口中,选择你要捕获流量的网络接口。
- 点击 "Start" 开始捕获流量。
- 在捕获过程中,你可以暂停或停止捕获,也可以应用过滤器来筛选特定的流量。
- 捕获完成后,可以选择保存捕获的数据包以便后续分析。
2. 题目: 如何在Wireshark中过滤HTTP流量?解答:- 在Wireshark的主界面,点击顶部菜单栏的 "Filter",然后选择 "Apply a display filter..."。
- 在显示过滤器输入框中输入 "http",然后按回车键。
- 这样Wireshark就会只显示HTTP协议的相关数据包。
3. 题目: 如何在Wireshark中查找特定的字符串?解答:- 在Wireshark的主界面,点击顶部菜单栏的 "Edit",然后选择 "Find Packet..."。
- 在弹出的查找窗口中,选择 "String" 或 "Bytes",然后在搜索框中输入你要查找的字符串。
- 可以选择搜索的方向(向上或向下)和匹配的模式(精确匹配、包含匹配等)。
- 点击 "Find" 开始搜索,Wireshark会高亮显示匹配到的数据包。
4. 题目: 如何在Wireshark中分析TCP三次握手过程?解答:- 使用Wireshark捕获网络流量。
- 应用显示过滤器 "tcp.flags.syn == 1" 来只显示TCP SYN标志设置为1的数据包,这些数据包通常是TCP三次握手的第一步。
wireshark练习及答案lab-dns.doc

Lab Exercise – DNSObjectiveDNS (Domain Name System) is the system & protocol that translates domain names to IP addresses . Step 1: Analyse the supplied DNS TraceHere we examine the supplied trace of a browser making DNS requests as follows.The trace is here: /~kevin/com320/labs/wireshark/trace-dns.pcapunch Wireshark and start a capture with a filter of “udp port 53”.We use this filterbe-cause there is no shorthand for DNS, but DNS is normally carried on UDP port 53.Figure 3: Setting up the capture optionsStep 2: Inspect the TraceTo explore the details of DNS packets, select a DNS query expand its Domain Name System block (by us-ing the “+” expander or icon). Your display should be similar to the one shown in our figure, with a series of packets with protocol DNS.. We have selected the first DNS message.Figure 3: Trace of DNStraffic showing the details of the DNS headerLook for the following details:∙The DNS block follows the IP and UDP blocks. This is because DNS messages are carried in UDP segments within IP packets. You will see that the UDP port used by a nameserver is 53.∙The DNS header starts with a Transaction ID that is used to link a request and the corresponding reply – they both carry the same Transaction ID.∙Next come a set of flags that you can expand. They indicate whether the DNS message is a query or response, amongst other details.∙Then comethe number of query, answer, authority and additional records. These fields conclude the header.∙After the DNS header, the remainder of the message consists of the indicated number of query, answer, authority and additional records. Often there will be only one query – for the IP address of the domain name we are seeking – but there may be many of the other records. Theserecords are grouped in sections, such as the Authority section for all of the authority records.Each query has a Type code that indicates the kind of record sought, whether an IP address orotherwise. Each of the other recordsalso has a Type code that indicates whether it carries an IP address of a host, the name of a nameserver, or something else. The format of an individualrecord depends on its type. The entire DNS message is designed to fit within one UDP message.∙Wireshark may show other information, such as the number of the packet that carries the re-sponse to this request or the response time for the DNS exchange, but this is derived informa-tion. It is not actually carried on any packet.Repeat the above to look at a DNS response. You should see a larger set of records in this message; while DNS queries mostly serve to carry the query, DNS responses often return a set of useful information.Step 3: Details of DNS MessagesSelect the first DNS querypacket in your trace, with the first several packetscorresponding to earlier dig commands. To check, see if there are several queries that list the domain you chose in the Info column, each followed by a response.Look at the DNS header, and answer the following questions: (Answers on next page).1.How many bits long is the Transaction ID? Based on this length, take your best guess as to howlikely it is that concurrent transactions will use the same transaction ID.2.Which flag bit and what values signifies whether the DNS message is a query or response?3.How many bytes long is the entire DNS header? Use information in the bottom status line whenyou select parts of the packet and the bottom panel to help you work this out.Now examine the responses to DNS queries in the trace.The initial response should have provided another nameserver one step closer to the nameserver, but not the final answer. You should find that it includes the original query in its Query section. It will also include records with both the name of the nameservers to contact next, and the IP addresses of those nameservers. The final response in this se-ries will include the IP address of the domain name – this is the answer to the query.Look at the body of the DNS response messages, and answer the following questions: (answers overleaf)4.For the initial response, in what section are the names of the nameservers carried? What is theType of the records that carry nameserver names?5.Similarly, in what section are the IP addresses of the nameservers carried, and what is the Typeof the records that carry the IP addresses?6.For the final response, in what section is the IP address of the domain name carried?Answers to Step 3: Details of DNS Messages1.The Transaction ID is 16 bits long, which makes collisions unlikely,. Since the host computer issetting this value, it can use all 2^16 choices before repeating. This means that 2^16query/response pairs would need to be outstanding at the same time to cause a collision. For a normal computer, this is an extremely or implausibly high DNS workload.2.The first flag bit signifies query or response. A “0” indicates a query, and hence a “1” a response.3.The DNS header is 12 bytes long.4.The names of name servers are carried in the Authority section in an NS (NameServer) record.5.The IP addresses of the name servers are carried in the Additional section. The Type of record isA, for an IPv4 address, or AAAA for an IPv6 address.6.The IP address of the queried domain name is carried in the Answer section (in an A or AAAArecord.)Step 4: DNS Response TimeTo conclude this lab, we will look at the DNS response time of the DNS queries. This is a normal DNS usage, in which a computer sends a single query and receives the answer in the response. The response time is the delay between when the computer sends the query to the local nameserver and when it receives the response from the local nameserver. This time includes the time taken by the local name-server to contact remote nameservers, if the answer is not cached. Since this response time can delay connections to sites, it should be as small as possible.Proceed as follows to generate an “IO Graph” of the DNS response time s. IO graphs are a standard fea-ture of Wireshark available under the Statistics menu. By default, this graph shows the rate of packets over time. We will tweak it to show the DNS response time over the trace with the following changes: ∙On the x-axis, adjust the tick interval and pixels per tick for viewing. The tick interval should be small enough to see into the behavior over the trace.One second is probably a good choice foryour trace. The pixels per tick can be adjusted to make the graph wider or narrower to fill thewindow; you can also adjust the width of the window.∙On the y-axis, change the unit to be “Advanced”. The default is Packet/Tick. “Advanced” is a special keyword that will let us access different data values to graph. Once you select it, a new“Calc:” box will appear to let us specify the data values.∙Enter “dns.time” into the calculation box and set the pull-down menu to be“MAX(*)”.dns.time is a virtual field calculated by Wireshark from the query and responsemessages. It is shown with DNS responses, and gives the DNS response time. Choosing “MAX(*)”will let us see the largest DNS response time in every tick interval so that we can spot outliers.“AVG(*)” would also be a reasonable choice.∙Press Enter, and click the “Graph” button ifnecessary. You may need to do this to trigger a redis-play. You should now have a graph of response times similar to our graph in the figure below. We expect that you will see many small DNS response times, and a scattering of larger DNS response times. In our graph, most times are very small, likely because the correct answer is cached by the local nameserver. In some cases, however, there is a longer delay of hundreds of milliseconds as remote na-meservers must be queried. You can click a point on the graph to be taken to the nearest point in the trace if there is a feature you would like to investigate.Figure 4: DNS response time via an IO graphIf you look over the DNS traffic caused by your browser, you are likely to see a greater range of beha-viors than in the DNS traffic caused by the dig commands. This behavior might include new types of records, such as CNAME (canonical name, to provide information about aliases when one machine is known by multiple names), answers that indicate that a name does not exist, and so forth. Explore Your NetworkWe encourage you to explore DNSon your own once you have completed this lab. Some ideas:∙Look up other types of DNS records, such as MX to find the mail server for a domain, and AAAA to find the IPv6 address of a domain.∙Google provides an alternate DNS nameserver system that you may use called “Google P ublic DNS”. Look it up, and follow the configuration instructions to test it out. Experiment to see ifthis DNS service is faster than your existing DNS arrangement.。
wireshark练习及答案lab-arpattack
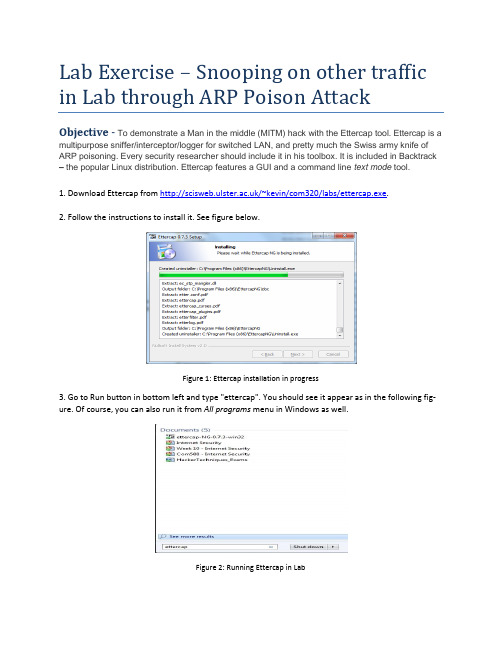
Lab Exercise – Snooping on other traffic in Lab through ARP Poison AttackObjective - To demonstrate a Man in the middle (MITM) hack with the Ettercap tool.Ettercap is a multipurpose sniffer/interceptor/logger for switched LAN, and pretty much the Swiss army knife of ARP poisoning. Every security researcher should include it in his toolbox. It is included in Backtrack – the popular Linux distribution. Ettercap features a GUI and a command line text mode tool.1. Download Ettercap from /~kevin/com320/labs/ettercap.exe.2. Follow the instructions to install it. See figure below.Figure 1: Ettercap installation in progress3. Go to Run button in bottom left and type "ettercap". You should see it appear as in the following fig-ure. Of course, you can also run it from All programs menu in Windows as well.Figure 2: Running Ettercap in Lab4. Next select Unified Sniffing from the Sniff menu option as show in figure 3.Figure 3: Step 1 in process of snooping5. Select the first Etternet interface (in this case it is “eXtreme Gigabit Ethernet Driver” network interface (see figure 4).Figure 4: Selection of network interface1.Next you should be presented with a series of menu options including Start, Targets, Hosts, ViewMitm, Filters, Logging and Plugins. You should select the Hosts option and choose Scan for Hosts.See figure 5.Figure 5: Selection of hosts to scan on LAN2.Once you select Scan for hosts, you should see a pop up window displaying the progess when all255 hosts on the local network are scanned. See figure 6.Figure 6: Hosts being scanned locally3.Next you should select Hosts List from the Hosts menu. You should then see a screen similar tofigure 7 with a list of hosts that have been found.Figure 7: Hosts that were scanned locally4.Please ask permission from a colleague to allow you to select their computer to be scanned.They should confirm their IP address to you. That can be found as in previous weeks by typing cmd in the windows start menu and opening a command prompt. Then in the command prompt, type ipconfig and note the ipv4 address displayed. You may need to scroll up to see it in the command prompt window. Here in figure 8, host 193.61.190.73 is being selected for scanning.Figure 8: host 193.61.190.73 is being selected for scanning5.Once you have the target selected with your mouse, then select the Add to Target 1 button. Seefigure 9.Figure 9: host 193.61.190.73 is being added to Target 1.6.Select the Targets menu option and then select C urrent Targets as shown in figure 10.Figure 10: Targets being selected7.Now you should only see your class mates computer shown as in figure 11.Figure 11: host selected for attack8.Now go to the mitm option as show in figure 12. Select Arp poisoning.Figure 12: ARP Poisoning selection9.Once Arp poisoning is selected, you will be presented with the dialogue window as shown in fig-ure 13. Simply click OK.Figure 13: Options for ARP poison attack10.You will then be presented with a window once again which is similar to figure 14. The ARP poi-son attack however is happening underneath. You now have access to all the traffic which is be-ing routed to the IP address which you have entered earlier. We will now move to Wireshark to see the power of an ARP poison mitm attack.Figure 14: Main window after attack has been started11.Open Wireshark by typing wireshark at the run programs option. You will then select the usualEtternet Intel Interface and Start a capture. In the display filter, type the following:ip.src==yourfriendsipaddress&&tcp.port==80 e.g. ip.src==193.61.191.88 &&tcp.port==80. See figure 15.Figure 15: Sample scan of web traffic on IP address 193.61.191.8812.Get your friend to browse to any site. In this example below, I have gone to a CNN page whichdiscusses Coca-Cola remarks from the CEO. It is at/2013/02/05/business/coke-ceo-muhtar-kent-capitalism-evolve/Figure 16: Sample page surfed.13.Once your friend has started to surf, you should start to see a lot of HTTP and TCP packets ap-pear in your packet list window. After some time you can stop the capture. You may also choose to stop the mitm attack. You can always resume the attack to see ‘fresh’ traffic remotely. You should then select the page that he surfed through e.g. CNN and right click on it as displayed be-low and select Follow TCP Stream.Figure17: Sample page from CNN being selected in the Wireshark interface. Note the ip address and port filtering14.The TCP Follow Stream should lead you to a window such as displayed below. Note the contentsof the GET and HOST on the first two lines. When we put them together we get the location of the site visited which is /2013/02/05/business/coke-ceo-muhtar-kent-capitalism-evolve/. This should now show you that all surfing can be snooped on a LAN.Figure18: CNN page after selecting Follow TCP Stream20.Now get your friend to go to a site which requires a login or passing information such as cnnweather at: /weather. Here type a city such as Belfast:21. Next, examine the wireshark tr ace, you should see a captured packet with “cit y-Search/json/true HTTP/1.1” showing the ‘sensitive data’.22.Finally, please return to the ettercap program and select Mitm and click on Stop mitm attack(s).This will ensure that the ARP tables return to normal and no unnecessary snooping of a newco-mer to your friend’s machine takes place. See figure 19.Figure19: Stopping the man in the middle ARP attack23.The following popup windows should confirm that all man in the middle attacks have stopped.People are now safe again in the lab.Figure 20: Confirmation of mitm attack being stopped.24.Finally, you can exit the program.Figure 21: Ensuring you exit the attack vector programPlease be responsible with this new knowledge……。
wireshark实验一答案
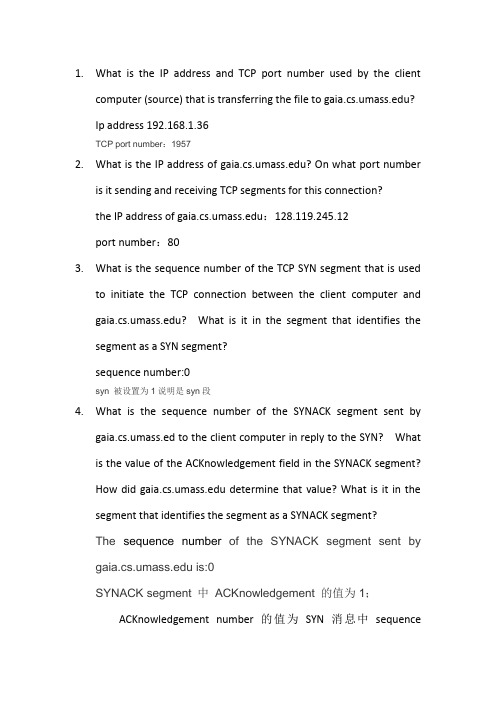
1.What is the IP address and TCP port number used by the clientcomputer (source) that is transferring the file to ?Ip address 192.168.1.36TCP port number:19572.What is the IP address of ? On what port numberis it sending and receiving TCP segments for this connection?the IP address of :128.119.245.12port number:803.What is the sequence number of the TCP SYN segment that is usedto initiate the TCP connection between the client computer and ? What is it in the segment that identifies the segment as a SYN segment?sequence number:0syn 被设置为1说明是syn段4.What is the sequence number of the SYNACK segment sent bygaia.cs.umass.ed to the client computer in reply to the SYN? What is the value of the ACKnowledgement field in the SYNACK segment?How did determine that value? What is it in the segment that identifies the segment as a SYNACK segment?The sequence number of the SYNACK segment sent by is:0SYNACK segment 中ACKnowledgement 的值为1;ACKnowledgement number的值为SYN消息中sequencenumber加上1所得;SYN 和Acknowledgement f都置为1说明这是一个SYNACK segment.5.What is the sequence number of the TCP segment containing theHTTP POST command?第11号报文段是包含HTTP POST 命令的TCP segment。
Wireshark_INTRO_Solution_July_22_2007
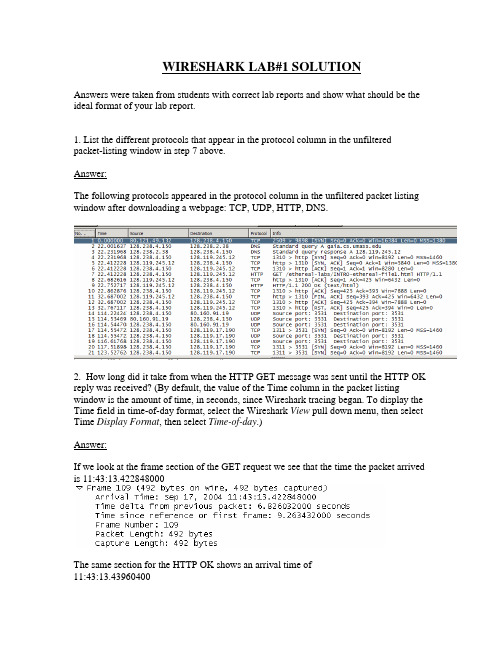
WIRESHARK LAB#1 SOLUTIONAnswers were taken from students with correct lab reports and show what should be the ideal format of your lab report.1. List the different protocols that appear in the protocol column in the unfiltered packet-listing window in step 7 above.Answer:The following protocols appeared in the protocol column in the unfiltered packet listing window after downloading a webpage: TCP, UDP, HTTP, DNS.2. How long did it take from when the HTTP GET message was sent until the HTTP OK reply was received? (By default, the value of the Time column in the packet listing window is the amount of time, in seconds, since Wireshark tracing began. To display the Time field in time-of-day format, select the Wireshark View pull down menu, then select Time Display Format, then select Time-of-day.)Answer:If we look at the frame section of the GET request we see that the time the packet arrived is 11:43:13.422848000The same section for the HTTP OK shows an arrival time of11:43:13.43960400The difference of these 2 times gives.43960400 - .426032000 = 0.013572 seconds3. What is the Internet address of the (also known as)? What is the Internet address of your computer?Answer:If we look at the IP section of the GET request, the source and destination are shownThe source is the local machine’s address and the destination is the web server’s public My (local machine’s) address = 128.238.244.28IP address 128.119.245.12 = .This can also be seen during the DNS query4. Print the two HTTP messages displayed in step 9 above. To do so, select Print from the Wireshark File command menu, and select “Selected Packet Only” and “Print as displayed” and then click OK.Answer:Here is the information for the HTTP GET and OK packets:HTTP GET:Frame 4 (862 bytes on wire, 862 bytes captured)Ethernet II, Src: Netgear_61:8e:6d (00:09:5b:61:8e:6d), Dst: WestellT_9f:92:b9(00:0f:db:9f:92:b9)Internet Protocol, Src: 192.168.1.46 (192.168.1.46), Dst: 128.119.245.12(128.119.245.12)Transmission Control Protocol, Src Port: 1474 (1474), Dst Port: http (80), Seq: 1, Ack: 1, Len: 808Hypertext Transfer ProtocolGET /wireshark-labs/INTRO-wireshark-file1.html HTTP/1.1\r\nHost: \r\nUser-Agent: Mozilla/5.0 (Windows; U; Windows NT 5.1; en-US; rv:1.8.1.4)Gecko/20070515 Firefox/2.0.0.4\r\nAccept:text/xml,application/xml,application/xhtml+xml,text/html;q=0.9,text/plain;q=0.8,im age/png,*/*;q=0.5\r\nAccept-Language: en-us,en;q=0.5\r\nAccept-Encoding: gzip,deflate\r\nAccept-Charset: ISO-8859-1,utf-8;q=0.7,*;q=0.7\r\nKeep-Alive: 300\r\nConnection: keep-alive\r\nHTTP OK:Frame 6 (439 bytes on wire, 439 bytes captured)Ethernet II, Src: WestellT_9f:92:b9 (00:0f:db:9f:92:b9), Dst: Netgear_61:8e:6d(00:09:5b:61:8e:6d)Internet Protocol, Src: 128.119.245.12 (128.119.245.12), Dst: 192.168.1.46(192.168.1.46)Transmission Control Protocol, Src Port: http (80), Dst Port: 1474 (1474), Seq: 1, Ack: 809, Len: 385Hypertext Transfer ProtocolHTTP/1.1 200 OK\r\nDate: Thu, 07 Jun 2007 18:09:01 GMT\r\nServer: Apache/2.0.52 (CentOS)\r\nLast-Modified: Thu, 07 Jun 2007 18:08:01 GMT\r\nETag: "d6c69-50-cb94a240"\r\nAccept-Ranges: bytes\r\nContent-Length: 80Keep-Alive: timeout=10, max=100\r\nConnection: Keep-Alive\r\nContent-Type: text/html; charset=ISO-8859-1\r\n\r\nLine-based text data: text/html。
wireshark练习及答案lab-udp
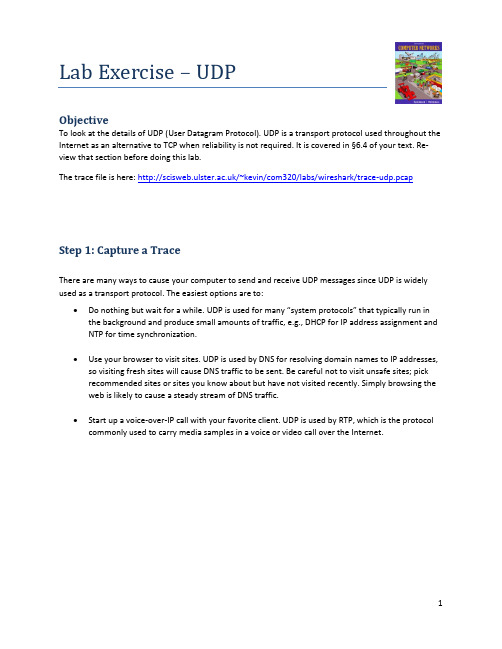
Lab Exercise – UDPObjectiveTo look at the details of UDP (User Datagram Protocol). UDP is a transport protocol used throughout the Internet as an alternative to TCP when reliability is not required. It is covered in §6.4 of your text. Re-view that section before doing this lab.The trace file is here: /~kevin/com320/labs/wireshark/trace-udp.pcapStep 1: Capture a TraceThere are many ways to cause your computer to send and receive UDP messages since UDP is widely used as a transport protocol. The easiest options are to:•Do nothing but wait for a while. UDP is used for many “system protocols” that typically run in the background and produce small amounts of traffic, e.g., DHCP for IP address assignment and NTP for time synchronization.•Use your browser to visit sites. UDP is used by DNS for resolving domain names to IP addresses, so visiting fresh sites will cause DNS traffic to be sent. Be careful not to visit unsafe sites; pickrecommended sites or sites you know about but have not visited recently. Simply browsing the web is likely to cause a steady stream of DNS traffic.•Start up a voice-over-IP call with your favorite client. UDP is used by RTP, which is the protocol commonly used to carry media samples in a voice or video call over the Internet.Proceed as follows to capture a trace of UDP traffic; alternatively, you may use a supplied trace:unch Wireshark and start a capture with a filter of “udp“.Figure 1: Setting up the capture options2.When the capture is started, perform some activities that will generate UDP traffic. We de-scribed several options above, e.g., browse the web or start a short VoIP call.3.Wait a little while (say 60 seconds) after you have stopped your activity to also observe anybackground UDP traffic. It is likely that you will observe a trickle of UDP traffic because system activity often uses UDP to communicate. We want to see some of this activity.e the Wireshark menus or buttons to stop the capture. You should now have a trace with pos-sibly many UDP packets. Our example is shown below. We have selected a packet and expand-ed the detail of the UDP header.Figure 2: Trace of UDP traffic showing the details of the UDP headerStep 2: Inspect the TraceDifferent computers are likely to capture different kinds of UDP traffic depending on the network setup and local activity. Observe that the protocol column is likely to show multiple protocols, none of which is UDP. This is because the listed protocol is an application protocol layered on top of UDP. Wireshark gives the name of the application protocol, not the (UDP) transport protocol unless Wireshark cannot determine the application protocol. However, even if the packets are listed as an application protocol, they will have a UDP protocol header for us to study, following the IP and lower-layer protocol headers. Select different packets in the trace (in the top panel) and browse the expanded UDP header (in the mid-dle panel). You will see that it contains the following fields:•Source Port, the port from which the UDP message is sent. It is given as a number and possibly a text name; names are given to port values that are registered for use with a specific application.•Destination Port. This is the port number and possibly name to which the UDP message is des-tined. Ports are the only form of addressing in UDP. There computer is identified using the IPaddress in the lower IP layer.•Length. The length of the UDP message.•Checksum. A checksum over the message that is used to validate its contents. Is your checksum carrying 0 and flagged as incorrect for UDP messages sent from your computer? On some com-puters, the operating system software leaves the checksum blank (zero) for the NIC to compute and fill in as the packet is sent. This is called protocol offloading. It happens after Wireshark sees the packet, which causes Wireshark to believe that the checksum is wrong and flag it with a dif-ferent color to signal a problem. You can remove these false errors if they are occurring by tell-ing Wireshark not to validate the checksums. Select “Preferences” from the Wireshark menusand expand the “Protocols” area. Look under the list until you come to UDP. Uncheck “Validate checksum if possible”.That is it. The UDP header has different values for different messages, but as you can see, it is short and sweet. The remainder of the message is the UDP payload that is normally identified the higher-layer pro-tocol that it carries, e.g., DNS, or RTP.Step 3: UDP Message StructureTo check your understanding of UDP, you should sketch a figure of the UDP message structure as you ob-served. It should show the position of the IP header, UDP header, and UDP payload. Within the UDP header, show the position and size of each UDP field you can observe using Wireshark. Your figure can simply show the message as a long, thin rectangle.Try not to look at the figure of a UDP segment in the answer on next page. To work out sizes, observe that when you click on a protocol block in the middle panel (the block itself, not the “+” expander) then Wireshark will highlight the bytes it corresponds to in the packet in the lower panel and display the length at the bottom of the window.By looking at the details of the UDP messages in your trace, answer these questions:1.What does the Length field include? The UDP payload, UDP payload and UDP header, or UDPpayload, UDP header, and lower layer headers?2.How long in bits is the UDP checksum?3.How long in bytes is the entire UDP header?(Please note that answers are on next page).Solutions – Step 3 UDP Message StructureFigure 1: Structure of a UDP messageThis drawing shows the same UDP header fields as in the book in a slightly different format and with lengths given in bytes, not bits. It also shows the relation of the IP header and UDP payload to the UDP header.The answers to the questions are:1.The Length field gives the length of the UDP payload plus the UDP header.2.The checksum is 16 bits long.3.The UDP header is 8 bytes long.[END]Step 4: UDP UsageTo complete our understanding of UDP, we will look at how UDP is used in practice as a transport by ap-plications. Beginning with IP, the next lower protocol layer, there are several issues we can consider. A first issue is how IP knows that the next higher protocol layer is UDP. The answer is that there is a Proto-col field in the IP header that contains this information.1.Give the value of the IP Protocol field that identifies the upper layer protocol as UDP.A second issue is how UDP messages are typically addressed at the IP layer. You might be surprised to find UDP messages in your trace that neither come from your computer or are sent only to your com-puter. You can see this by sorting on the Source and Destination columns. The source and destinations will be domain names, if Network layer name resolution is turned, and otherwise IP addresses. (You can toggle this setting using the View menu and selecting Name resolution.) You can find out the IP address of your computer using the “ipconfig” command (Windows).The reason you may find UDP messages without your com puter’s IP address as either the source or des-tination IP address is that UDP is widely used as part of system protocols. These protocols often send messages to all local computers who are interested in them using broadcast and multicast addresses. In our traces, we find DNS (the domain name system), MDNS (DNS traffic that uses IP multicast), NTP (for time synchronization), NBNS (NetBIOS traffic), DHCP (for IP address assignment), SSDP (a service discov-ery protocol), STUN (a NAT traversal protocol), RTP (for carrying audio and video samples), and more. Your trace may have other protocols you have not heard about; it is OK, as there are a lot of protocols out there. You can look them up on the web for fun.2.Examine the UDP messages and give the destination IP addresses that are used when your com-puter is neither the source IP address nor the destination IP address. (If you have only your com-puter as the source or destination IP address then you may use the supplied trace.)Finally, let us look at the lengths of typical UDP messages. We know that UDP messages can be as large as roughly 64Kbytes. But as you browse you should see that most UDP messages are much shorter than this maximum, so that UDP messages fit in a single packet.3.What is the typical size of UDP messages in your trace?(Please note that answers are on next page).Solutions to Step 4: UDP UsageThe answers to the questions are:1.The IP Protocol field value of 17 indicates UDP.2. A variety of broadcast and multicast addresses may be found. These include the Internet broad-cast address of 255.255.255.255, subnet broadcast addresses such as 192.168.255.255 (where the 192.168 portion is the subnet number and the .255.255 portion means broadcast), and mul-ticast IP addresses such as 224.0.xx.xx (such as 224.0.0.251 for multicast DNS).3.This answer will vary with your trace. Most often they are a few hundred bytes or less, and oftenmay be around 100 bytes. That is, many messages are relatively short packets.。
Lab1 Protocol Layers
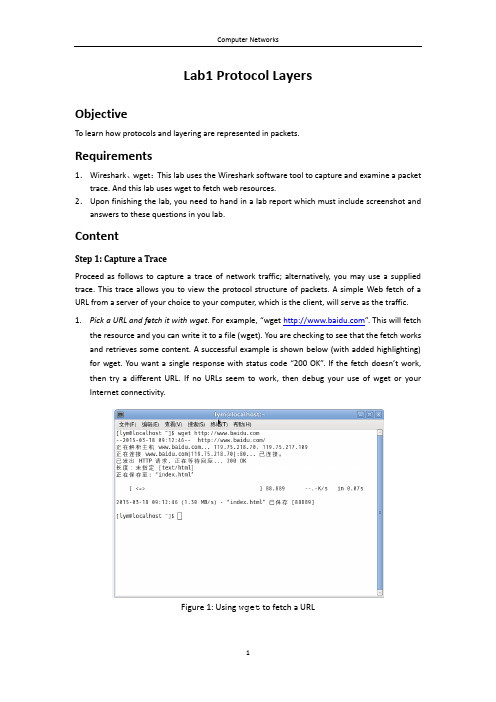
Lab1 Protocol LayersObjectiveTo learn how protocols and layering are represented in packets.Requirements1.Wireshark、wget:This lab uses the Wireshark software tool to capture and examine a packet trace. And this lab uses wget to fetch web resources.2.Upon finishing the lab, you need to hand in a lab report which must include screenshot and answers to these questions in you lab.ContentStep 1: Capture a TraceProceed as follows to capture a trace of network traffic; alternatively, you may use a supplied trace. This trace allows you to view the protocol structure of packets. A simple Web fetch of a URL from a server of your choice to your computer, which is the client, will serve as the traffic.1.Pick a URL and fetch it with wget. For example, “wget ”. This will fetchthe resource and you can write it to a file (wget). You are checking to see that the fetch works and retrieves some content. A successful example is shown below (with added highlighting) for wget. You want a single response with status c ode “200 OK”. If the fetch doesn’t work, then try a different URL. If no URLs seem to work, then debug your use of wget or your Internet connectivity.Figure 1: Using wget to fetch a URL2.Close unnecessary browser tabs and windows. By minimizing browser activity, you will stopyour computer from fetching unnecessary web content, thus avoiding incidental traffic in the trace.unch Wireshark and start a capture with a filter of “tcp port 80”and check “enablenetwork name resolution”.This filter will record only standard web traffic without other kinds of packets that your computer may send. The checking will translate the addresses of the computers sending and receiving packets into names, which should help you recognizing whether the packets are going to or from your computer.Figure 2: Setting up the capture options4.When the capture is started, repeat the web fetch using wget/curl above. This time, thepackets will be recorded by Wireshark as the content is being transferred.5.After the fetch is successful, return to Wireshark and use the menus or buttons to stop thetrace. If you have succeeded, the upper Wireshark window will show multiple packets, and it will most likely be full. How many packets are captured will depend on the size of the web page, but there should be at least 8 packets in the trace, and typically 20-100, and many ofthese packets will be colored green. An example is shown below. Congratulations, you have captured a trace!Figure 3: Packet trace of wget trafficStep 2: Inspect the TraceSelect a packet for which the Protocol column is “HTTP” and the Info column says it is a GET. It is the packet that carries the web (HTTP) request sent from your computer to the server. You can click the column headings to sort by that value although it should not be difficult to find an HTTP packet by inspection. Take a closer look to see how the packet structure reflects the protocols that are in use.Since we are fetching a web page, we know that the protocol layers being used are as shown below. That is, HTTP is the application layer web protocol used to fetch URLs. Like many Internet applications, it runs on top of the TCP/IP transport and network layer protocols. The link and physical layer protocols depend on your network, but are typically combined in the form of Ethernet (shown) if your computer is wired or 802.11 (not shown) if your computer is wireless.Figure 4: Protocol stack for a web fetchHTTPTCPIPEthernet ClientServer HTTP TCP IP EthernetpacketWith the HTTP GET packet selected, look closely to see the similarities and differences between it and our protocol stack as described next. The protocol blocks are listed in the middle panel. You can expand each block (by cl icking on the “+” expander or icon) to see its details.∙The first Wireshark block is “Frame”. This is not a protocol. It is a record that describes overall information about the packet including when it was captured and how many long it has in terms of the number of bits.∙The second block is “Ethernet”. This mat ches our diagram! Note that you may have taken a trace on a computer using 802.11 yet still see an Ethernet block instead of an 802.11 block.Why? It happens because we asked Wireshark to capture traffic in Ethernet format on the capture options. Therefore, Wireshark converted the real 802.11 header into a pseudo-Ethernet header.∙Then come IP, TCP and HTTP, which are just as we wanted. Note that the order is from the bottom of the protocol stack upwards. This is because as packets are passed down the stack, the header information of the lower layer protocol is added to the front of the information from the higher layer protocol, as in Fig. 1-15 of your text. That is, the lower layer protocols come firs t in the packet “on the wire”.Now, find another HTTP packet, i.e., the response from the server to your computer, and look at the structure of this packet for the differences compared to the HTTP GET packet.This packet should have “200 OK” in the Info fi eld, denoting a successful fetch. In our trace, there are two extra blocks in the detail panel as seen in the next figure.∙The first extra block says “[11 reassembled TCP segments …]”. Details in your capture will vary, but this block is describing more than the packet itself. Most likely, the web response was sent across the network as a series of packets that were put together after they arrived at the computer. The packet labeled HTTP is the last packet in the web response, and the block lists packets that are joined together to obtain the complete web response. Each of these packets is shown as having protocol TCP even though the packets carry part of an HTTP response. Only the final packet is shown as having protocol HTTP when the complete HTTP message may be understood, and it lists the packets that are joined together to make the HTTP response.∙The second extra block says “Line-based text data …”. Details in your capture will vary, but this block is describing the contents of the web page that was fetched. In our case it is of type text/html, though it could easily have been text/xml, image/jpeg, or many other types. As with the Frame record, this is not a true protocol. Instead, it is a description of packet contents that Wireshark is producing to help us understand the network traffic.Figure 5: Inspecting a HTTP “200 OK” responseStep 3: Packet StructureTo show your understanding of packet structure, draw a figure of an HTTP GET packet that shows the position and size in bytes of the TCP, IP and Ethernet protocol headers. Your figure can simply show the overall packet as a long, thin rectangle. Leftmost elements are the first sent on the wire. On this drawing, show the range of the Ethernet header and the Ethernet payload that IP passed to Ethernet to send over the network. To show the nesting structure of protocol layers, note the range of the IP header and the IP payload. You may have questions about the fields in each protocol as you look at them. We will explore these protocols and fields in detail in future labs. To work out sizes, observe that when you click on a protocol block in the middle panel (the block itself, not the “+” expander), then Wireshark will highlight the bytes it corresponds to in the packet in the lower panel and display the length at the bottom of the window. For instance, clicking on the IP version 4 header of a packet in our trace should show that the length is 20 bytes. (Your trace will be different if it is IPv6, and may be different even with IPv4 depending on various options.) You may also use the overall packet size shown in the Length column or Frame detail block.Turn-in: Hand in your packet drawing.Step 4: Protocol OverheadEstimate the download protocol overhead or percentage of the download bytes taken up by protocol overhead.To do this, consider HTTP data (headers and message) to be useful data for the network to carry and lower layer headers (TCP, IP and Ethernet) to be the overhead. We would like this overhead to be small so that most bits are used to carry content that applicationscare about. To work this out, first, look at only the packets in the download direction for a single web fetch. You might sort on the Destination column to find them. The packets should start with a short TCP packet described as a SYN ACK which is the beginning of a connection. They will be followed by mostly longer packets in the middle (roughly 1 to 1.5KB) of which the last one is an HTTP packet. This is the main portion of the download. And they will likely end with a short TCP packet that is part of ending the connection. For each packet, you can inspect how much overhead it has in the form of Ethernet/IP/TCP headers and how much useful HTTP data it carries in the TCP payload. You may also look at the HTTP packet in Wireshark to learn how much data there is in the TCP payloads over all download packets.Turn-in: Your estimate of download protocol overhead as defined above. Tell us whether you find this overhead to be significant.Step 5: Demultiplexing KeysWhen an Ethernet frame arrives at a computer, the Ethernet layer must hand the packet that it contains to the next higher layer to be processed. The act of finding the right higher layer to process received packets is called demultiplexing. We know that in our case the higher layer is IP. But how does the Ethernet protocol know this? After all, the higher-layer could have been another protocol entirely (such as ARP). We have the same issue at the IP layer, i.e., IP must be able to determine that the contents of IP message is a TCP packet so that it can hand it to the TCP protocol to be processed. The answer is that protocols use information in their header known as a “demultiplexing key” to determine the higher layer.Look at the Ethernet and IP headers of a download packet in detail to answer the following questions:1.Which Ethernet header field is the demultiplexing key that tells it that the next higher layer isIP? What value is used in this field to indicate “IP”?2.Which IP header field is the demultiplexing key that tells it that the next higher layer is TCP?What value is used in this field to indicate “TCP”?Turn-in: Hand in your answers to the above questions.Explore on your ownWe encourage you to explore protocols and layering once you have completed this lab. Some ideas:∙Look at a short TCP packet that carries no higher-layer data. To what entity is this packet destined? After all, if it carries no higher-layer dat a then it doesn’t seem to be very useful toa higher layer protocol such as HTTP!∙In a classic layered model, one message from a higher layer has a header appended by the lower layer to make it a new message. But this is not always the case. Above, we saw a trace in which the web response (one HTTP message that is comprised of an HTTP header and an HTTP payload) was converted into multiple lower layer messages (multiple TCP packets).Imagine that you have drawn the packet structure (as seen in Step 2) for the first and last TCP packet carrying the web response. How will the drawings differ?∙In a classic layered model, lower layers append headers to the messages passed down from higher layers. How will this model change if a lower layer adds encryption?∙In a classic layered model, lower layers append headers to the messages passed down from higher layers. How will this model change if a lower layer adds compression?。
- 1、下载文档前请自行甄别文档内容的完整性,平台不提供额外的编辑、内容补充、找答案等附加服务。
- 2、"仅部分预览"的文档,不可在线预览部分如存在完整性等问题,可反馈申请退款(可完整预览的文档不适用该条件!)。
- 3、如文档侵犯您的权益,请联系客服反馈,我们会尽快为您处理(人工客服工作时间:9:00-18:30)。
Lab Exercise – Protocol LayersObjectiveTo learn how protocols and layering are represented in packets. They are key concepts for structuring networks that are covered in the text.The trace for this lab is here:/~kevin/com320/labs/wireshark/trace-protocol-layers.pcap(although the main trace you will look at is from a site you pick such as in the exam-ples which follow).RequirementsWireshark: This lab uses the Wireshark software tool to capture and examine a packet trace. A packet trace is a record of traffic at a location on the network, as if a snapshot was taken of all the bits that passed across a particular wire. The packet trace records a timestamp for each packet, along with the bits that make up the packet, from the lower-layer headers to the higher-layer contents. Wireshark runs on most operating systems, including Windows, Mac and Linux. It provides a graphical UI that shows the sequence of packets and the meaning of the bits when interpreted as protocol headers and data. It col-or-codes packets by their type, and has various ways to filter and analyze packets to let you investigate the behavior of network protocols. Wireshark is widely used to troubleshoot networks. You can down-load it from for your personal computer. It is an ideal packet analyzer for our labs –it is stable, has a large user base and well-documented support that includes a user-guide /docs/wsug_html_chunked), and a detailed FAQ, rich functionality that in-cludes the capability to analyze hundreds of protocols, and a well-designed user interface. It operates in computers using Ethernet, serial (PPP and SLIP), 802.11 wireless LANs, and many other link-layer tech-nologies (if the OS on which it is running allows Wireshark to do so). It is already installed in the labs.A quick help guide to Wireshark display filters is here: /wireshark_filters.php Wireshark is a c ore tool for any wireless ‘man in the middle’ or similar snooping attack. It is simply in-dispensable for those who wish to examine packets being transferred over a network –good or bad…..Wireshark & Packet Sniffing BackgroundThe basic tool for observing the messages exchanged between executing protocol entities is called a packet sniffer. As the name suggests, a packet sniffer captures (“sniffs”) messages being sent/received from/by your computer; it will also typically store and/or display the contents of the various protocol fields in these captured messages. A packet sniffer itself is passive. It observes messages being sent and received by applications and protocols running on your computer, but never sends packets itself. Simi-larly, received packets are never explicitly addressed to the packet sniffer. Instead, a packet sniffer re-ceives a copy of packets that are sent/received from/by application and protocols executing on your machine.Figure 1 shows the structure of a packet sniffer. At the right of Figure 1 are the protocols (in this case, Internet protocols) and applications (such as a web browser or ftp client) that normally run on your computer. The packet sniffer, shown within the dashed rectangle in Figure 1 is an addition to the usual software in your computer, and consists of two parts. The packet capture library receives a copy of eve-ry link-layer frame that is sent from or received by your computer. Messages exchanged by higher layer protocols such as HTTP, FTP, TCP, UDP, DNS, or IP all are eventually encapsulated in link-layer frames that are transmitted over physical media such as an Ethernet cable.Figure 1: Packet Sniffer StructureIn Figure 1, the assumed physical media is an Ethernet, and so all upper-layer protocols are eventually encapsulated within an Ethernet frame. Capturing all link-layer frames thus gives you all messagessent/received from/by all protocols and applications executing in your computer.The second component of a packet sniffer is the packet analyzer, which displays the contents of all fields within a protocol message. In order to do so, the packet analyzer must “understand” the structure of all messages exchanged by protocols. For example, suppose we are interested in displaying the various fields in messages exchanged by the HTTP protocol in Figure 1. The packet analyzer understands the format of Ethernet frames, and so can identify the IP datagram within an Ethernet frame. It also under-stands the IP datagram format, so that it can extract the TCP segment within the IP datagram. Finally, it understands the TCP segment structure, so it can extract the HTTP message contained in the TCP seg-ment. Finally, it understands the HTTP protocol and so, for example, knows that the first bytes of an HTTP message will contain the string “GET,”“POST,” or “HEAD,”.Step 1: Capture a Traceunching WiresharkYou can type Wireshark in the run box of main Windows 8 start screen. Press the Windows key on the keyboard and type “wireshark”. If a problem launching it then see here1.Figure 2: Wireshark in lab2.Just close the dialog box which prompts you to install a new version. You will then see a startupscreen, as shown next.Figure 3: Initial Wireshark Screen3.Take a look at the left hand side of the screen –you’ll see an “Interface list”. This is the list ofnetwork interfaces on your computer. Choose Ethernet.1 It should load but there can be a problem with the new lab configuration for Wireshark and npf driver. Therefore if this is not working…. then please do the next step. Launch Wireshark as follows. Click desktop icon on main windows screen & use the file explorer to browse to C:\local Disk (C)\Program Files\Wireshark. Finally, RIGHT CLICK on Wireshark as “Run as administrator”.4.Next, click Start (as shown below).5.Wireshark will capture all packets on that interface. Click on the network card on the particularmachine you are working on. In the example above, it is the Ethernet Driver to start packet cap-ture (i.e., for Wireshark to begin capturing all packets being sent to/from that interface), ascreen like the one below will be displayed, showing information about the packets being cap-tured. Once you start packet capture, you can stop it by using the Capture pull down menu and selecting Stop.We want this trace to look at the protocol structure of packets. A simple Web fetch of a URL from a server of your choice to your computer, which is the client, could also serve as traffic.6.Open your browser, e.g. Chrome and pick a URL & fetch it e.g.”.7.Close unnecessary browser tabs and windows. By minimizing browser activity you will stop yourcomputer from fetching unnecessary web content, and avoid incidental traffic in the trace.8.Now return to Wireshark and you will see a screen similar to below.That is all for now. Next you will read a little more about Wireshark and tracing packets.Main Wireshark InterfaceThe Wireshark interface has five major components:Figure 4: Wireshark Graphical User Interface, during packet capture and analysis• The command menus are standard pull down menus located at the top of the window. The File menu allows you to save captured packet data or open a file containing previously captured packet data. The Capture menu allows you to begin packet capture.• The packet-listing window displays a one-line summary for each packet captured, including the pack-et number (assigned by Wireshark; this is not a packet number contained in any protocol’s header), the time at which the packet was captured, the packet’s source and destination addresses, the protocol type, and protocol-specific information contained in the packet. The packet listing can be sorted accord-ing to any of these categories by clicking on a column name. The protocol type field lists the highest-level protocol that sent or received this packet, i.e., the protocol that is source or ultimate sink for this packet.• The packet-header details window provides details about the packet selected (highlighted) in the packet-listing window. (To select a packet in the packet-listing window, place the cursor over the pack-et’s one-line summary in the packet-listing window and click with the left mouse button.). These details include information about the Ethernet frame (assuming the packet was sent/received over an Ethernet interface) and IP datagram that contains this packet. The amount of Ethernet and IP-layer detail dis-played can be expanded or minimized by clicking on the plus minus boxes to the left of the Ethernet frame or IP datagram line in the packet details window.• The packet-contents window displays the entire contents of the captured frame, in both ASCII and hexadecimal format. Towards the top of the Wireshark graphical user interface, is the packet display fil-ter field, into which a protocol name or other information can be entered in order to filter the infor-mation displayed in the packet-listing window.Filtering TrafficNow return to your Wireshark trace captured earlier. We will look to see how we can isolate the Web Page traffic from the other protocol packets.9.You have two options. You can simply type “tcp.port==80” in the main filter box on the mainscreen like below.10.Instead of the method above, you can also filter by typing “port 80” in the filter box like below.This filter will record only standard web traffic and not other kinds of packets that your comput-er may send. The checking will translate the addresses of the computers sending and receivingpackets into names, which should help you to recognize whether the packets are going to orfrom your computer. Your capture window will be similar to the one pictured in next screenshot.Figure 5: Setting up the capture options11.When the capture is started, visit a site which uses http (not https). This time, the packets will berecorded by Wireshark as the content is transferred. Try again, in your browser.12.After the fetch is successful, return to Wireshark and use the menus or buttons to stop the trace.If you have succeeded, the upper Wireshark window will show multiple packets, and most likely it will be full. How many packets are captured will depend on the size of the web page, but there should be at least 8 packets in the trace, and typically 20-100, and many of these packets will be colored green. I recommend you stop recording by pressing the Red Stop button on the inter-face as this will make it easier for you to scroll back to the start of the request to find the “200 OK” packet. An example is shown below. Congratulations, you have captured a trace!Figure 6: Packet trace of web browsing trafficStep 2: Inspect the TraceSelect a packet for which the Protocol column is “HTTP” and the Info column says it is a GET. It is the packet that carries the web (HTTP) request sent from your computer to the server. (You can click the column headings to sort by that value, though it should not be difficult to find an HTTP packet by inspec-tion.) Let’s have a closer look to s ee how the packet structure reflects the protocols that are in use. Since we are fetching a web page, we know that the protocol layers being used are as shown below. That is, HTTP is the application layer web protocol used to fetch URLs. Like many Internet applications, it runs on top of the TCP/IP transport and network layer protocols. The link and physical layer protocols depend on your network, but are typically combined in the form of Ethernet (shown) if your computer is wired, or 802.11 (not shown) if your computer is wireless.Figure 7: Protocol stack for a web fetchWith the HTTP GET packet selected, look closely to see the similarities and differences between it and our protocol stack as described next. The protocol blocks are listed in the middle panel. You can expand each block (by clicking on the “+” expander or icon) to see its details.• The first Wireshark block is “Frame”. This is not a protocol, it is a record that describes overall information about the packet, including when it was captured and how many bits long it is.• The second block is “Ethernet”. Note that you may have taken a trace on a computer using 802.11 yet still see an Ethernet block instead of an 802.11 block. Why? It happens because we asked Wireshark to capture traffic in Ethernet format on the capture options, so it converted the real 802.11 header into a pseudo-Ethernet header.• Then come IP, TCP, and HTTP, which are just as we wanted. Note that the order is from the bot-tom of the protocol stack upwards. This is because as packets are passed down the stack, the header information of the lower layer protocol is added to the front of the information from the higher layer protocol, as in Fig. 1-15 of your text. That is, the lower layer protocols come first in the packet “on the wire”.HTTPTCPIP Ethernet ClientServer HTTP TCP IPEthernetpacketStep 3: Inspect the Trace AgainNow find another HTTP packet, the response from the server to your computer, and look at the structure of this packet for the differences compared to the HTTP GET packet.This packet should have “200 OK” in the Info field, denoting a successful fetch. In our trace, there are two extra blocks in the detail panel as seen in the next figure.•The first extra block says something like “[... reassembled TCP segments …]”. Details in your cap-ture will vary, but this block is describing more than the packet itself. Most likely, the web re-sponse was sent across the network as a series of packets that were put together after they ar-rived at the computer. The packet labeled HTTP is the last packet in the web response, and the block lists packets that are joined together to obtain the complete web response. Each of these packets is shown as having protocol TCP even though the packets carry part of an HTTP re-sponse. Only the final packet is shown as having protocol HTTP when the complete HTTP mes-sage may be understood, and it lists the packets that are joined together to make the HTTP re-sponse.•The second extra block says “Line-based text data …”. Details in your capture will vary, but this block is describing the contents of the web page that was fetched. In our case it is of typetext/html, though it could easily have been text/xml, image/jpeg, or many other types. As with the Frame record, this is not a true protocol. Instead, it is a description of packet contents that Wireshark is producing to help us understand the network traffic.Figure 8: Inspecting a HTTP “200 OK” response1.Locate the HTTP GET packet which has “200 OK (text/html)” in the Info field, denoting asuccessful fetch. See below for instance in the third line in white.2.Scroll down in the middle pane to [+] Line-based text data: text/html and rightclick with your mouse. (See above)3.From the context menu which now appears, select Copy -→ Bytes → Printable Text Only Youshould see a window similar to the following popup window below.4.This copies all the code for the Ulster home page.5.Open up a text editor such as notepad++ and paste this HTML code into a new document. Saveas UlsterHomePage.html in a directory such as W: or downloads. Next open up explorer and scroll to where you have saved the file and open it in the default browser by clicking on it.6.Note how much of the Ulster home page actually gets sent over the wire to your PC.Step 4: Packet StructureExamine a HTTP GET packet that shows the position and size in bytes of the TCP, IP and Ethernet proto-col headers. Note the range of the Ethernet header and the Ethernet payload that IP passes to Ethernet to send over the network. Note also the range of the IP header and the IP payload.To work out sizes, observe that when you click on a protocol block in the middle panel (the block itself, not the “+” expander) then Wireshark will highlight the bytes it corresponds to in the packet in the lower panel and display the length at the bottom of the window. For instance, clicking on the IP version 4 header of a packet in our trace shows us that the length is 20 bytes. (Your trace will be different if it is IPv6, and may be different even with IPv4 depend-ing on various options.) You may also use the overall packet size shown in the Length column or Frame detail block. AnswerFigure 9: Protocol layer structure of the HTTP GET packet There are several features to note:• The order of the headers (Ethernet, IP, TCP, HTTP) is the protocol stack from the bottom up-wards because the lower layers are outermost in the packet as it travels through the network. • Observant students will note some differences between the Ethernet header size in Wireshark and in the text that will be explored in later labs.• The size of the IP and TCP headers is normally around 20 bytes each, but it may be larger in some cases depending on the OS, e.g., IPv6 instead of IPv4 and optional TCP header fields might double these numbers.• The size of the HTTP message will vary depending on what tool and URL is used to send the web request. For wget/curl, it is likely to be around 100-300 bytes.• The Ethernet payload comprises everything beyond the Ethernet header. That is, Ethernet does not understand the IP / TCP / HTTP internal structure; it is up to higher layers to determine their headers and message boundaries.• Similarly, the IP payload comprises everything beyond the IP header. Note that neither the IP header nor payload covers the Ethernet header. HTTP EthernetIP TCP 14 bytes 20 bytes20 bytes 112 bytesEthernet header Ethernet payload166 bytes totalStart of packetIP header IP payloadStep 5: Demultiplexing KeysWhen an Ethernet frame arrives at a computer, the Ethernet layer must hand the packet that it contains to the next higher layer to be processed. The act of finding the right higher layer to process received packets is called demultiplexing. We know that in our case the higher layer is IP. But how does the Ethernet protocol know this? After all, the higher-layer could have been another protocol entirely (such as ARP). We have the same issue at the IP layer – IP must be able to determine that the contents of IP message is a TCP packet so that it can hand it to the TCP protocol to process. The answer is that proto-cols use information in their header known as a “demultiplexing key” to determine the higher layer. Look at the Ethernet and IP headers of a download packet in detail to answer the following questions:1.Which Ethernet header field is the demultiplexing key that tells it the next higher layer is IP?What value is used in this field to indicate “IP”?Answer. The demultiplexing key for Ethernet is the Type field. It holds 0x800 when the higherlayer is IP.2.Which IP header field is the demultiplexing key that tells it the next higher layer is TCP? Whatvalue is used in this field to indicate “TCP”?Answer: The demultiplexing key for IP is the Protocol field. It has value 6 when the higher layer is TCP.。