wireshark练习及答案lab-http
计算机网络实验课 Lab5_Wireshark_IP
Outline
• IP Datagram
• Experimental Procedures • Questions
IP Datagram
Experimental Procedures(windows)
• Step 1: Start Wireshark. • Step 2: Start Pingplotter
• 实验报告中的IP地址不能一样
• 截图后请配上文字说明 举例: The IP address of my computer:172.18.63.180
Thank you!
• Enter address: • Set packet size as 56, press Trace.
• Step 3: Pingplotter
• set packet size as 2000 • press Resume.
• Step 4: Pingplotter
• set packet size as 3500, • press Resume.
• Step 5: Stop Wireshark. • Step 6: Analysis the captured result
and answer the following questions.
Select the first ICMP Echo Request message
• 12. Print out the second fragment of the fragmented IP datagram. What information in the IP header indicates that this is not the first datagram fragment? Are the more fragments? How can you tell? (答案请截图,10分)
实验六利用Wireshark分析协议HTTP

实验六利用W i r e s h a r k 分析协议H T T P文件编码(GHTU-UITID-GGBKT-POIU-WUUI-8968)实验六利用W i r e s h a r k分析协议H T T P 一、实验目的分析HTTP协议二、实验环境与因特网连接的计算机,操作系统为Windows,安装有Wireshark、IE等软件。
三、实验步骤1、利用Wireshark俘获HTTP分组(1)在进行跟踪之前,我们首先清空Web 浏览器的高速缓存来确保Web网页是从网络中获取的,而不是从高速缓冲中取得的。
之后,还要在客户端清空DNS高速缓存,来确保Web服务器域名到IP地址的映射是从网络中请求。
在WindowsXP机器上,可在命令提示行输入ipconfig/flushdns(清除DNS解析程序缓存)完成操作。
(2)启动Wireshark 分组俘获器。
(3)在Web 浏览器中输入:(4)停止分组俘获。
图利用Wireshark俘获的HTTP分组在URL 中,是一个具体的web 服务器的域名。
最前面有两个DNS 分组。
第一个分组是将域名转换成为对应的IP 地址的请求,第二个分组包含了转换的结果。
这个转换是必要的,因为网络层协议——IP协议,是通过点分十进制来表示因特网主机的,而不是通过这样的域名。
当输入URL http://时,将要求Web服务器从主机上请求数据,但首先Web 浏览器必须确定这个主机的IP地址。
随着转换的完成,Web浏览器与Web服务器建立一个TCP连接。
最后,Web 浏览器使用已建立好的TCP连接来发送请求“GET/HTTP/1.1”。
这个分组描述了要求的行为(“GET”)及文件(只写“/”是因为我们没有指定额外的文件名),还有所用到的协议的版本(“HTTP/1.1”)。
2、HTTP GET/response交互(1)在协议框中,选择“GET/HTTP/1.1” 所在的分组会看到这个基本请求行后跟随着一系列额外的请求首部。
Wireshark抓包实例分析 (DNS和HTTP协议)

(八)参考资料
《计算机科学网络 自顶向下的方法》 第四版 陈鸣 译 《WireShark 教程用户使用手册》 《学习用 wireshark 进行抓包分析》 罗小嘉
表单数据以及浏览记录等等。 3、单击开始,打开运行,输入'cmd',输入命令'ipconfig/flushdns',回车,即
可看到成功刷新 DNS 缓存的显示。
2、WireShark 的使用
(1) 启动 WireShark。 (2) 启动 PC 上的 IE 浏览器。 (3) 开始分组捕获:选择“抓包”下拉菜单中的“抓包参数选择”命令,在
图二
其中,第一行为该包的信息,第二行为以太网,属于链路层,第三行为 IP 协 议,属于网络层(源 IP 与目的 IP 显示在该行),第四行为 UDP 协议,属于传输 层,第五行为 DNS 的有关数据。下面将通过图三详细分析 DNS 报文的内容。
这是一个请求查询 的报文(0),该报文没有 被删节,采用的是递归调 用的查询,问题数为 1, 回答 RR 数,权威 RR 数 以及附加 RR 数均为 0。 在问题区域显示了名字 字段与被查询的问题类 型 A(即主机地址)。
计算机网络技术基础目录一封面第1页二目录第2页三内容一实验背景介绍第3页二实验目的及任务第3页三实验环境第3页四实验原理第3页五实验步骤第3页1实验前的准备工作第4页2wireshark的使用第4页六实验结果分析第4页1dns分析第45页2http分析第67页七实验总结第7页八参考资料第7页内容一实验背景介绍wireshark简介wireshark原ethereal是目前最流行的一款网络封包分析软件
计算机网络wireshark-实验参考资料

《计算机网络原理》实验参考资料金可音2012.11.18湖南工业大学计算机与通信学院网络工程系总体要求一、实验目的1.学习并掌握网络协议分析软件Wireshark的使用方法,学会捕获网络上传输的协议数据单元,观察、分析网络协议首部。
2.加深理解以太网EthernetⅡ协议及其帧的语法(帧格式)和语义3.加深理解互联网IP协议及其数据报的语法(包格式)和语义4.加深理解互联网TCP协议及其报文段的语法(报文段格式)和语义5.加深理解互联网DNS服务及其报文的语法(报文格式)和语义6.加深理解互联网HTTP协议及其报文的语法(报文格式)和语义二、实验原理1.以太网MAC层EtherⅡ协议原理2.TCP/IP协议族中网络层、传输层、应用层相关协议原理3.网络协议分析工具Wireshark的工作原理和基本使用规则三、实验环境1.与因特网连接的计算机网络系统;2.主机操作系统为windows;3.主机上安装了WireShark、IE等软件。
四、实验内容访问百度主页,用WireShark工具捕获以下五个协议的有关协议数据单元,并分析以下五个协议:1.以太网EtherⅡ协议2.互联网IP层协议3.互联网UDP协议4.互联网DNS5.互联网HTTP五、实验步骤1.关闭所有上网的软件(如QQ等)2.在MSDOS下(1)使用ARP–d*命令清除自己电脑中MAC和IP映射表。
(2)用ipconfig /flushdns:清空本地的DNS解析器的缓存。
(3)P ing ,找出对应的IP地址,用来验证WireShark实验的结果3.启动web浏览器,清空浏览器缓存(在IE窗口中,选择“工具/Internet选项/删除文件”命令)。
4.启动网络协议分析软件WireShark,完成相关的设置(“capture-Optios”),开始捕获数据帧。
5.使用主机上的web浏览器,浏览百度主页()6.在Packet List Pane(列表面板/列表框)分别查看并分析相关的数据帧,查看并分析其中封装的有关协议的首部控制信息,完成以下五个实验报告。
wireshark抓包分析2篇
wireshark抓包分析2篇第一篇:Wireshark抓包分析HTTP协议Wireshark是一款网络分析工具,可用于抓取网络传输过程中的数据包,方便分析瓶颈和故障。
本文将以抓取HTTP协议为例,演示Wireshark的使用方法,并分析数据包内容。
1. 抓取HTTP协议数据包启动Wireshark,选择网络接口和捕获过滤器。
为了抓取HTTP协议的数据包,可以输入"tcp port 80"作为过滤器,表示只抓取端口为80的TCP数据包,即HTTP协议的数据包。
2. 分析HTTP协议数据包抓取到的HTTP协议数据包可通过Wireshark的命令行界面或图形界面进行分析,下面分别介绍。
(1) 命令行界面在Wireshark的命令行界面中,可以查看每个数据包的详细信息,并按需提取关键信息。
例如,输入"frame.number"命令可显示数据包编号,输入"ip.src"命令可显示源IP地址,输入"http.request.full_uri"命令可显示请求的URL地址等。
(2) 图形界面在Wireshark的图形界面中,可以以树形结构或表格形式查看每个数据包的详细信息。
在HTTP协议的数据包中,关键信息如下:- HTTP Request:包括请求方法(GET/POST等)、请求头、请求正文等。
- HTTP Response:包括状态码、响应头、响应正文等。
- 源IP地址和目的IP地址:代表客户端和服务器的IP 地址。
- 源端口号和目的端口号:代表客户端和服务器的TCP 端口号。
通过分析HTTP协议数据包,可以查看请求和响应信息,了解应用程序和服务器的交互过程。
也可以检查请求/响应是否存在异常,例如请求头或响应正文长度异常、响应状态码为4xx或5xx等。
本文仅介绍了抓取和分析HTTP协议数据包的基本方法,Wireshark还可以用于分析其他协议的数据包,例如TCP、DHCP、DNS等。
实验7 利用分组嗅探器(Wireshark)分析协议HTTP和DNS
实验七利用分组嗅探器(Wireshark)分析协议HTTP和DNS一、实验目的1、分析HTTP协议2、分析DNS协议二、实验环境与因特网连接的计算机网络系统;主机操作系统为Windows;Wireshark、IE 等软件。
三、实验步骤1、HTTP GET/response交互首先通过下载一个非常简单的HTML文件(该文件非常短,并且不嵌入任何对象)。
(1)启动Web browser。
(2)启动Wireshark分组嗅探器。
在窗口的显示过滤说明处输入“http”,分组列表子窗口中将只显示所俘获到的HTTP报文。
(3)一分钟以后,开始Wireshark分组俘获。
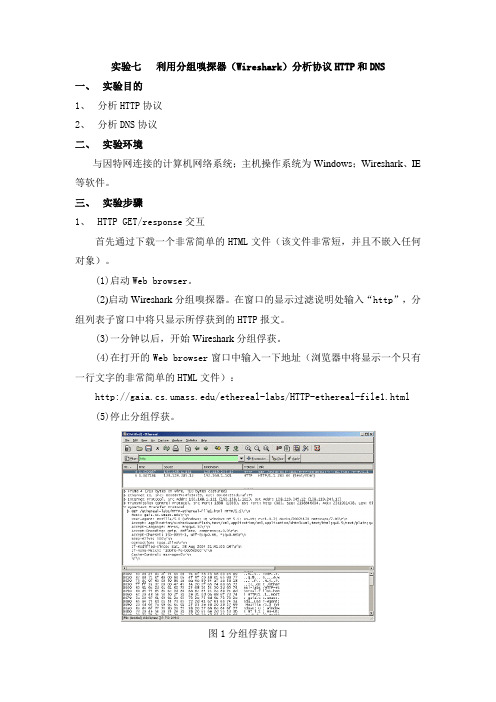
(4)在打开的Web browser窗口中输入一下地址(浏览器中将显示一个只有一行文字的非常简单的HTML文件):/ethereal-labs/HTTP-ethereal-file1.html(5)停止分组俘获。
图1分组俘获窗口2、HTTP 条件GET/response交互(1)启动浏览器,清空浏览器的缓存(在浏览器中,选择“工具”菜单中的“Internet选项”命令,在出现的对话框中,选择“删除文件”)。
(2)启动Wireshark分组俘获器。
开始Wireshark分组俘获。
(3)在浏览器的地址栏中输入以下URL:/ethereal-labs/HTTP-ethereal-file2.html 你的浏览器中将显示一个具有五行的非常简单的HTML文件。
(4)在你的浏览器中重新输入相同的URL或单击浏览器中的“刷新”按钮。
(5)停止Wireshark分组俘获,在显示过滤筛选说明处输入“http”,分组列表子窗口中将只显示所俘获到的HTTP报文。
3、获取长文件(1)启动浏览器,将浏览器的缓存清空。
(2)启动Wireshark分组俘获器。
开始Wireshark分组俘获。
(3)在浏览器的地址栏中输入以下URL:/ethereal-labs/HTTP-ethereal-file3.html 浏览器将显示一个相当大的美国权力法案。
利用WireShark分析HTTP和DNS
利用WireShark分析HTTP和DNS一、实验目的及任务1、熟悉并掌握WireShark的基本操作,了解网络协议实体间的交互以及报文交换。
2、分析HTTP协议3、分析DNS协议二、实验环境与因特网连接的计算机网络系统;主机操作系统为Windows2000或Windows XP;WireShark等软件。
三、预备知识要深入理解网络协议,需要仔细观察协议实体之间交换的报文序列。
为探究协议操作细节,可使协议实体执行某些动作,观察这些动作及其影响。
这些任务可以在仿真环境下或在如因特网这样的真实网络环境中完成。
观察在正在运行协议实体间交换报文的基本工具被称为分组嗅探器(packet sniffer)。
顾名思义,一个分组嗅探器捕获(嗅探)计算机发送和接收的报文。
一般情况下,分组嗅探器将存储和显示出被捕获报文的各协议头部字段内容。
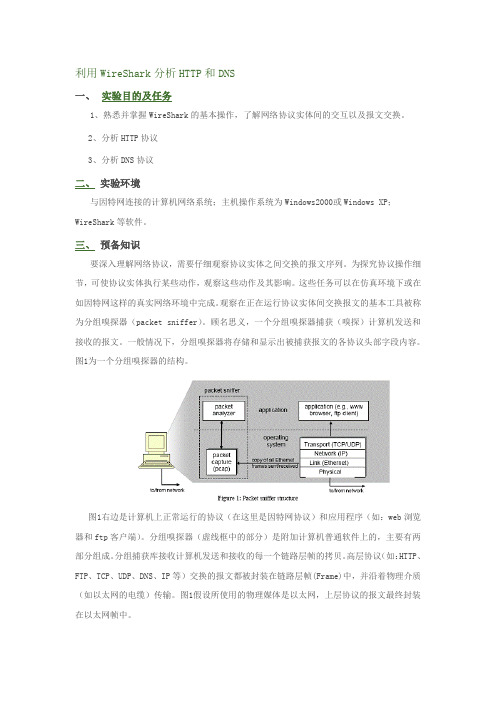
图1为一个分组嗅探器的结构。
图1右边是计算机上正常运行的协议(在这里是因特网协议)和应用程序(如:web浏览器和ftp客户端)。
分组嗅探器(虚线框中的部分)是附加计算机普通软件上的,主要有两部分组成。
分组捕获库接收计算机发送和接收的每一个链路层帧的拷贝。
高层协议(如:HTTP、FTP、TCP、UDP、DNS、IP等)交换的报文都被封装在链路层帧(Frame)中,并沿着物理介质(如以太网的电缆)传输。
图1假设所使用的物理媒体是以太网,上层协议的报文最终封装在以太网帧中。
分组嗅探器的第二个组成部分是分析器。
分析器用来显示协议报文所有字段的内容。
为此,分析器必须能够理解协议所交换的所有报文的结构。
例如:我们要显示图1中HTTP协议所交换的报文的各个字段。
分组分析器理解以太网帧格式,能够识别包含在帧中的IP数据报。
分组分析器也要理解IP数据报的格式,并能从IP数据报中提取出TCP报文段。
然后,它需要理解TCP报文段,并能够从中提取出HTTP消息。
最后,它需要理解HTTP消息。
WireShark是一种可以运行在Windows, UNIX, Linux等操作系统上的分组分析器.用户界面如图2所示。
实训二 用WireShark分析IP、TCP、HTTP

计算机学院网络工程2012(1)班学号:3112006354 姓名:詹德超实训二用WireShark分析IP、TCP、HTTP一、实验目的1.分析HTTP协议报文的首部格式,理解HTTP协议的工作过程。
2.用Wireshark 捕获和分析HTTP 报文。
二、实验设备1.接入Internet的计算机主机;2.抓包工具WireShark。
三、实验内容1.HTTP 协议简介HTTP 是超文本传输协议(Hyper Text Transfer Protocol)的缩写,用于WWW 服务。
(1)HTTP 的工作原理HTTP 是一个面向事务的客户服务器协议。
尽管HTTP 使用TCP 作为底层传输协议,但HTTP协议是无状态的。
也就是说,每个事务都是独立地进行处理。
当一个事务开始时,就在万维网客户和服务器之间建立一个TCP 连接,而当事务结束时就释放这个连接。
此外,客户可以使用多个端口和服务器(80 端口)之间建立多个连接。
其工作过程包括以下几个阶段。
①服务器监听TCP 端口 80,以便发现是否有浏览器(客户进程)向它发出连接请求;②一旦监听到连接请求,立即建立连接。
③浏览器向服务器发出浏览某个页面的请求,服务器接着返回所请求的页面作为响应。
④释放TCP 连接。
在浏览器和服务器之间的请求和响应的交互,必须遵循HTTP 规定的格式和规则。
当用户在浏览器的地址栏输入要访问的HTTP 服务器地址时,浏览器和被访问HTTP 服务器的工作过程如下:①浏览器分析待访问页面的URL 并向本地DNS 服务器请求IP 地解析;② DNS 服务器解析出该HTTP 服务器的IP 地址并将IP 地址返回给浏览器;③浏览器与HTTP 服务器建立TCP 连接,若连接成功,则进入下一步;④浏览器向HTTP 服务器发出请求报文(含GET 信息),请求访问服务器的指定页面;⑤服务器作出响应,将浏览器要访问的页面发送给浏览器,在页面传输过程中,浏览器会打开多个端口,与服务器建立多个连接;⑥释放TCP 连接;⑦浏览器收到页面并显示给用户。
- 1、下载文档前请自行甄别文档内容的完整性,平台不提供额外的编辑、内容补充、找答案等附加服务。
- 2、"仅部分预览"的文档,不可在线预览部分如存在完整性等问题,可反馈申请退款(可完整预览的文档不适用该条件!)。
- 3、如文档侵犯您的权益,请联系客服反馈,我们会尽快为您处理(人工客服工作时间:9:00-18:30)。
Lab Exercise – HTTPObjectiveHTTP (HyperText Transfer Protocol) is the main protocol underlying the Web. The trace file is here: /~kevin/com320/labs/wireshark/trace-http.pcapStep 1: Capture a TraceCapture a trace of your browser making HTTP requests as follows; alternatively, you may use a supplied trace. Now that we seen how a GET works, we will observe your browser as it makes HTTP requests. Browser behavior can be quite complex, using more HTTP features than the basic exchange, so we will set up a simple scenario. We are assuming that your browser will use HTTP in this simple scenario rather than newer Web protocols such as SPDY, and if this is not the case you will need to disable SPDY.e your browser to find two URLs with which to experiment, both of which are HTTP (not HTTPS)URLs with no special port. The first URL should be that of a small to medium-sized image,whether .jpg, .gif, or .png. We want some static content without embedded resources. You canoften find such a URL by right-clicking on unlinked images in web pages to tell your browser toopen the URL of the image directly. The second URL should be the home page of some majorweb site that you would like to study. It will be complex by comparison. Visit both URLs to check that they work, then keep them handy outside of the browser so you can cut-and-paste them.2.Prepare your browser by reducing HTTP activity and clearing the cache. Apart from one freshtab that you will use, close all other tabs, windows to minimize HTTP traffic.unch Wireshark and start a capture with a filter of “tcp port 80”.We use this filter be-cause there is no shorthand for HTTP, but HTTP is normally carried on TCP port 80.Figure 2: Setting up the capture options4.Fetch the following sequence of URLs, after you wait for a moment to check that there is noHTTP traffic. If there is HTTP traffic then you need to find and close the application that is caus-ing it. Otherwise your trace will have too much HTTP traffic for you to understand. You will paste each URL into the browser URL bar and press Enter to fetch it. Do not type the URL, as this may cause the browser to generate additional HTTP requests as it tries to auto-complete your typing.a.Fetch the first static image URL by pasting the URL into the browser bar and pressing“Enter” or whatever is required to run your browser.b.Wait 10 seconds, and re-fetch the static image URL. Do this in the same manner, andwithout using the “Reload” button of your browser, lest it trigger other behavior.c.Wait another 10 seconds, and fetch the second home page URL.5.Stop the capture after the fetches are complete. You should have a window full of trace in whichthe protocol of some packets is listed as HTTP – if you do not have any HTTP packets there is a problem with the setup such as your browser using SPDY instead of HTTP to fetch web pages.Figure 3: Trace of HTTP traffic showing the details of the HTTP headerStep 2: Inspect the TraceTo focus on HTTP traffic, enter and apply a filter expression of“http”. This filter will show HTTP re-quests and responses, but not the individual packets that are involved. Recall that an HTTP response car-rying content will normally be spread across multiple packets. When the last packet in the response ar-rives, Wireshark assembles the complete response and tags the packet with protocol HTTP. The earlier packets are simply TCP segments carrying data; the last packet tagged HTTP includes a list of all the ear-lier packets used to make the response. A similar process occurs for the request, but in this case it is common for a request to fit in a single packet. With the filter expression of “http” we will hide the in-termediate TCP packets and see only the HTTP requests and responses. With this filter, your Wireshark display should be similar to the figure showing our example.Select the first GET in the trace, and expand its HTTP block. This will let us inspect the details of an HTTP request. Observe that the HTTP header follows the TCP and IP headers, as HTTP is an application proto-col that is transported using TCP/IP. To view it, select the packet, find the HTTP block in the middle panel, and expand it (by using the “+” expander or icon). This block is expanded in our figure.Explore the headers that are sent along with the request. First, you will see the GET method at the start of the request, including details such as the path. Then you will see a series of headers in the form of tagged parameters. There may be many headers, and the choice of headers and their values vary from browser to browser. See if you have any of these common headers:•Host. A mandatory header, it identifies the name (and port) of the server.•User-Agent. The kind of browser and its capabilities.•Accept, Accept-Encoding, Accept-Charset, Accept-Language. Descriptions of the formats that will be accepted in the response, e.g., text/html, including its encoding, e.g., gzip, and language.•Cookie. The name and value of cookies the browser holds for the website.•Cache-Control. Information about how the response can be cached.The request information is sent in a simple text and line-based format. If you look in the bottom panel you can read much of the request directly from the packet itself!Select the response that corresponds to the first GET in the trace, and expand its HTTP block. The Info for this packet will indicate “200 OK” in the case of a normal, successful transfer. You will see that the re-sponse is similar to the request, with a series of headers that follow the “200 OK” status code. However, different headers will be used, and the headers will be followed by the requested content. See if you have any of these common headers:•Server. The kind of server and its capabilities.•Date, Last-Modified. The time of the response and the time the content last changed.•Cache-Control, Expires, Etag. Information about how the response can be cached.Answer the following questions: (answers on next page)1.What is the format of a header line? Give a simple description that fits the headers you see.2.What headers are used to indicate the kind and length of content that is returned in a response?Answers to Inspect the Trace1.Each header line consists of the name of the header field and its value separated by a colon.There can be whitespace before (and after) the value. The line ends with a “carriage return, line feed” pair of characters, often written CRLF or “\r\n”.2.The type of the content is given by the Content-Type header, and its length is normally given bythe Content-Length header. (It is possible but unlikely that these headers are not present.)Step 3: Content CachingThe second fetch in the trace should be a re-fetch of the first URL. This fetch presents an opportunity for us to look at caching in action, since it is highly likely that the image or document has not changed and therefore does not need to be downloaded again. HTTP caching mechanisms should identify this oppor-tunity. We will now see how they work.Select the GET that is a re-fetch of the first GET, and expand its HTTP block. Likely, this will be the second GET in the trace. However, look carefully because your browser may issue other HTTP requests for its own reasons. For example, you might see a GET for /favicon.ico in the trace. This is the browser request-ing the icon for the site to use as part of the browser display. Similarly, if you typed in the URL bar your browser may have issued GETs as part of its auto-completion routine. We are not interested in this background browser activity at the moment.Now find the header that will let the server work out whether it needs to send fresh content. We will ask you about this header shortly. The server will need to send fresh content only if the content has changed since the browser last downloaded it. To work this out, the browser includes a timestamp tak-en from the previous download for the content that it has cached. This header was not present on the first GET since we cleared the browser cache so the browser had no previous download of the content that it could use. In most other respects, this request will be the same as the first time request. Finally, select the response to the re-fetch, and expand its HTTP block. Assuming that caching worked as expected, this response will not contain the content. Instead, the status code of the response will be “304 Not Modified”. This tells the browser that the content is unchanged from its previous copy, and the cached content can then be displayed.Answer the following questions (answer on next page).1.What is the name of the header the browser sends to let the server work out whether to sendfresh content?2.Where exactly does the timestamp value carried by the header come from?Answers to Content Caching1.The header is called “If-Modified-Since”, i.e., it asks the server to send the content if it has beenmodified since a given time.2.The timestamp value comes from the “Last-Modified” header of the most recent download ofthe content. It is a server timestamp for when the content last changed – it is not a timestamp according to the browser clock, and it is not a timestamp of the time of the downloadStep 4: Complex PagesNow let’s examine the third fetch at the end of the trace. This fetch was for a more complex web page that will likely have embedded resources. So the browser will download the initial HTML plus all of the embedded resources needed to render the page, plus other resources that are requested during the ex-ecution of page scripts. As we will see, a single page can involve many GETs!To summarize the GETs for the third page, bring up a HTTP Load Distribution panel. You will find this panel under “Statistics” and “HTTP”. You can filter for the packets that are part of the third fetch by re-moving the packets from the earlier part of the trace by either time or number. For example, use “frame.number>27” or “frame.time_relative>24” for our trace.Looking at this panel will tell you how many requests were made to which servers. Chances are that your fetch will request content from other servers you might not have suspected to build the page. These other servers may include third parties such as content distribution networks, ad networks, and analytics networks. Our panel is shown below – the page fetch involved 95 requests to 4 different serv-ers!Figure 4: HTTP Load Distribution panelFor a different kind of summary of the GETs, bring up a HTTP Packet Counter panel. You will also find this pane l under “Statistics” and “HTTP”, and y ou should filter for the packets that are part of the third fetch as before. This panel will tell you the kinds of request and responses. Our panel is shown in the figure below. You can see that it consists entirely of GET requests that are matched by 200 OK responses. However, there are a variety of other response codes that you might observe in your trace, such as when the resource is already cached.Figure 5: HTTP Packet Counter panelYou might be curious to know what content is being downloaded by all these requests. As well as seeing the URLs in the Info column, you can get a summary of the URLs in a HTTP Request panel under “Statis-tics” and “HTTP”. Each of the individual requests and responses has the same form we saw in an earlier step. Collectively, they are performed in the process of fetching a complete page with a given URL.For a more detailed look a t the overall page load process, use a site such as Google’s PageSpeed or . These sites will test a URL of your choice and generate a report of the page load activity, telling what requests were fetched at what times and giving tips for decreasing the overall page load time. We have shown the beginning of the “waterfall” diagram for the page load corresponding to our trace in the figure below. After the initial HTML resource is fetched there are many subsequent quick fetches for embedded resources such as JavaScript scripts, CSS stylesheets, images, and more.Figure 6: Start of waterfall graph for (from ) Homework - Explore Your Network Explore HTTP on your own once you have finished this lab. Some suggestions:• Study how web pages lead to a pattern of HTTP requests. Many popular web sites have relative-ly complex pages that require many HTTP requests to build. Moreover, these pages may contin-ue to issue “asynchronous” HTTP requests once they appear to have loaded, to load interactive displays or prepare for the next page, etc. You will see this activity when you find HTTP requests that continue after a page is loaded.• Look at video streaming HTTP traffic. We have looked at web HTTP traffic, but other applica-tions make HTTP requests too. It is common for streaming video clients embedded in browsers like Netflix to download content using a HTTP fetches of many small “chunks” of video. If y ou look at other applications, you may find that many of them use HTTP to shift about content, though often on a port different than port 80... .。