已发表基因组物种汇总资料2012-9-3
已发表基因组文章的物种汇总资料2012-07-25

豆科苜蓿属 500M 灰胞藻门 70M 423 Mb 禾本科,狗尾草属 茄目、茄科、茄属 760Mb 375Mb 葫芦目、葫芦科、甜瓜属 523Mb 姜目、芭蕉科、芭蕉属 盐芥属 260Mb 多孔菌目、 43.3Mb 灵芝科、灵 302Mb 金虎尾目、 亚麻科、亚
2n=16 2n=18 2n=24 2n=24 2n=22 2n=14
蒺藜苜蓿 蓝载藻(灰胞藻 门) 粟(谷子) 番茄 甜瓜 香蕉 盐芥 灵芝 亚麻
Medicago truncatula Cyanophora paradoxa Setaria italica Solanum lycopersicum Cucumis melo L. Musa acuminata Thellungiella salsuginea lucidum Ganoderma Linum usitatissimum
2011.11 2012.02 2012.05 2012.05 2012.07 2012.07 2012.07 2012.06 2012.06
Nature 34.48 Science 29.747 Nature biotechnology 29.495 Nature 34.48 PNAS 9.432 Nature 34.48 PNAS 9.432 Nature communications The Plant Journal 6.969
刊物 Nature Science Science Science Nature Science Science Nature Nature Nature Science Nature Genetics Nature
IF 34.48 29.747 29.747 29.747 34.48 29.747 29.747 34.48 34.48 34.48 29.747 34.284 34.48 Nature 34.48 Nature 34.48 Science 29.747 Nature Biotechnology 29.495 Plant Cell 9.293 Nature 34.284 Genetics Nature 34.284 Genetics Nature 34.284 Genetics PNAS 9.432 PNAS 9.432 DNA Res. 3.525 Science 29.747 Nature biotechnology 29.495 Nature Genetics 34.284 Nature 34.48 Nature Genetics 34.284 Nature Genetics 34.284 Genome biology 6.89 Nature biotechnology 29.495
已发表所有物种基因组汇总资料 更新至2012 9月

动物基因组(81) 中文名 秀丽隐杆线虫 黑腹果蝇 冈比亚按蚊 小家鼠 红鳍东方豚 玻璃海鞘 线虫 大鼠 黑斑鲀 家蚕 鸡 拟暗果蝇 克氏锥虫 黑猩猩 狗 意蜂 海胆 姥鲨 猕猴 短尾负鼠 青鳉鱼 伊蚊 马来线虫
拉丁名 Caenorhabditis elegans Drosophila melanogaster Anopheles gambiae Mus musculus Fugu rubripes Ciona intestinalis Caenorhabditis briggsae Rattus norvegicus Tetraodon nigroviridis Bombyx mori Gallus sonneratii Drosophila pseudoobscura Trypanosoma cruzi Pan troglodytes Canis familiaris Apis mellifera Strongylocentrotus purpuratus Callorhinchus milii Macaca mulatta Monodelphis domestica Oryzias latipes Aedes aegypti Brugia malayi
刊物 科、属 基因组大小 Science 97M 小杆总科、Caenorhabditis亚属 Science 果蝇科、果蝇属180M Science 蚊科、按蚊属 280M Nature 鼠科 2.5 G Science 鲀科、东方鲀属380M Science 150M 海鞘纲 PLoS Biology Caenorhabditis亚属 104M Nature 啮齿目、鼠科 2.75 G Nature 鲀科 340M Science 鳞翅目、蚕蛾科428.7 M Nature 雉科、原鸡属 1.06G Genome research 果蝇科、果蝇属139M Science 67M 锥虫属 Nature 2.7G 猩猩科、黑猩猩属 Nature 2.5 G 犬科、犬属 Nature 236M 昆虫纲 Science 1G 海胆纲 Plos Biology 软骨鱼纲、银鲛目 0.91G Science 猴科、猕猴属 2.87G Nature 3.4G 负鼠科、短尾负鼠属 Naturer 700M 青鳉属 Science 蚊科、伊蚊属 1376M Science 90M 线虫纲
12个物种miR_302基因簇的生物信息学分析
基因组学与应用生物学,2010年,第30卷,第3期,第379-384页Genomics and Applied Biology,2010,Vol.30,No.3,379-384数据分析An Analysis12个物种miR-302基因簇的生物信息学分析崔亚茹1张坤山2罗玉萍1李思光1,2*1南昌大学生命科学与食品工程学院,南昌,330031;2同济大学医学院,上海,200092*通讯作者,siguangli@摘要很多microRNA(miRNA)基因在基因组上聚集排列形成miRNA基因簇。
miRNA基因簇在进化上较为保守,有其特殊的生物学意义。
miR-302基因簇在胚胎干细胞中特异表达,对胚胎干细胞的自我更新和多潜能维持有重要的作用。
本文采用miRBase数据库查询和BLAST同源搜索方法共搜寻并分析了12个物种的miR-302基因簇。
生物信息学分析表明,这些物种miR-302基因簇均位于LARP7蛋白基因的内含子区,但转录方向与LARP7基因转录方向相反。
序列相似性分析显示,同一物种miR-302簇成员间以及不同物种相应miR-302簇成员间相似性均较高。
进化分析表明,基因复制可能是miR-302基因簇进化的主要驱动力。
关键词基因簇,miR-302,分子进化Bioinformatics Analysis of miR-302Gene Cluster from12Different SpeciesCui Yaru1Zhang Kunshan2Luo Yuping1Li Siguang1,2*1College of Life Sciences and Food Engineering of Nanchang University,Nanchang,330031;2College of Medicine of Tongji University,Shanghai, 200092*Corresponding author,siguangli@DOI:10.3969/gab.030.000379Abstract There are many miRNA genes clustered in genome.miRNA gene cluster is highly conserved in evolu-tion,with its special biological significance.miR-302gene cluster,an embryonic stem cell-specific miRNA clus-ter,plays an important role in maintenance of stem cells self-renewal and pluripotency.In this paper,we analyzed the molecular evolution of miR-302gene cluster from12different species.Bioinformatics analysis showed all of miR-302gene clusters in these species were located in introns of LARP7genes,but transcripted in opposite direc-tion.Sequence identity analysis suggested the high identity of the different members of the miR-302gene cluster of the same specie and the corresponding members of the miR-302gene clusters among different species.The phylogenetic analysis revealed that the miR-302gene cluster originated from gene duplications.Keywords Gene cluster,miR-302,Molecular evolutionmicroRNA(miRNA)是一类长度为19~25个核苷酸的内源非编码小分子RNA,广泛存在于各种后生生物中(Dennis,2002)。
Nature-2012-隼类基因组
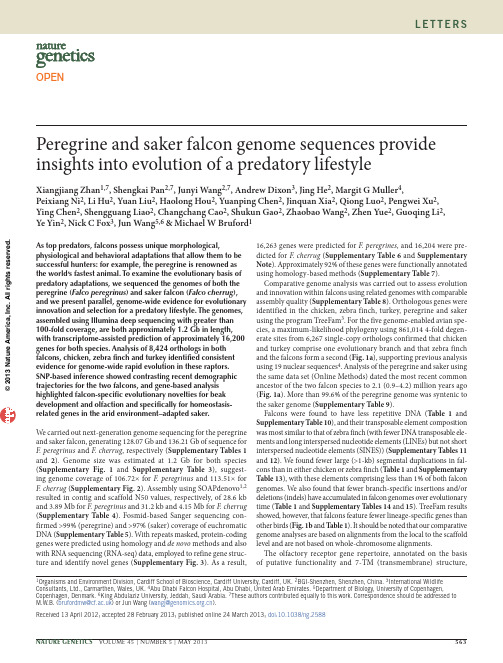
l e t t e r sAs top predators, falcons possess unique morphological, physiological and behavioral adaptations that allow them to be successful hunters: for example, the peregrine is renowned as the world’s fastest animal. To examine the evolutionary basis of predatory adaptations, we sequenced the genomes of both the peregrine (Falco peregrinus ) and saker falcon (Falco cherrug ), and we present parallel, genome-wide evidence for evolutionary innovation and selection for a predatory lifestyle. The genomes, assembled using Illumina deep sequencing with greater than 100-fold coverage, are both approximately 1.2 Gb in length, with transcriptome-assisted prediction of approximately 16,200 genes for both species. Analysis of 8,424 orthologs in both falcons, chicken, zebra finch and turkey identified consistent evidence for genome-wide rapid evolution in these raptors. SNP-based inference showed contrasting recent demographic trajectories for the two falcons, and gene-based analysis highlighted falcon-specific evolutionary novelties for beak development and olfaction and specifically for homeostasis-related genes in the arid environment–adapted saker.We carried out next-generation genome sequencing for the peregrine and saker falcon, generating 128.07 Gb and 136.21 Gb of sequence for F. peregrinus and F. cherrug , respectively (Supplementary Tables 1 and 2). Genome size was estimated at 1.2 Gb for both species (Supplementary Fig. 1 and Supplementary Table 3), suggest-ing genome coverage of 106.72× for F. peregrinus and 113.51× for F. cherrug (Supplementary Fig. 2). Assembly using SOAPdenovo 1,2 resulted in contig and scaffold N50 values, respectively, of 28.6 kb and 3.89 Mb for F. peregrinus and 31.2 kb and 4.15 Mb for F. cherrug(Supplementary Table 4). Fosmid-based Sanger sequencing con-firmed >99% (peregrine) and >97% (saker) coverage of euchromatic DNA (Supplementary Table 5). With repeats masked, protein-coding genes were predicted using homology and de novo methods and also with RNA sequencing (RNA-seq) data, employed to refine gene struc-ture and identify novel genes (Supplementary Fig. 3). As a result, 16,263 genes were predicted for F. peregrines , and 16,204 were pre-dicted for F. cherrug (Supplementary Table 6 and Supplementary Note ). Approximately 92% of these genes were functionally annotated using homology-based methods (Supplementary Table 7).Comparative genome analysis was carried out to assess evolution and innovation within falcons using related genomes with comparable assembly quality (Supplementary Table 8). Orthologous genes were identified in the chicken, zebra finch, turkey, peregrine and saker using the program TreeFam 3. For the five genome-enabled avian spe-cies, a maximum-likelihood phylogeny using 861,014 4-fold degen-erate sites from 6,267 single-copy orthologs confirmed that chicken and turkey comprise one evolutionary branch and that zebra finch and the falcons form a second (Fig. 1a ), supporting previous analysis using 19 nuclear sequences 4. Analysis of the peregrine and saker using the same data set (Online Methods) dated the most recent common ancestor of the two falcon species to 2.1 (0.9–4.2) million years ago (Fig. 1a ). More than 99.6% of the peregrine genome was syntenic to the saker genome (Supplementary Table 9).Falcons were found to have less repetitive DNA (Table 1 and Supplementary Table 10), and their transposable element compositionwas most similar to that of zebra finch (with fewer DNA transposable ele-ments and long interspersed nucleotide elements (LINEs) but not short interspersed nucleotide elements (SINES)) (Supplementary Tables 11 and 12). We found fewer large (>1-kb) segmental duplications in fal-cons than in either chicken or zebra finch (Table 1 and Supplementary Table 13), with these elements comprising less than 1% of both falcongenomes. We also found that fewer branch-specific insertions and/ordeletions (indels) have accumulated in falcon genomes over evolutionary time (Table 1 and Supplementary Tables 14 and 15). TreeFam results showed, however, that falcons feature fewer lineage-specific genes than other birds (Fig. 1b and Table 1). It should be noted that our comparative genome analyses are based on alignments from the local to the scaffold level and are not based on whole-chromosome alignments.The olfactory receptor gene repertoire, annotated on the basisof putative functionality and 7-TM (transmembrane) structure, Peregrine and saker falcon genome sequences provide insights into evolution of a predatory lifestyleXiangjiang Zhan 1,7, Shengkai Pan 2,7, Junyi Wang 2,7, Andrew Dixon 3, Jing He 2, Margit G Muller 4,Peixiang Ni 2, Li Hu 2, Yuan Liu 2, Haolong Hou 2, Yuanping Chen 2, Jinquan Xia 2, Qiong Luo 2, Pengwei Xu 2, Ying Chen 2, Shengguang Liao 2, Changchang Cao 2, Shukun Gao 2, Zhaobao Wang 2, Zhen Yue 2, Guoqing Li 2, Ye Yin 2, Nick C Fox 3, Jun Wang 5,6 & Michael W Bruford 11Organisms and Environment Division, Cardiff School of Bioscience, Cardiff University, Cardiff, UK. 2BGI-Shenzhen, Shenzhen, China. 3International WildlifeConsultants, Ltd., Carmarthen, Wales, UK. 4Abu Dhabi Falcon Hospital, Abu Dhabi, United Arab Emirates. 5Department of Biology, University of Copenhagen,Copenhagen, Denmark. 6King Abdulaziz University, Jeddah, Saudi Arabia. 7These authors contributed equally to this work. Correspondence should be addressed to M.W.B. (brufordmw@ ) or Jun Wang (wangj@ ).Received 13 April 2012; accepted 28 February 2013; published online 24 March 2013; doi:10.1038/ng.2588OPEN© 2013 N a t u r e A m e r i c a , I n c . A l l r i g h t s r e s e r v e d .l e t t e r s showed the fewest intact olfactory receptor genes in falcons (n = 28; Supplementary Table 16), even though they have a larger olfactory bulb ratio than the zebra finch and a similar ratio to chicken 5. These two traits have previously been thought to be positively correlated 6 and linked to olfactory function 7. Furthermore, a gene expansion in the olfactory receptor γ-c clade 8 in chicken and zebra finch is not present in falcons (Fig. 1c and Supplementary Table 17), possibly reflecting their reliance on vision for locating prey 5.To compare selection at the gene level, two orthologous gene sets were compiled: the single-copy orthologs for the five avian species and a representative gene set from multiple-copy orthologs (n = 2,157). Analysis of branch-specific Ka /Ks (nonsynonymous -synonymous) substitution ratios (ω) showed that both falcons have higher branch ω values than other birds, independent of the gene set used (Fig. 1a and Supplementary Fig. 4), implying accelerated functional evolution in the falcon lineage. Supporting evidence for this comes from a recent work showing rapid phenotypic evolution and speciation in the falcon family 9. We also calculated the ω value for each orthologous gene and found that the ω values in falcons with mean value of 0.39 were considerably larger than for the other five pairwise avian combina-tions (see distribution in Fig. 2a ). However,these results need to be interpreted in the light of the relative paucity of avian genomes currently sequenced. We further examined both rapidly and slowly evolving gene catego-ries by comparing the two falcons against the galliformes, zebra finch–chicken and zebra finch–turkey pairs, respectively. To account for rapid genome evolution in falcons, each ω value within these categories was normalized using the genome median ω of each species pair. Functional GO (Gene Ontology)10 cat-egories involved in circulation (for example, heme synthesis), the nervous system, olfaction and sodium ion trans-port were found to have evolved rapidly in falcons (Supplementary Fig. 5 and Supplementary Table 18). Notable rapid evolution was also observed in the mitochondrial respiration chain when comparing falcons and galliformes birds but not in the comparisons of falcons with other species (Supplementary Table 18).The gene families defined by TreeFam (Supplementary Table 19) were input into CAFE 11 to examine changes in ortholog cluster sizes between putative ancestors and each species across our phylogeny (Fig. 1a ). We found that net gene loss occurred in all avian genomes, but the rate of loss per unit of time was most rapid in falcons (Fig. 1a ). We then used protein clustering 12 to explore gene number variation in the same protein families between each falcon species and the zebra finch. Loss of protein families within falcons (extinction plus contrac-tion) exceeded gain (innovation plus expansion) (Supplementary Tables 20–24), and contraction was greater than expansion for both the number of protein families and gene number (Fig. 2b ).We identified 879,812 and 761,748 heterozygous SNPs in the per-egrine and saker genomes, respectively. Despite its lower number of heterozygous SNPs, the saker had a higher heterozygous SNP rate than the peregrine (Table 1), although rates for both falcons were lower than for either the chicken 13 or zebra finch 14. Lower genetic diversity might originate from recent population contractions (Fig. 3). A narrow distribution in genome-wide SNP density for the peregrine, unlike the saker, suggests a more heterogeneous SNP distribution, indicating that mutations in the peregrine genome are more evenly distributed (Fig. 3a ). On the basis of local SNP densities, we used the pairwise sequentially Markovian coalescent (PSMC)15 to model the demographic history of both species (Fig. 3b ). For the peregrine,we inferred demographic history from 2 million years ago to 10,000 years ago, whereas, for the saker, the analysis included both the saker and its ancestral hierofalcon 16 because the fossil record indicates that the saker originated less than 34,000 years ago 16. PSMC showed that both falcon species have experienced at least one bottleneck; however,Green anole Chicken TurkeySaker0.63Peregrine Zebra finch0.590.150.150.170.230.1391+129.5+128.1+ 6.1–410.5+13.3+12.7+ 20.8+ 0.8+2.1–391.4– 28.2– 51.4–44.7–49.1–44.8– 57.21009968100M i l l i o n y e a r s a g oac120117558346442461,19043434324465326171381302911837513530303868757588323821701158,944bFigure 1 Comparative genomics in five avian species. (a ) Phylogenetic tree constructed using fourfold degenerate sites from single-copyorthologs, with the branch lengths scaled to estimated divergence time. Branch-specific ω values calculated from concatenated and SATé-aligned single-copy orthologs are shown on the left of each branch, and gene gain (+) and loss (−) per million years are shown on the right. (b ) Venn diagram showing shared and unique gene families in five avian species: red, peregrine; pink, saker; light blue, chicken; orange, turkey; green, zebra finch. (c ) Neighbor-joining tree based on the amino-acid sequences encoded by olfactory receptor genes in the peregrine, saker, chicken and zebra finch. Bootstrap values are shown (clockwise) for the major olfactory receptor clades, namely γ-c, other γ, α, θ and TAAR. Note that both chicken and zebra finch show expansions in the olfactory receptor γ-c clade. Birds are represented by the same colors as in b .table 1 Comparative genome structure summary for the five avian species Species Repetitive DNA (%)Segmental duplications (%)Specific indels per million years Specific gene families (genes)Heterozygous SNP rate per kb Peregrine 6.790.7141.0120 (137)0.7Saker 6.800.6109.0117 (139)0.8Zebra finch 12.83 1.0322.8382 (531) 1.4Turkey 9.62–a –a 170 (182)~1.7Chicken 13.28 5.5278.8115 (174) 4.5Detailed statistics for repetitive DNA are given in supplementary table 10, segmental duplications are listed in supplementary table 13, specific indels are listed in supplementary tables 14 and 15, and gene families identifiedfrom TreeFam analysis are shown in supplementary table 19. Heterozygous SNP rates for non-falcon species havebeen published 12–14.a Excluded from the analysis because of a higher proportion of ambiguous bases in the turkey genome (supplementary Note ).© 2013 N a t u r e A m e r i c a , I n c . A l l r i g h t s r e s e r v e d .l e t t e r swhile this lasted until 100,000 years ago for the peregrine, hierofalcon populations expanded around 300,000 years ago and started to expand again from 60,000 years ago, eventually giving rise to the four spe-cies in the hierofalcon group 16. The peregrine, however, underwent a second bottleneck approximately 20,000 years ago, possibly owing to climate-driven habitat diminution (Supplementary Fig. 6).The word falcon comes from the Latin falco , meaning hook shaped, referring to its beak. The falcon beak is more robust, being longer, wider and deeper, than those of the chicken and zebra finch. We exam-ined the evolution of the genes in two KEGG (Kyoto Encyclopedia of Genes and Genomes) pathways (TGF-β and WNT)17, those in FGF signaling pathways (see URLs) and 98 other genes involved in the development of avian beaks (Online Methods). Bmp4 is a well-studied major-effect gene in beak development 18, and exonization provides a major source of accelerated, lineage-specific evolution 19.We found that falcons have gained two novel exons owing to splice-site mutations in Bmp4 (Supplementary Fig. 7) and have also gained a second copy of TGFB2 (a gene upregulated in curved beaks) and Dkk 2 (a gene related to longer and wider beaks in ducks)20. The two copies originated in different parts of a single ancestral gene (Supplementary Figs. 8 and 9). These changes can both influence gene expression 21,22 and contribute to the regulation of development in falcon beaks (Table 2). Relative to chicken and zebra finch, eight genes in these pathways show evidence of positive selection in falcons (Supplementary Fig. 10), among which TGF βIIr has been shown to be functional in shaping avian beak morphology (Table 2). Although it has been shown that possible errors in multiple-sequence alignment have only a limited impact on estimates of Ka /Ks ratios at the genome level (Supplementary Fig. 11), we caution that the analysis of positive selection remains sensitive to the quality of the multiple-sequence alignments of separate orthologous genes and can be further com-plicated by variance in sequence divergence among them. Analysis of microRNA target sites provided further support for the presence of novel regulatory mechanisms in falcons (Table 2, Supplementary Fig. 10 and Supplementary Table 25).Peregrines and sakers are parapatric breeding species, with the latter confined to the Palearctic and primarily inhabiting arid environments (Supplementary Fig. 6)16,23. Consequently, it is probable that sakers require greater maintenance of osmotic equilibrium and suffer heat stress more than peregrines. We compared the genes from two kidney-expressed KEGG pathways and other related genes involved in home-ostasis in the two species. Rab11a and GNAS have major contributions to the V2R water conservation pathway 17,24, and both have two more copies in saker than in peregrine (Supplementary Table 26).The aldosterone-regulated sodium reabsorption pathway has a major role in determining sodium levels, and the activation of pro-tein kinase C (PKC) inhibits sodium uptake 25. We found that the saker has three more functional copies of PKC β than peregrine. In saker, we also found the exonization of trpv1, a gene involved in pro-moting thermoregulatory cooling by stimulating sweat productiona bN u m b e rlog 2 (Ka/Ks )2004006008001,0001,200log 2 (gene number differences)P r o t e i n f a m i l y n u m b e rFigure 2 Distribution of ω values for each pair of orthologous genes among the five avianspecies and gene gain and loss in falcons.(a ) Distribution of ω values among avian species.The estimates of ω for 8,424 orthologs show a highly significant shift toward larger values in falcons compared with other pairs (P = 1.354 × 10−189, 2.837 × 10−297, 1.621 × 10−284, 7.264 × 10−233 and 4.617 × 10−215 relativeto the other indicated pairs, Mann Whitney test). Genes with Ka = 0 are included in relative frequencies but are not shown. The x axis shows log 2 Ka /Ks , using 0.01 as the unit interval, and the y axis shows the number of orthologs in each interval. (b ) Gene number differencesin contracted and expanded protein families in the falcons compared with zebra finch. Zebra finch genes of unplaced sequence that had more than 97% sequence identity with their closest paralog were excluded to correct for the possible overestimation of zebra finch gene expansion 14.ab3.53.0Peregrine SakerPeregrine Saker2.5E f f e c t i v e p o p u l a t i o n s i z e (×104)P e r c e n t a g e o f w i n d o w s2.01.51.00.50140.0010.0100.100SNP density (%)1.000121086420105Years before the present106104Figure 3 SNP density distribution and demography reconstruction of falcons. (a ) Distribution of SNP density across each falcon genome. Heterozygous SNPs between the two sets of falcon chromosomes were annotated, and heterozygosity density was observed in non-overlapping 50-kb windows. (b ) PSMC inference of falcon population history based on autosomal data. The central bold lines represent inferred population sizes, and the 100 thin curves surrounding each line are the PSMC estimates generated using 100 sequences randomly resampled from the original sequence. The mutation rate on autosomes, which is used in time scaling, was estimated using zebra finch autosome data.© 2013 N a t u r e A m e r i c a , I n c . A l l r i g h t s r e s e r v e d .and preemptive renal water reabsorption through the release of vasopressin (antidiuretic hormone)26 (Supplementary Fig. 12). Supporting evidence for water conservation in sakers comes from the observation that sakers secrete more sodium and chloride in their urine than do peregrines 27. These results, when taken together, suggest a genetic basis by which sakers cope with desert and steppe habitats and heat stress. The functional expression of these genes related to water conservation and sodium secretion warrants future research.The genome sequencing data presented here provide a resource for the future examination of evolution and adaptation in birds and in raptors in particular. Both falcon species are widely distributed across the globe and show a wide variety of local phenotypes and behaviors, and their conservation status varies substantially across their habitat ranges, with the saker falcon being globally classified as vulnerable. Both species have migratory as well as sedentary populations, and understanding the genetic basis of this wide diversity could provide a valuable tool to aid their long-term conservation.URLs. LASTZ and MULTIZ, /miller_lab/; MUSCLE, /muscle ; FGF signaling pathways, /pathway.php?sn=FGF_Signaling .MeThodSMethods and any associated references are available in the online version of the paper .Accession codes. Whole-genome shotgun sequences have been depos-ited at the DNA Data Bank of Japan (DDBJ), the European Molecular Biology Laboratory (EMBL) and GenBank (AKMT00000000 for F. peregrinus and AKMU00000000 for F. cherrug ). The version described in this paper is the first version. Raw DNA, RNA and micro-RNA sequencing reads have been submitted to the NCBI Sequence Read Archive database (SRA054256, SRX225198, SRX225199).Note: Supplementary information is available in the online version of the paper .ACkNoWLeDGMeNtSThis work was supported by the EAAD (Environment Agency of Abu Dhabi). We thank H.E. Mohammed Al Bowardi for his support. We also thankP . Orozco-terWengel and X. Fang for their critical comments on the manuscript, A. Subramanian for suggestions on analysis with DIALIGN-TX, S. Mirarab for suggestions on SATé-II alignment and E. Alm and B.J. Shapiro for advice onKa /Ks normalization. We acknowledge staff at International Wildlife Consultants, EAAD and BGI-Shenzhen who helped conduct this study.AUtHoR CoNtRIBUtIoNSM.W .B. led the UK team. Jun Wang and Junyi Wang led the BGI team. M.W .B., X.Z., A.D. and N.C.F. designed the study. M.G.M., A.D. and X.Z. sampled thefalcons. Q.L., S.G., C.C., P .N., Y.L., S.L., Z.Y., G.L., Z.W . and Y.Y. performed genome sequencing and assembly. X.Z. and Yuanping Chen extracted the DNAand RNA. X.Z., S.P ., J.H., L.H., H.H., J.X., P .X. and Ying Chen analyzed the data. X.Z. and M.W .B. interpreted the results and wrote the manuscript. All authors read and provided input for the manuscript and approved the final version. COMPETING FINANCIAL INTERESTSThe authors declare no competing financial interests.Reprints and permissions information is available online at /reprints/index.html.This work is licensed under a Creative Commons Attribution- NonCommercial-Share Alike 3.0 Unported License. To view a copy of this license, visit /licenses/by-nc-sa/3.0/.1. Kim, E.B. et al. Genome sequencing reveals insights into physiology and longevityof the naked mole rat. Nature 479, 223–227 (2011).2. Li, R. et al. De novo assembly of human genomes with massively parallel shortread sequencing. Genome Res. 20, 265–272 (2010).3. Li, H. et al. TreeFam: a curated database of phylogenetic trees of animal genefamilies. Nucleic Acids Res. 34, D572–D580 (2006).4. Hackett, S.J. et al. A phylogenomic study of birds reveals their evolutionary history.Science 320, 1763–1768 (2008).5. Roper, T.J. Olfaction in birds. Adv. Stud. Behav. 28, 247–332 (1999).6. Steiger, S.S., Fidler, A.E., Valcu, M. & Kempenaers, B. Avian olfactory receptorgene repertoires: evidence for a well-developed sense of smell in birds? Proc. R. Soc. Lond. B 275, 2309–2317 (2008).7. Bang, B.G. Anatomical evidence for olfactory function in some species of birds.Nature 188, 547–549 (1960).8. Steiger, S.S., Kuryshev, V.Y., Stensmyr, M.C., Kempenaers, B. & Mueller, J.C.A comparison of reptilian and avian olfactory receptor gene repertoires: species-specific expansion of group γ genes in birds. BMC Genomics 10, 446 (2009).9. Hugall, A.F . & Stuart-Fox, D. Accelerated speciation in colour-polymorphic birds.Nature 485, 631–634 (2012).10. Ashburner, M. et al. Gene ontology: tool for the unification of biology. The GeneOntology Consortium. Nat. Genet. 25, 25–29 (2000).11. Hahn, M.W., Demuth, J.P . & Han, S.G. Accelerated rate of gene gain and loss inprimates. Genetics 177, 1941–1949 (2007).12. Dalloul, R.A. et al. Multi-platform next-generation sequencing of the domestic turkey(Meleagris gallopavo ): genome assembly and analysis. PLoS Biol. 8, e1000475 (2010).13. Wong, G.K. et al. A genetic variation map for chicken with 2.8 million single-nucleotide polymorphisms. Nature 432, 717–722 (2004).14. Warren, W.C. et al. The genome of a songbird. Nature 464, 757–762 (2010).15. Li, H. & Durbin, R. Inference of human population history from individual whole-genome sequences. Nature 475, 493–496 (2011).16. Nittinger, F ., Haring, E., Pinsker, W., Wink, M. & Gamauf, A. Out of Africa?Phylogenetic relationships between Falco biarmicus and the other hierofalcons (Aves: Falconidae). J. Zoological Syst. Evol. Res. 43, 321–331 (2005).17. Kanehisa, M., Goto, S., Furumichi, M., Tanabe, M. & Hirakawa, M. KEGG forrepresentation and analysis of molecular networks involving diseases and drugs. Nucleic Acids Res. 38, D355–D360 (2010).18. Abzhanov, A., Protas, M., Grant, B.R., Grant, P .R. & Tabin, C.J. Bmp4 andmorphological variation of beaks in Darwin’s finches. Science 305, 1462–1465 (2004).19. Sorek, R. The birth of new exons: mechanisms and evolutionary consequences.RNA 13, 1603–1608 (2007).20. Brugmann, S.A. et al. Comparative gene expression analysis of avian embryonicfacial structures reveals new candidates for human craniofacial disorders. Hum. Mol. Genet. 19, 920–930 (2010).21. Menezes, R.X., Boetzer, M., Sieswerda, M., van Ommen, G.B. & Boer, J.M.Integrated analysis of DNA copy number and gene expression microarray data using gene sets. BMC Bioinformatics 10, 203 (2009).22. Perry, G.H. et al. Diet and evolution of human amylase gene copy number variation.Nat. Genet. 39, 1256–1260 (2007).23. del Hoyo, J., Elliot, A. & Sargatal, J. Handbook of the Birds of the World, Vol. 2(Lynx Edicions, Barcelona, Spain, 1994).24. Tajika, Y. et al. Differential regulation of AQP2 trafficking in endosomes bymicrotubules and actin filaments. Histochem. Cell Biol. 124, 1–12 (2005).25. Hays, S.R., Baum, M. & Kokko, J.P . Effects of protein kinase C activation onsodium, potassium, chloride, and total CO 2 transport in the rabbit cortical collecting tubule. J. Clin. Invest. 80, 1561–1570 (1987).26. Sharif -Naeini, R., Ciura, S. & Bourque, C.W. TRPV1 gene required for thermosensorytransduction and anticipatory secretion from vasopressin neurons during hyperthermia. Neuron 58, 179–185 (2008).27. Cade, T.J. & Greenwald, L. Nasal salt secretion in falconiform birds. Condor 68,338–350 (1966).28. Abzhanov, A. et al. The calmodulin pathway and evolution of elongated beakmorphology in Darwin’s finches. Nature 442, 563–567 (2006).29. Mallarino, R. et al. Two developmental modules establish 3D beak-shape variationin Darwin’s finches. Proc. Natl. Acad. Sci. USA 108, 4057–4062 (2011).table 2 Known functional genes for beak development (length, width and depth) and their innovations in falconsGene LengthWidth Depth Genetic innovation Bmp 4++More exons SCML4+More exons TGFB2+Duplication Dkk 2++DuplicationTGF βIIr ++Positive selection CamKII +Lower copy numberFZD1++Fewer microRNA target sites TGFB3+Fewer microRNA target sites Fgf10−−More microRNA target sites+, upregulation; −, downregulation. The included genes have been shown to be functional in beak development 18,20,28,29.l e t t e r s© 2013 N a t u r e A m e r i c a , I n c . A l l r i g h t s r e s e r v e d .oNLINe MeThodSSampling and DNA extraction. Approximately 2 ml of blood each was taken from one male saker and one male peregrine that were caught in the wild at the Abu Dhabi Falcon Hospital. Genomic DNA was extracted using gravity-flow, anion-exchange tips and buffers (Qiagen Blood & Cell Culture DNA Maxi Kit). Sex was determined using morphology and molecular assays (Supplementary Note ).Genome sequencing and assembly. Sequencing was carried out using an Illumina HiSeq 2000. Paired-end libraries with insert sizes of 170, 500 and 800 bp (short inserts) and 5, 10 and 20 kb (long inserts) were constructed. A detailed description of library construction, sequencing and assembly, genome size estimation, annotation, gene prediction (homology, de novo and RNA-seq) and functional annotation, and RNA (mRNA and microRNA) sequencing is included in the Supplementary Note . Genome assembly quality was assessed using GC content (Supplementary Figs. 13 and 14) and Sanger sequencing of fosmid libraries (Supplementary Note ). The lengths of the repetitive DNA sequences identified are listed in Supplementary Table parative genome analysis. We employed the widely used program TreeFam 3 to define orthologous genes (Supplementary Note ) because it has been inferred that phylogeny-based software is more robust in inferring orthologs 3. The analysis using LASTZ (see URLs) and MCscan 30 in chicken, peregrine and saker showed that approximately 88.9% of TreeFam orthologs were supported by at least one synteny analysis, implying high quality for the orthologs defined (Supplementary Table 28 and Supplementary Note ). On the basis of concatenated 4-fold degenerate sites from 6,267 single-copy orthologs, a maximum-likelihood phylogeny for the falcons, zebra finch, chicken and turkey genomes was constructed using PhyML 31. Ortholog sequences were aligned using MUSCLE (see URLs) with the protein alignment as a guide. The optimal evolutionary model was GTR + I + G, selected using MODELTEST3.7 (ref. 32). The Bayesian relaxed molecular clock approach was used to estimate species divergence time using MCMCTREE in PAML 33, based on the degenerate sites data set used above.Whole-genome synteny analysis was performed for the five bird species. Pairwise alignments were first produced using LASTZ. ChainNet was then applied to merge traditional alignments into larger structures. Scaffolds of <5 kb in size were filtered out to avoid multiple hits for small scaffolds.To detect segmental duplications, an alignment was generated using LASTZ with the parameters T = 2 (no transition), C (chain) = 2, H (inner) = 2,000, Y (ydrop) = 3,400, L (gappedthresh) = 6,000 and K (hspthresh) = 2,200. Before aligning, with repeat sequences masked, the genome assembly was split into 100 subfiles. The maximum simultaneous gap allowed was 100 bp. After align-ing, the blocks obtained were conjoined to obtain larger blocks (chains). We unmasked the repeat sequences in the chains and then selected those with length of >500 bp and identity of >85% and aligned the chains using LASTZ again. Finally, we extracted the aligned chains with length of >1 kb and identity of >90%, considering these predictions to be segmental duplications. After removing the overlapping fragments, we obtained a nonredundant set. Because previous research 34 has shown that highly similar alignments may represent allelic overlaps missed during the assembly process, we removed segmental duplications that were ≥98% identical. Furthermore, to examine the quality of the detected segmental duplications, the sequencing depth distributions of segmental duplications and regions without segmental duplications were compared for peregrine and saker, respectively (Supplementary Fig. 15).For the assessment of lineage-specific indels, MULTIZ (see URLs) was used to integrate all the LASTZ alignments from the synteny analysis to obtain conserved elements among the genomes from the two falcons, zebra finch and chicken. For blocks longer than 1 kb, we identified species-specific short indels using the aligned data. Indels located within 50 bp of the end of the block and pairs of indels with a distance less than 50 bp were filtered out.Avian olfactory receptor genes. The olfactory receptor genes of the five avian species and of green anole, human, cow and dog were annotated using GenBank, Ensembl and published data 8 (Supplementary Note ). Intact avian olfactory receptor genes were aligned using SATé-II (ref. 35), from which a neighbor-joining tree was constructed using MEGA5.03 (ref. 36), with the Poisson modelchosen as the substitution model as previously analyzed 8. The reliability of the phylogenetic tree was evaluated with 1,000 bootstrap replicates.Genome evolution analysis. TreeFam was used to help define both single-copy and multiple-copy orthologs for the five avian species (Supplementary Fig. 16). For multiple-copy orthologs, we used single-copy genes in our out-group (green anole) as a query and selected the best hits in the five birds as the representatives of the ortholog. Similar sequence depth was found for multiple-copy and single-copy genes (Supplementary Fig. 17), suggesting that gene duplications are unlikely to have been misidentified as alleles of the same locus. The two orthologous gene sets were then used for ω ratio calculations as follows.First, on the basis of the concatenated ortholgs, branch-specific ω values for each avian species were calculated using codeml in PAML (Supplementary Note ). Alignment quality is of major importance for ω estimation because errors can lead to the misidentification of synonymous sites as nonsynon-ymous sites 37. To minimize the effect of alignment errors, two algorithms,SATé-II and DIALIGN-TX 38, were chosen to align each ortholog, as they havebeen reported to be robust in dealing with global and local alignments, respec-tively (Supplementary Note ). To further examine the influence of alignment quality on the ω analysis, we randomly selected 421 SATé-aligned orthologs and manually corrected them. All automatic alignment methods and manual corrections produced similar results (Supplementary Fig. 4). Therefore, for the following analysis, we used SATé, except for alignments involving too few taxa (≤3), where we used DIALIGN instead.Second, PAML was used to calculate ω values for each ortholog, and com-parisons were made of the ω distributions of all orthologs between the falcons and other species pairs (chicken and turkey, zebra finch and chicken, zebra finch and turkey, peregrine and zebra finch, and saker and zebra finch).Third, we examined both rapidly and slowly evolving gene categories by comparing the two falcon genomes with the two galliformes genomes, zebra finch and chicken, and zebra finch and turkey. We calculated the median ω values for each gene ontology 10 functional category containing at least ten genes found in the saker-peregrine lineage.Assessment of the possible influence of sequencing errors indicated that they can have little influence on our ω calculations (Supplementary Fig. 11). Detailed information for the above analyses is provided in the Supplementary Note .Gene gain and loss. CAFE based on a random gene birth and death model 11 was used to study gene gain and loss in gene families across our reconstructed phylogenetic tree with six species (Supplementary Fig. 18). The robustness of CAFE was tested by removing one species each time. The results showed that, independent of the species removed, falcons always featured the most rapid gene loss of the studied avian species (Supplementary Fig. 19), although we note that the avian species studied here are more divergent than mammals 11. To further explore gain and loss between each falcon and its closest genome-enabled rela-tive, zebra finch, we used protein clustering 12 to explore gene number variation for the same protein families (Supplementary Note ). Filtering was applied to clean up possible overestimated gene expansion in the zebra finch gene set. However, the patterns of gene turnover in the falcon species were similar with (Fig. 2b ) and without (Supplementary Fig. 20) this filtering.SNP calling and demographic history reconstruction. We use SOAPsnp 39 to detect SNPs between diploid chromosomes of both falcons (Supplementary Note ). The SNP distribution was observed across each genome. To assess whether SNP quality scores or sequencing depth influenced SNP distribution, we compared the results achieved with varied quality scores (20 or 40) and different depth ranges (Supplementary Fig. 21). By comparison with the zebra finch genome, the autosomal mutation rate was estimated to be 1.65 × 10⁻⁹ mutations per year for both falcons. Generation time was inferred to be 6.0 and 6.6 years for peregrine and saker, respectively (Supplementary Note ). The demographic history of each falcon was reconstructed using the PSMC model 15 (Supplementary Note ).Beak development. Genes in three signaling pathways (TGF-β, WNT and FGF) and 98 others (Supplementary Table 29) were analyzed in chicken,© 2013 N a t u r e A m e r i c a , I n c . A l l r i g h t s r e s e r v e d .。
已基因组测序物种
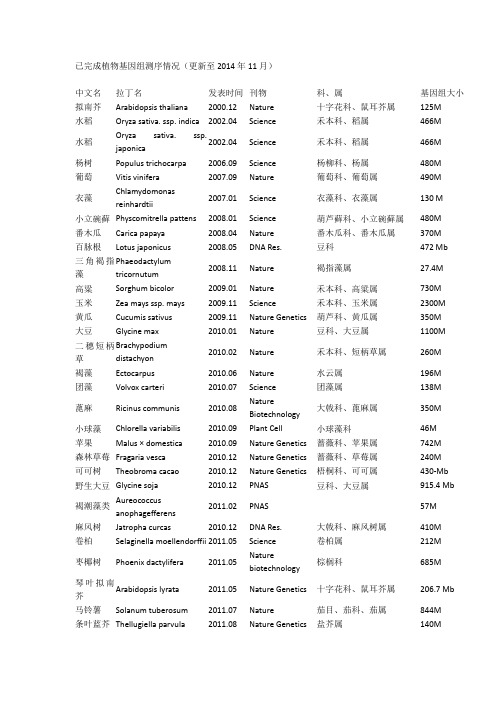
已完成植物基因组测序情况(更新至2014年11月)中文名拉丁名发表时间刊物科、属基因组大小拟南芥Arabidopsis thaliana 2000.12 Nature 十字花科、鼠耳芥属125M水稻Oryza sativa. ssp. indica 2002.04 Science 禾本科、稻属466M水稻Oryza sativa. ssp.japonica2002.04 Science 禾本科、稻属466M杨树Populus trichocarpa 2006.09 Science 杨柳科、杨属480M 葡萄Vitis vinifera 2007.09 Nature 葡萄科、葡萄属490M衣藻Chlamydomonasreinhardtii2007.01 Science 衣藻科、衣藻属130 M小立碗藓Physcomitrella pattens 2008.01 Science 葫芦藓科、小立碗藓属480M 番木瓜Carica papaya 2008.04 Nature 番木瓜科、番木瓜属370M 百脉根Lotus japonicus 2008.05 DNA Res. 豆科472 Mb三角褐指藻Phaeodactylumtricornutum2008.11 Nature 褐指藻属27.4M高粱Sorghum bicolor 2009.01 Nature 禾本科、高粱属730M 玉米Zea mays ssp. mays 2009.11 Science 禾本科、玉米属2300M 黄瓜Cucumis sativus 2009.11 Nature Genetics 葫芦科、黄瓜属350M 大豆Glycine max 2010.01 Nature 豆科、大豆属1100M二穗短柄草Brachypodiumdistachyon2010.02 Nature 禾本科、短柄草属260M褐藻Ectocarpus 2010.06 Nature 水云属196M 团藻Volvox carteri 2010.07 Science 团藻属138M蓖麻Ricinus communis 2010.08 NatureBiotechnology大戟科、蓖麻属350M小球藻Chlorella variabilis 2010.09 Plant Cell 小球藻科46M苹果Malus × domestica 2010.09 Nature Genetics 蔷薇科、苹果属742M森林草莓Fragaria vesca 2010.12 Nature Genetics 蔷薇科、草莓属240M可可树Theobroma cacao 2010.12 Nature Genetics 梧桐科、可可属430-Mb 野生大豆Glycine soja 2010.12 PNAS 豆科、大豆属915.4 Mb褐潮藻类Aureococcusanophagefferens2011.02 PNAS 57M麻风树Jatropha curcas 2010.12 DNA Res. 大戟科、麻风树属410M 卷柏Selaginella moellendorffii 2011.05 Science 卷柏属212M枣椰树Phoenix dactylifera 2011.05 Naturebiotechnology棕榈科685M琴叶拟南芥Arabidopsis lyrata 2011.05 Nature Genetics 十字花科、鼠耳芥属206.7 Mb 马铃薯Solanum tuberosum 2011.07 Nature 茄目、茄科、茄属844M条叶蓝芥Thellugiella parvula 2011.08 Nature Genetics 盐芥属140M白菜Brassica rapa 2011.08 Nature Genetics 十字花科、芸薹属485M 印度大麻Cannabis sativa 2011.1 Genome biology 大麻属534M木豆Cajanus cajan 2011.11 Naturebiotechnology豆科、木豆属833M蒺藜苜蓿Medicago truncatula 2011.11 Nature 豆科苜蓿属500M 蓝载藻Cyanophora paradoxa 2012.02 Science 灰胞藻门70M谷子Setaria italica 2012.05 Naturebiotechnology禾本科、狗尾草属490M谷子Setaria italica 2012.05 Naturebiotechnology禾本科、狗尾草属预估510M,组装出400M番茄Solanum lycopersicum 2012.05 Nature 茄科、茄属900Mb 甜瓜Cucumis melo 2012.07 PNAS 葫芦科、甜瓜属450Mb 亚麻Linum usitatissimum 2012.07 Plant Journal 亚麻科、亚麻属373Mb 盐芥Thellungiella salsuginea 2012.07 PNAS 十字花科、盐芥属260Mb 香蕉Musa acuminata 2012.07 Nature 芭蕉科、芭蕉属523Mb 雷蒙德氏棉Gossypium raimondii 2012.08 Nature Genetics 锦葵科、棉属775.2Mb 大麦Hordeum vulgare 2012.1 Nature 禾本科、大麦属 5.1Gb梨Pyrus bretschneideri 2012.11 Genome Research 蔷薇科、梨属527Mb 西瓜Citrullus lanatus 2012.11 Nature Genetics 葫芦科、西瓜属425 Mb 甜橙Citrus sinensis 2012.11 Nature Genetics 芸香科、柑橘属367 Mb 小麦Triticum aestivum 2012.11 Nature 禾本科、小麦属17Gb两种小型藻Bigelowiella natans,Guillardia theta2012.11 Nature 95Mb 87Mb棉花(雷蒙德氏棉)Gossypium raimondii 2012.12 Nature 锦葵科、棉属761.4Mb梅花Prunus mume 2012.12 NatureCommunications蔷薇科、梨属280M鹰嘴豆Cicer arietinum 2013.01 Naturebiotechnology豆科、鹰嘴豆属738Mb橡胶树Hevea brasiliensis 2013.02 BMC Genomics 大戟科、橡胶树属 2.15Gb 毛竹Phyllostachys heterocycla 2013.02 Nature Genetics 竹科、钢竹属 2.075 Gb短花药野生稻Oryza brachyantha 2013.03NatureCommunications禾本科稻属342Mb-362Mb小麦A Triticum urartu 2013.03 Nature 禾本科、小麦属 4.94 Gb 小麦D grassAegilops tauschii 2013.03 Nature 禾本科、小麦属 4.36Gb 桃树Prunus persica 2013.03 Nature Genetics 蔷薇科、梨属265 Mb 丝叶狸藻Utricularia gibba 2013.05 Nature 狸藻科、狸藻属82Mb中国莲Nelumbo nucifera Gaertn 2013.05 Genome biology 睡莲科、莲属929 Mb 挪威云杉Picea abies 2013.05 Nature 松科、云杉属19.6G海洋球石Emiliania huxleyi 2013.06 Nature 定鞭藻纲141.7Mb藻虫黄藻Symbiodinium minutum 2013.07 Current Biology 甲藻门 1.5G 油棕榈Elaeis guineensis 2013.07 Nature 棕榈科、油棕榈属 1.8G枣椰树Phoenix dactylifera 2013.08 NatureCommunications棕榈科、刺葵属671 Mb醉蝶花Tarenaya hassleriana 2013.08 Plant Cell 醉蝶花科、醉蝶花属290 Mb 莲Nelumbo nucifera 2013.08 Plant Journal 睡莲科、莲属879 Mb桑树Morus notabilis 2013.09 NatureCommunications桑科、桑属357 Mb猕猴桃Actinidia chinensis 2013.10 NatureCommunications猕猴桃属616.1 Mb胡杨Populus euphratica 2013.11 NatureCommunications杨属496.5 Mb八倍体草莓F. x ananassa 2013.12 DNA Research 草莓属698 Mb 康乃馨Dianthus caryophyllus L. 2013.12 DNA Research 石竹属622 Mb 甜菜Beta vulgaris ssp. vulgaris 2013.12 Nature 藜科甜菜属566.6 Mb 无油樟(互叶梅)Amborella trichopoda 2013.12 Science 无油樟属748 Mb辣椒Capsicum annuum(Criolo de Morelos334)2014.1 Nature Genetics 辣椒属 3.48G芝麻Sesamum indicum 2014.2 Genome Biology 胡麻科胡麻属274 Mb辣椒Capsicum annuum(Zunla-1)2014.3 PNAS 辣椒属 3.48G火炬松Pinus taeda(Loblollypine)2014.3 Genome Biology 松属23.2G棉花(亚洲棉)Gossypium arboreum 2014.5 Nature Genetics 锦葵科、棉属1694Mb 萝卜Raphanus sativus L. 2014.5 DNA Research 十字花科、萝卜属402Mb甘蓝Brassica oleracea 2014.5 Naturecommunications十字花科、芸薹属630Mb菜豆Phaseolus vulgaris L.2014.6 Nature Genetics 豆科,菜豆属587Mb野生大豆Glycine soja2014.7Naturecommunications豆科、大豆属868 Mb普通小麦Triticum aestivum 2014.7 Science 禾本科17Gb野生西红柿Solanum pennellii 2014.7 Nature Genetics茄科942 Mb非洲野生稻Oryza glaberrima2014.8 Nature Genetics禾本科316 Mb油菜Brassica napus2014.8 Science十字花科630 Mb中果咖啡Coffea canephora 2014.9 Science 茜草科,咖啡属710 Mb茄子Solanum melongena 2014.9 DNA Research 茄科、茄属1093 Mb多个野生大豆Glycine soja 2014.9Naturebiotechnology豆科、大豆属889.33~1,118.34Mb绿豆Vigna radiata 2014.10 Naturecommunications豆科、豇豆属543 Mb啤酒花Humulus lupulus 2014.11 Plant and CellPhysiology大麻科、葎草属 2.57 Gb蝴蝶兰Phalaenopsis equestris2014.11 Nature Genetics 兰科、蝴蝶兰属 1.16 Gb。
这可能是最全面的已发表基因组物种列表!

这可能是最全面的已发表基因组物种列表!
少罗嗦,直接给网址:
/wiki/Lists_of_sequenced_genomes
点击文末评论区的“阅读原文”可直接在手机上查看,这里建议将链接复制到电脑端的浏览器查看。
打开后的页面是这样的,see,包括了8个列表:分别是动物(animal),古菌(archaea),细菌(bacteria),真菌(fungi),植物(plant),质体(plastid),原生生物(protist)以及真核生物(eukaryote)的总列表。
比如点击植物对应的List,直接进入相应的页面,如下图。
页面包含一个分级目录,类似word的导航窗格,点击对应的分类,比如说点单子叶植物,可快速定位到当前页面相应的位置。
然后可单击列表变量名或者旁边的小三角会进行排序,如下图,比如可按物种名称排序,然后可快速定位到关注的一些物种(真菌和动物的展示方式比较简单)。
将鼠标光标移到物种的拉丁文学名上,会显示该物种相关的简介。
单击物种名称,会跳转到相应的百科词条,如下图。
点击年份的上标,会迅速定位到相应的文献,如下图。
点击引用文献的的doi或PMID号可直接跳转到当前文献的下载页面,如下图。
接着我们就可以下载该文献,进而追踪到基因组数据的下载链接。
当然,你也可以用拉丁名直接到Ensembl,NCBI,UCSC等数据库查找和下载相应物种的基因组数据。
今天的内容就到这里啦~。
已基因组测序植物列表

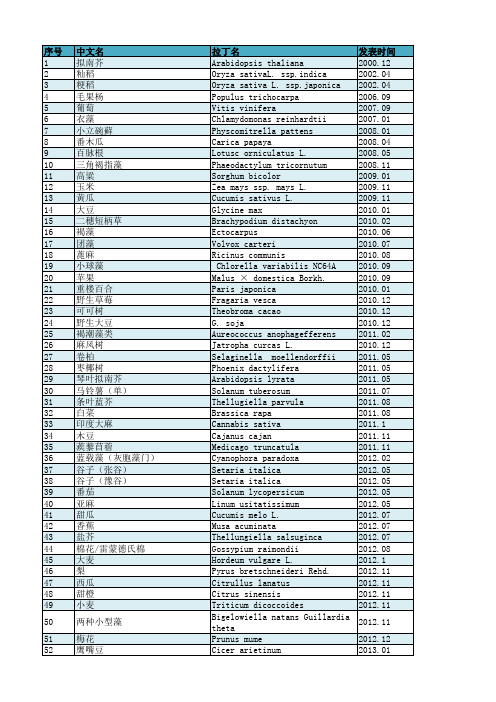
编号中文名拉丁名发表时间 刊物科、属基因组大小1拟南芥Arabidopsis thaliana 2000.12Nature 十字花科、鼠耳芥属125 Mb 2水稻Oryza sativa. ssp. indica 2002.04Science 禾本科、稻属466 Mb 3水稻Oryza sativa. ssp. japonica 2002.04Science 禾本科、稻属466 Mb 4杨树Populus trichocarpa2006.09Science 杨柳科、杨属480 Mb 5葡萄Vitis vinifera 2007.09Nature 葡萄科、葡萄属490 Mb 6衣藻Chlamydomonas reinhardtii 2007.01Science 衣藻科、衣藻属130 Mb 7小立碗藓Physcomitrella pattens2008.01Science 葫芦藓科、小立碗藓属480 Mb 8番木瓜Carica papaya 2008.04Nature 番木瓜科、番木瓜属370 Mb 9百脉根Lotus japonicus 2008.05DNA Research豆科、百脉根属472 Mb 10三角褐指藻Phaeodactylum tricornutum2008.11Nature 褐指藻属27.4 Mb 11高粱Sorghum bicolor2009.01Nature禾本科、高粱属730 Mb 12玉米Zea mays ssp. mays 2009.11Science 禾本科、玉米属2300 Mb 13黄瓜Cucumis sativus 2009.11Nature Genetics葫芦科、黄瓜属350 Mb 14大豆Glycine max 2010.01Nature豆科、大豆属1100 Mb 15二穗短柄草Brachypodium distachyon 2010.02Nature 禾本科、短柄草属260 Mb 16褐藻Ectocarpus 2010.06Nature 水云属 196 Mb 17团藻Volvox carteri2010.07Science团藻属138 Mb 18蓖麻Ricinus communis 2010.08Nature Biotechnology大戟科、蓖麻属350 Mb 19小球藻Chlorella variabilis 2010.09Plant Cell 小球藻科46 Mb 20苹果Malus × domestica 2010.09Nature Genetics 蔷薇科、苹果属742 Mb 21森林草莓Fragaria vesca 2010.12Nature Genetics 蔷薇科、草莓属240 Mb 22可可树Theobroma cacao 2010.12Nature Genetics梧桐科、可可属430- Mb 23野生大豆Glycine soja2010.12PNAS 豆科、大豆属915.4 Mb 24褐潮藻类Aureococcus anophagefferens2011.02PNAS 57 Mb 25麻风树Jatropha curcas2010.12DNA Research大戟科、麻风树属410 Mbs ci en ce ne t.cn : Gr an t l uj i an g26卷柏Selaginella moellendorffii 2011.05Science 卷柏属212 Mb 27枣椰树Phoenix dactylifera 2011.05Nature Biotechnology 棕榈科685 Mb 28琴叶拟南芥Arabidopsis lyrata 2011.05Nature Genetics十字花科、鼠耳芥属206.7 Mb 29马铃薯Solanum tuberosum 2011.07Nature 茄目、茄科、茄属844 Mb 30条叶蓝芥Thellugiella parvula 2011.08Nature Genetics 盐芥属140 Mb 31白菜Brassica rapa 2011.08Nature Genetics 十字花科、芸薹属485 Mb 32印度大麻Cannabis sativa 2011.01Genome Biology 大麻属534 Mb 33木豆Cajanus cajan 2011.11Nature Biotechnology豆科、木豆属833 Mb 34蒺藜苜蓿Medicago truncatula 2011.11Nature 豆科苜蓿属500 Mb 35蓝载藻Cyanophora paradoxa2012.02Science 灰胞藻门70 Mb 36谷子Setaria italica 2012.05Nature Biotechnology 禾本科、狗尾草属490 Mb 37谷子Setaria italica 2012.05Nature Biotechnology禾本科、狗尾草属510 Mb 38番茄Solanum lycopersicum2012.05Nature 茄科、茄属900 Mb 39甜瓜Cucumis melo 2012.07PNAS 葫芦科、甜瓜属450 Mb 40亚麻Linum usitatissimum 2012.07Plant Journal 亚麻科、亚麻属373 Mb 41盐芥Thellungiella salsuginea2012.07PNAS 十字花科、盐芥属260 Mb 42香蕉Musa acuminata 2012.07Nature 芭蕉科、芭蕉属523 Mb 43雷蒙德氏棉 Gossypium raimondii 2012.08Nature Genetics锦葵科、棉属775.2 Mb 44大麦Hordeum vulgare 2012.01Nature禾本科、大麦属 5.1 Gb 45梨Pyrus bretschneideri 2012.11Genome Research 蔷薇科、梨属527 Mb 46西瓜Citrullus lanatus 2012.11Nature Genetics 葫芦科、西瓜属425 Mb 47甜橙Citrus sinensis 2012.11Nature Genetics芸香科、柑橘属367 Mb 48小麦Triticum aestivum 2012.11Nature 禾本科、小麦属17 Gb 49两种小型藻Bigelowiella natans, Guillardiatheta2012.11Nature 95 Mb, 87 Mb 50棉花(雷蒙德氏棉)Gossypium raimondii2012.12Nature 锦葵科、棉属761.4 Mb 51梅花Prunus mume 2012.12Nature Communications 蔷薇科、梨属280 Mb 52鹰嘴豆Cicer arietinum2013.01Nature Biotechnology豆科、鹰嘴豆属738 Mbs ci en ce ne t.cn :Gr an tl uj i an g53橡胶树Hevea brasiliensis 2013.02BMC Genomics 大戟科、橡胶树属2.15 Gb 54毛竹Phyllostachys heterocycla 2013.02Nature Genetics 竹科、钢竹属 2.075 Gb 55短花药野生稻Oryza brachyantha 2013.03Nature Communications禾本科稻属342 Mb-362 Mb56小麦A Triticum urartu 2013.03Nature 禾本科、小麦属 4.94 Gb 57小麦D grassAegilops tauschii 2013.03Nature 禾本科、小麦属 4.36 Gb 58桃树Prunus persica 2013.03Nature Genetics 蔷薇科、梨属265 Mb 59丝叶狸藻Utricularia gibba 2013.05Nature 狸藻科、狸藻属82 Mb 60中国莲Nelumbo nucifera Gaertn2013.05Genome Biology睡莲科、莲属929 Mb 61挪威云杉Picea abies 2013.05Nature 松科、云杉属19.6 Gb 62海洋球石藻Emiliania huxleyi 2013.06Nature 定鞭藻纲141.7 Mb 63虫黄藻Symbiodinium minutum 2013.07Current Biology甲藻门1.5 Gb 64油棕榈Elaeis guineensis 2013.07Nature棕榈科、油棕榈属1.8 Gb 65枣椰树Phoenix dactylifera 2013.08Nature Communications棕榈科、刺葵属671 Mb 66醉蝶花Tarenaya hassleriana 2013.08Plant Cell 醉蝶花科、醉蝶花属290 Mb 67莲Nelumbo nucifera 2013.08Plant Journal 睡莲科、莲属879 Mb 68桑树Morus notabilis 2013.09Nature Communications 桑科、桑属357 Mb 69猕猴桃Actinidia chinensis 2013.01Nature Communications 猕猴桃属616.1 Mb 70胡杨Populus euphratica 2013.11Nature Communications杨属496.5 Mb 71八倍体草莓 F. x ananassa 2013.12DNA Research 草莓属698 Mb 72康乃馨Dianthus caryophyllus L.2013.12DNA Research石竹属622 Mb 73甜菜Beta vulgaris ssp. vulgaris 2013.12Nature 藜科甜菜属566.6 Mb 74无油樟(互叶梅)Amborella trichopoda 2013.12Science 无油樟属748 Mb 75辣椒Capsicum annuum 2014.01Nature Genetics 辣椒属 3.48 Gb 76芝麻Sesamum indicum 2014.02Genome Biology胡麻科胡麻属274 Mb 77辣椒Capsicum annuum (Zunla-1)2014.03PNAS 辣椒属 3.48 Gb 78火炬松Pinus taeda (Loblolly pine)2014.03Genome Biology 松属23.2 Gb 79棉花(亚洲棉)Gossypium arboreum2014.05Nature Genetics锦葵科、棉属1694 Mbs ci en ce ne t.cn : Gr an t l uj i a n g80萝卜Raphanus sativus L. 2014.05DNA Research 十字花科、萝卜属402 Mb 81甘蓝Brassica oleracea 2014.05Nature Communications十字花科、芸薹属630 Mb 82菜豆Phaseolus vulgaris L .2014.06Nature Genetics 豆科,菜豆属587 Mb 83野生大豆Glycine soja 2014.07Nature Communications豆科、大豆属868 Mb 84普通小麦Triticum aestivum 2014.07Science 禾本科17 Gb 85野生西红柿Solanum pennellii 2014.07Nature Genetics茄科942 Mb 86非洲野生稻Oryza glaberrima 2014.08Nature Genetics禾本科316 Mb 87油菜Brassica napus 2014.08Science 十字花科630 Mb 88中果咖啡Coffea canephora 2014.09Science 茜草科,咖啡属710 Mb 89茄子Solanum melongena2014.09DNA Research 茄科、茄属1093 Mb 90多个野生大豆Glycine soja 2014.09Nature Biotechnology 豆科、大豆属889.33~1,118.34 Mb91枣Ziziphus jujuba 2014.10Nature Communications鼠李科、枣属444 Mb92绿豆Vigna radiata 2014.10Nature Communications 豆科、豇豆属543 Mb 93啤酒花Humulus lupulus 2014.11Plant and Cell Physiology 大麻科、葎草属 2.57 Gb 94蝴蝶兰Phalaenopsis equestris 2014.11Nature Genetics 兰科、蝴蝶兰属 1.16 Gb 95铁皮石斛Dendrobium officinale2014.12Molecular Plant 兰科、石斛属 1.35 Gb 96青稞Lasa goumang 2015.01PNAS 禾本科、大麦属 4.5 Gb 97报春花Primula veris2015.01Genome Biology 报春花科、报春花属479 Mb 98陆地棉(南农)Gossypium hirsutum L. acc. TM-12015.03Nature Biotechnology 锦葵科、棉属 2.5 Gb 99陆地棉(棉花所)Gossypium hirsutum L. acc. TM-12015.03Nature Biotechnology 锦葵科、棉属2.173 Gb 100海带Saccharina japonica 2015.04Nature Communications 海带科、海带属537 Mb 101长春花Catharanthus roseus 2015.04The Plant Journal夹竹桃科、长春花属738 Mb 102科民茄Solanum commersor 2015.04Plant cell 茄科、茄属830 Mb 103茭白Zizania latifolia 2015.06The Plant Journal 禾本科、菰属590 Mb 104黑麦草Lolium perenne 2015.09The Plant Journal 禾本科、黑麦草属 2 Gb 105小豆Vigna angularis 2015.10Nature Communications豆科、豇豆属542 Mb 106菠萝Ananas comosus2015.11Nature Genetics 凤梨科、凤梨属526 Mbs ci en ce ne t.cn : Gr an t l uj i an g107复活草Oropetium thomaeum 2015.11Nature 虎尾草亚科245 Mb 108丹参Salvia miltiorrhiza 2015.12GigaScience 唇形科、鼠尾草属641 Mb 109铁皮石斛Dendrobium catenatum 2016.01Scientific Reports 兰科、石斛属 1.11 Gbs ci en ce ne t.cn : Gr an t l uj i a n g。
已发表植物基因组(2018.04)
发表时间 2000.12 2002.04 2002.04 2006.09 2007.09 2007.01 2008.01 2008.04 2008.05 2008.11 2009.01 2009.11 2009.11 2010.01 2010.02 2010.06 2010.07 2010.08 2010.09 2010.09 2010.01 2010.12 2010.12 2010.12 2011.02 2010.12 2011.05 2011.05 2011.05 2011.07 2011.08 2011.08 2011.1 2011.11 2011.11 2012.02 2012.05 2012.05 2012.05 2012.05 2012.07 2012.07 2012.07 2012.08 2012.1 2012.11 2012.11 2012.11 2012.11
Gossypium hirsutum
2015.04
109 海带
Saccharina japonica
2015.04
110 科民茄(南美一种野生马铃薯) Solanum commersonii
2015.04
111 牛耳草
Boea hygrometrica
2015.04
112 长春花
Catharanthus roseus
2016.02
132 落花生
Arachis ipaensis
2016.02
133 鳗草
Zostera marina
2016.02
134 菜豆
Phaseolus vulgaris
2016.02
135 日本结缕草
Zoysia japonica
2016.04
- 1、下载文档前请自行甄别文档内容的完整性,平台不提供额外的编辑、内容补充、找答案等附加服务。
- 2、"仅部分预览"的文档,不可在线预览部分如存在完整性等问题,可反馈申请退款(可完整预览的文档不适用该条件!)。
- 3、如文档侵犯您的权益,请联系客服反馈,我们会尽快为您处理(人工客服工作时间:9:00-18:30)。
Cajanus cajan
蒺藜苜蓿
Medicago truncatula
蓝载藻(灰胞藻门) 谷子 谷子 番茄 甜瓜 亚麻 盐芥 香蕉 雷蒙德氏棉
Cyanophora paradoxa Setaria italica Setaria italica Solanum lycopersicum Cucumis melo L. Linum usitatissimum Thellungiella salsuginea Musa acuminata Gossypium raimondii
2n=42 2n=38 2n=32
2n=42
2n=48 2n=6 2n=10
海葵
12种果蝇基因组进化 分析(10种新)
猫
Nematostella vectensis D.sechellia, D.simulans , D.yakuba , D.erecta , D.ananassae , D.persimilis , D.willistoni , D.mojavensis , D.virilis and D.grimshawi
Fragaria vesca
Theobroma cacao G. soja
发表时间 刊物
科、属
基因组大小
2000.12
2002.04 2002.04 2006.09 2007.09 2007.01 2008.01
2008.04 2008.11 2009.01 2009.11 2009.11 2010.01 2010.02 2010.06 2010.07 2010.08 2010.09 2010.09
70M 4预9估0M510M,组 装出400M 900Mb 450Mb 373Mb 260Mb 523Mb 775.2Mb
2n=18 2n=18 2n=24 2n = 24 2n = 30 2n = 14 2n = 22 2n = 26
动物基因组(81) 中文名
拉丁名
发表时间 刊物
科、属
基因组大小
染色体 数量
2010.12
2010.12 2010.12
十字花科
Nature
(Brassicaceae) 鼠耳芥属
125M
Science Science Science Nature Science Science
(Arabidopsis)
禾本科Poaceae 稻 禾属 本O科rPyzoaaceae 稻属Oryza
血吸虫属
360M
血吸虫
马 熊猫 金小蜂 豌豆蚜虫 水螅 非洲爪蟾
珍珠鸟 人类体虱 海绵
Schistosoma japonicum
2009.07 Nature
Equus caballus
2009.11
Ailuropoda melanoleura
2010.01
Nasonia vitripennis, N. giraulti, N. longicornis
Rattus norvegicus
Tetraodon nigroviridis Bombyx mori Gallus sonneratii
Drosophila pseudoobscura
Trypanosoma cruzi Pan troglodytes Canis familiaris Apis mellifera Strongylocentrotus purpuratus Callorhinchus milii Macaca mulatta Monodelphis domestica Oryzias latipes Aedes aegypti Brugia malayi
裂吸虫
Schistosoma mansoni
2007.07 Science
海葵目
357M
2007.11 Nature
果蝇科、果蝇 属
2007.11
2008.04 2008.05 2008.06 2008.08 2008.08 2008.11 2009.04
Genome Research
猫科、猫属 2.7G 鞘翅目、拟步
Nature
行虫科、拟谷 204M
Nature
盗 鸭属 嘴兽科、鸭
嘴兽属
1.84G
Nature
文昌鱼科、文
昌鱼属
520M
丝盘虫科、丝
Nature
盘虫属
104M
Nature
线虫属
86M
Biotechnology Nature
象科、猛犸象 属
4.7G
Science
牛科、牛属 2.87 G
2009.07 Nature
鼠科
2.5 G
鲀科、东方鲀 属
380M
海鞘纲
150M
PLoS Biology
Caenorhabditis 亚属
104M
Nature
啮齿目、鼠科 2.75 G
2004.10 2004.12 2004.12 2005.01 2005.07
Nature Science Nature Genome research Science
属 葫芦科、黄瓜 2300M
属
350M
豆科、大豆属 1100M
Nature
禾本科、短柄
草属
260M
Nature
水云属
196M
Science
团藻属
138M
Nature
大戟科、蓖麻
Biotechnology 属
350M
Plant Cell 小球藻科
46M
Nature Genetics
蔷薇科、苹果
属
742M
2005.09 2005.12 2006.10
Nature Nature Nature
鲀科 鳞翅目、蚕蛾 科 雉科、原鸡属
340M 428.7 M 1.06G
果蝇科、果蝇
属
139M
锥虫属
67M
猩猩科、黑猩
猩属
2.7G
犬科、犬属 2.5 G
昆虫纲
236M
2006.11
2007.04
2007.04
2007.05 2007.06 2007.06 2007.07
2n=16 2n=4X=4 8 2n=14 2n=20 2n = 20
2n = 22
2011.11 Nature
豆科苜蓿属 500M
2n=16
2012.02 2012.05 2012.05 2012.05 2012.07 2012.07 2012.07 2012.07 2012.08
Science Nature
2011.02 2010.12 2011.05 2011.05
2011.05
2011.07 2011.08 2011.08 2011.10
2011.11
PNAS
57M
DNA Res.
大戟科、麻风
树属
410M
Science
卷柏属
212M
Nature棕榈科ຫໍສະໝຸດ biotechnology
685M
Nature Genetics
1998.12
2000.03
2002.10 2002.12 2002.12 2002.12 2003.11
2004.04
Science
小杆总科、 Caenorhabditis 97M 亚属
Science
果蝇科、果蝇 属
180M
Science
蚊科、按蚊属 280M
Nature Science Science
Felis catus
赤拟谷盗
Tribolium castaneum
鸭嘴兽
Ornithorhynchus anatinus
文昌鱼
Branchiostoma floridae
丝盘虫
根结线虫 古猛犸象 牛
Trichoplax adhaerens Meloidogyne incognita Mammuthus primigenius Bos taurus
灰胞藻门 禾本科、狗尾
bNiaottuercehnology 草 禾属 本科、狗尾
biotechnology 草属
Nature
茄科、茄属
葫芦科、甜瓜
PNAS Plant Journal PNAS
属 亚麻科、亚麻 属 十字花科、盐 芥 芭属 蕉科、芭蕉
Nature Nature
属 锦葵科、棉属
Genetics
2010.04
2010.07 2010.08
Nature
PNAS Nature
血吸虫属
397M
马科、马属 熊科、大熊猫 属 膜翅目、金小 蜂科
2.7G 2.25G
295M
水螅科、水螅 属 负子蟾科、非 洲爪蟾属
517M 1.05G
1.7 G
文鸟科、梅花 雀属
1.2G
人虱属
110M
多空动物门 190M
Nature Genetics
蔷薇科、草莓
属
240M
Nature Genetics
梧桐科、可可
属
430-Mb
PNAS
豆科、大豆属 915.4 Mb
倍性、 染色体
2n=10
2n=24 2n=24 2n=38 2n=38
2n=18
2n=20 2n=20 2n=14 2n=40 2n=10 36
2n=20 2n=24 2n=34 2n=14 2n=20 2n=40
Science