控件参数使用方法(精)
Pythontkinter之控件方法bind的使用

Pythontkinter之控件⽅法bind的使⽤1.调⽤规则:窗体对象.bind(事件类型,回调函数)2.<Button-1>表⽰⿏标左键单击,其中的1换成3表⽰右键被单击,为2的时候表⽰⿏标中键 t=Label(root, text='标签') t.bind(<Button-1>, 函数名) # ⿏标左键点击时调⽤函数例:1from tkinter import *2 tk=Tk()#⽗窗⼝类实例3 tk.title("bind⽤法实例")#窗⼝标题45def LoveChina(event):#定义回调函数6 x1=Label(tk,text='我爱你中国!',background='pink')7 x1.pack()8 x2=Button(tk,text='单击左键试试')#定义⼀个按钮9 x2.bind('<Button-1>',LoveChina)#单击⿏标左键,绑定LoveChina()函数10 x2.pack()1112 tk.mainloop()运⾏结果如下:3.<KeyPress-A>表⽰A键被按下,其中的A可以换成其他的键位4.<Control-V>表⽰按下的是Ctrl和V键,V可以换成其他键位5.<F1>表⽰按下的是F1键,对于Fn系列的,都可以随便换6.unbind()事件unbind([type],[data],Handler) 是 bind()的反向操作,从每⼀个匹配的元素中删除绑定的事件。
如果没有参数,则删除所有绑定的事件。
你可以将你⽤bind()注册的⾃定义事件取消绑定。
如果提供了事件类型作为参数,则只删除该类型的绑定事件。
如果把在绑定时传递的处理函数作为第⼆个参数,则只有这个特定的事件处理函数会被删除。
ScanOnWeb扫描仪控件使用说明

ScanOnWeb扫描仪控件使用说明ScanOnWeb扫描仪控件工作在IE浏览器中,控件定位用于专属应用系统开发,使用时需要预先调整浏览器设定,允许加载未签名 Activex控件。
控件负责读取扫描仪图像,扫描结果支持进行二次编辑,包括旋转、自由选择不规则图形、选择框型图形、裁剪图像等功能,扫描结果支持单页面保存模式及多页面保存模式,多页面格式支持phtoshop PSD格式、TIFF文件格式、GIF、adobe PDF 格式等多种常见图像文档格式。
如果用于扫描黑白色文档信息时,保存的PDF文件压缩比高,生成文件小巧。
控件的使用过程为:1.浏览器加载控件cab压缩包。
2.控件自动初始化。
3.用户选择扫描用的扫描仪设备、扫描结果分辨率(DPI)、扫描结果颜色类型等参数。
4.开始扫描。
5.用户自行决定进行二次编辑处理。
6.如果无需程序控制文档上传,调用控件提供的方法保存扫描结果到客户端本地计算机并结束。
7.如果需要上传扫描结果,根据需要读取单页面扫描结果数据或者取多页扫描结果数据的base64编码数据值,提交数据到服务器端,结束。
以下详细说明这7个步骤的使用细节及注意事项,注意仔细阅读!1.如何加载控件?在浏览器页面中加入如下内容:<object classid="clsid:15D142CD-E529-4B01-9D62-22C9A6C00E9B"id="scaner1" width="100%" height="600"codebase="./cabs/ScanOnWeb.cab#version=1,0,0,1"><param name="Visible" value="0"><param name="AutoScroll" value="0"><param name="AutoSize" value="0"><param name="AxBorderStyle" value="1"><param name="Caption" value="scaner"><param name="Color" value="4278190095"><param name="Font" value="宋体"><param name="KeyPreview" value="0"><param name="PixelsPerInch" value="96"><param name="PrintScale" value="1"><param name="Scaled" value="-1"><param name="DropTarget" value="0"><param name="HelpFile" value><param name="PopupMode" value="0"><param name="ScreenSnap" value="0"><param name="SnapBuffer" value="10"><param name="DockSite" value="0"><param name="DoubleBuffered" value="0"><param name="ParentDoubleBuffered" value="0"><param name="UseDockManager" value="0"><param name="Enabled" value="-1"><param name="AlignWithMargins" value="0"><param name="ParentCustomHint" value="-1"><param name="jpegBase64Data" value=""><param name="bmpBase64Data" value=""><param name="key1" value=""><param name="key2" value=""></object>在上面的代码中,红色的部分为制定控件所在路径的部分,./cabs/scaner.cab指的是控件的cab压缩包文件放在页面当前路径的cabs子目录中,控件压缩包名称为scaner.cab,根据项目的需要,该存放路径及控件名称都可以自行进行定制。
c#_ms_chart_控件使用方法汇总(附统计图)
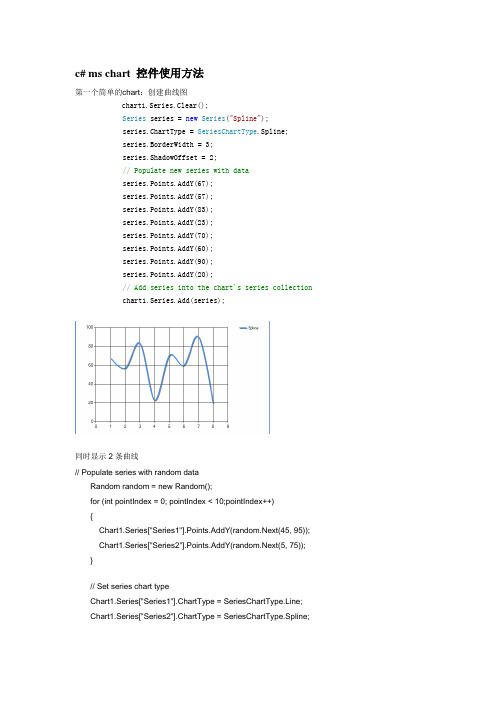
c# ms chart 控件使用方法第一个简单的chart:创建曲线图chart1.Series.Clear();Series series = new Series("Spline");series.ChartType = SeriesChartType.Spline;series.BorderWidth = 3;series.ShadowOffset = 2;// Populate new series with dataseries.Points.AddY(67);series.Points.AddY(57);series.Points.AddY(83);series.Points.AddY(23);series.Points.AddY(70);series.Points.AddY(60);series.Points.AddY(90);series.Points.AddY(20);// Add series into the chart's series collectionchart1.Series.Add(series);同时显示2条曲线// Populate series with random dataRandom random = new Random();for (int pointIndex = 0; pointIndex < 10;pointIndex++){Chart1.Series["Series1"].Points.AddY(random.Next(45, 95)); Chart1.Series["Series2"].Points.AddY(random.Next(5, 75)); }// Set series chart typeChart1.Series["Series1"].ChartType = SeriesChartType.Line; Chart1.Series["Series2"].ChartType = SeriesChartType.Spline;// Set point labelsChart1.Series["Series1"].IsValueShownAsLabel = true;Chart1.Series["Series2"].IsValueShownAsLabel = true;// Enable X axis marginChart1.ChartAreas["ChartArea1"].AxisX.IsMarginVisible = true;// Enable 3D, and show data point marker linesChart1.ChartAreas["ChartArea1"].Area3DStyle.Enable3D = true; Chart1.Series["Series1"]["ShowMarkerLines"] = "True";Chart1.Series["Series2"]["ShowMarkerLines"] = "True";显示column类型图,柱状图// Create new data series and set it's visual attributesChart1.Series.Clear();Series series = new Series("FlowRead");series.ChartType = SeriesChartType.Column;series.BorderWidth = 3;series.ShadowOffset = 2;// Populate new series with dataseries.Points.AddY(67);series.Points.AddY(57);series.Points.AddY(83);series.Points.AddY(23);series.Points.AddY(70);series.Points.AddY(60);series.Points.AddY(90);series.Points.AddY(20);// Add series into the chart's series collectionChart1.Series.Add(series);很多点,效率还可以// Fill series datadouble yValue = 50.0;Random random = new Random();for (int pointIndex = 0; pointIndex < 20000;pointIndex++){yValue = yValue + (random.NextDouble() * 10.0 - 5.0);Chart1.Series["Series1"].Points.AddY(yValue);}// Set fast line chart typeChart1.Series["Series1"].ChartType = SeriesChartType.FastLine;日期,xy类型// Create a new random number generatorRandom rnd = new Random();// Data points X value is using current date DateTime date = DateTime.Now.Date;// Add points to the stock chart seriesfor (int index = 0; index < 10; index++){Chart1.Series["Series1"].Points.AddXY( date, // X value is a daternd.Next(40,50)); //Close Y value// Add 1 day to our X valuedate = date.AddDays(1);int-int的xy数据绘图// Create a new random number generatorRandom rnd = new Random();// Add points to the stock chart seriesfor (int index = 0; index < 10; index++){Chart1.Series["Series1"].Points.AddXY(rnd.Next(10,90), // X value is a date rnd.Next(40,50)); //Close Y value数据库数据,datetime-int类型Chart1.Series.Clear();OleDbConnection conn = new OleDbConnection("Provider=Microsoft.Jet.OLEDB.4.0;Data Source=" +Application.StartupPath + @"\db.mdb" + ";Persist Security Info=False");OleDbCommand cmd = conn.CreateCommand();conn.Open();mandText = "select 时间,序号from pub_log_read order by 序号asc";//DataSet ds = new DataSet();//OleDbDataAdapter da = new OleDbDataAdapter();//da.SelectCommand = cmd;//da.Fill(ds, "tbscore");OleDbDataReader dr = cmd.ExecuteReader(CommandBehavior.CloseConnection);Chart1.DataBindTable(dr, "时间");dr.Close();数据库数据2,string-int类型Chart1.Series.Clear();OleDbConnection conn = new OleDbConnection("Provider=Microsoft.Jet.OLEDB.4.0;Data Source=" +Application.StartupPath + @"\db.mdb" + ";Persist Security Info=False");OleDbCommand cmd = conn.CreateCommand();conn.Open();mandText = "select 账号,count(账号) as 次数from pub_log_read group by 账号order by 账号asc";//DataSet ds = new DataSet();//OleDbDataAdapter da = new OleDbDataAdapter();//da.SelectCommand = cmd;//da.Fill(ds, "tbscore");OleDbDataReader dr = cmd.ExecuteReader(CommandBehavior.CloseConnection);Chart1.DataBindTable(dr, "账号");dr.Close();数据库绑定3-string-int型Chart1.Series.Clear();Chart1.Series.Add("Series1");OleDbConnection conn = new OleDbConnection("Provider=Microsoft.Jet.OLEDB.4.0;Data Source=" +Application.StartupPath + @"\db.mdb" + ";Persist Security Info=False");OleDbCommand cmd = conn.CreateCommand();mandText = "select 账号,count(账号) as 次数from pub_log_read group by 账号order by 账号asc";conn.Open();DataSet ds = new DataSet();OleDbDataAdapter da = new OleDbDataAdapter();da.SelectCommand = cmd;da.Fill(ds, "tbscore");Chart1.DataSource = ds;Chart1.Series["Series1"].XValueMember = "账号";Chart1.Series["Series1"].YValueMembers = "次数";// Data bind to the selected data sourceChart1.DataBind();conn.Close();数据库4,只绑定yChart1.Series.Clear();Chart1.Series.Add("序号");OleDbConnection conn = new OleDbConnection("Provider=Microsoft.Jet.OLEDB.4.0;Data Source=" +Application.StartupPath + @"\db.mdb" + ";Persist Security Info=False");OleDbCommand cmd = conn.CreateCommand();conn.Open();mandText = "select 序号from pub_log_read order by 序号asc";//DataSet ds = new DataSet();//OleDbDataAdapter da = new OleDbDataAdapter();//da.SelectCommand = cmd;//da.Fill(ds, "tbscore");OleDbDataReader dr = cmd.ExecuteReader(CommandBehavior.CloseConnection);Chart1.Series[0].Points.DataBindY(dr);dr.Close();数据库5,绑定xyChart1.Series.Clear();Chart1.Series.Add("序号");OleDbConnection conn = new OleDbConnection("Provider=Microsoft.Jet.OLEDB.4.0;Data Source=" +Application.StartupPath + @"\db.mdb" + ";Persist Security Info=False");OleDbCommand cmd = conn.CreateCommand();conn.Open();mandText = "select 账号,count(账号) as 次数from pub_log_read group by 账号order by 账号desc";//DataSet ds = new DataSet();//OleDbDataAdapter da = new OleDbDataAdapter();//da.SelectCommand = cmd;//da.Fill(ds, "tbscore");OleDbDataReader dr = cmd.ExecuteReader(CommandBehavior.CloseConnection);Chart1.Series[0].Points.DataBindXY(dr,"账号",dr,"次数");dr.Close();数据库6,支持显示参数Chart1.Series.Clear();Chart1.Series.Add("S1");OleDbConnection conn = new OleDbConnection("Provider=Microsoft.Jet.OLEDB.4.0;Data Source=" +Application.StartupPath + @"\db.mdb" + ";Persist Security Info=False");OleDbCommand cmd = conn.CreateCommand();conn.Open();mandText = "SELECT * FROM REPSALES WHERE Year=2004";//DataSet ds = new DataSet();//OleDbDataAdapter da = new OleDbDataAdapter();//da.SelectCommand = cmd;//da.Fill(ds, "tbscore");OleDbDataReader dr = cmd.ExecuteReader(CommandBehavior.CloseConnection);Chart1.Series[0].Points.DataBind(dr, "name", "sales", "Tooltip=Year,Label=Commissions{C2}");dr.Close();数据库7,支持多lineChart1.Series.Clear();Chart1.Series.Add("S1");OleDbConnection conn = new OleDbConnection("Provider=Microsoft.Jet.OLEDB.4.0;Data Source=" +Application.StartupPath + @"\db.mdb" + ";Persist Security Info=False");OleDbCommand cmd = conn.CreateCommand();conn.Open();mandText = "SELECT * FROM REPSALES";//DataSet ds = new DataSet();//OleDbDataAdapter da = new OleDbDataAdapter();//da.SelectCommand = cmd;//da.Fill(ds, "tbscore");OleDbDataReader dr = cmd.ExecuteReader(CommandBehavior.CloseConnection);Chart1.DataBindCrossTable(dr, "Name", "Year", "Sales", "Label=Commissions{C}");dr.Close();数据库8,按照行添加数据// Resolve the address to the Access databasestringfileNameString = this.MapPath(".");fileNameString += "..\\..\\..\\data\\chartdata.mdb";//Initialize a connectionstringstringmyConnectionString = "PROVIDER=Microsoft.Jet.OLEDB.4.0;DataSource=" + fileNameString;// Definethe databasequerystringmySelectQuery="SELECT * FROM SALESCOUNTS;";// Createa database connection object using the connectionstringOleDbConnection myConnection = newOleDbConnection(myConnectionString);// Create adatabase command on the connection usingqueryOleDbCommandmyCommand = new OleDbCommand(mySelectQuery, myConnection);// Open theconnectionmyCommand.Connection.Open();//Initializes a new instance of the OleDbDataAdapter classOleDbDataAdapter myDataAdapter = new OleDbDataAdapter();myDataAdapter.SelectCommand = myCommand;//Initializes a new instance of the DataSet classDataSetmyDataSet = new DataSet();// Addsrows in the DataSetmyDataAdapter.Fill(myDataSet,"Query");foreach(DataRow row in myDataSet.Tables["Query"].Rows){// For each Row add a new seriesstring seriesName = row["SalesRep"].ToString();Chart1.Series.Add(seriesName);Chart1.Series[seriesName].ChartType = SeriesChartType.Line;Chart1.Series[seriesName].BorderWidth = 2;for(int colIndex = 1; colIndex <myDataSet.Tables["Query"].Columns.Count; colIndex++) {// For each column (column 1 and onward) add the value as apointstring columnName =myDataSet.Tables["Query"].Columns[colIndex].ColumnName; int YVal = (int) row[columnName];Chart1.Series[seriesName].Points.AddXY(columnName, YVal);}}DataGrid.DataSource = myDataSet;DataGrid.DataBind();// Closesthe connection to the data source. This is the preferred// method ofclosing any open connection.myCommand.Connection.Close();使用xml数据// resolve the address to the XML documentstringfileNameString = this.MapPath(".");stringfileNameSchema = this.MapPath(".");fileNameString += "..\\..\\..\\data\\data.xml";fileNameSchema += "..\\..\\..\\data\\data.xsd";//Initializes a new instance of the DataSet classDataSetcustDS = new DataSet();// Read XMLschema into the DataSet.custDS.ReadXmlSchema( fileNameSchema );// ReadXML schema and data into the DataSet.custDS.ReadXml( fileNameString );//Initializes a new instance of the DataView classDataViewfirstView = new DataView(custDS.Tables[0]);// Sincethe DataView implements and IEnumerable, pass the reader directlyinto// theDataBindTable method with the name of the column used for the Xvalue.Chart1.DataBindTable(firstView, "Name");使用excel数据// resolve the address to the Excel filestringfileNameString = this.MapPath(".");fileNameString += "..\\..\\..\\data\\ExcelData.xls";// Createconnection object by using the preceding connection string.string sConn= "Provider=Microsoft.Jet.OLEDB.4.0;Data Source=" +fileNameString + ";Extended Properties="Excel8.0;HDR=YES"";OleDbConnection myConnection = new OleDbConnection( sConn );myConnection.Open();// Thecode to follow uses a SQL SELECT command to display the data fromthe worksheet.// Createnew OleDbCommand to return data from worksheet.OleDbCommandmyCommand = new OleDbCommand( "Select * From[data1$A1:E25]",myConnection );// createa databasereaderOleDbDataReader myReader=myCommand.ExecuteReader(CommandBehavior.CloseConnection);//Populate the chart with data in the fileChart1.DataBindTable(myReader, "HOUR");// closethe reader and the connectionmyReader.Close();myConnection.Close();使用csv数据// Filename of the CSV filestring file= "DataFile.csv";// Getthe path of the CSV filestring path= this.MapPath(".");path +="..\\..\\..\\data\";// Createa select statement and a connection string.stringmySelectQuery = "Select * from " + file;stringConStr = "Provider=Microsoft.Jet.OLEDB.4.0;Data Source="+path+ ";Extended Properties="Text;HDR=No;FMT=Delimited"";OleDbConnection myConnection = new OleDbConnection(ConStr);// Createa database command on the connection using queryOleDbCommandmyCommand = new OleDbCommand(mySelectQuery, myConnection);// Openthe connection and create the readermyCommand.Connection.Open();OleDbDataReader myReader=myCommand.ExecuteReader(CommandBehavior.CloseConnection);// Column1 is a time value, column 2 is a double// Databindthe reader to the chart using the DataBindXY methodChart1.Series[0].Points.DataBindXY(myReader, "1", myReader,"2");// Closeconnection and data readermyReader.Close();myConnection.Close();数组绘图// Initialize an array of doublesdouble[] yval = { 2, 6, 4, 5, 3 };// Initialize an array of stringsstring[] xval = { "Peter", "Andrew", "Julie", "Mary", "Dave" };// Bind the double array to the Y axis points of the Default dataseriesChart1.Series["Series1"].Points.DataBindXY(xval, yval);数据库9,dataview// Resolve the address to the Access databasestringfileNameString = this.MapPath(".");fileNameString += "..\\..\\..\\data\\chartdata.mdb";//Initialize a connectionstringstringmyConnectionString = "PROVIDER=Microsoft.Jet.OLEDB.4.0;DataSource=" + fileNameString;// Definethe databasequerystringmySelectQuery="SELECT * FROM REPS;";// Createa database connection object using the connectionstringOleDbConnection myConnection = newOleDbConnection(myConnectionString);// Create adatabase command on the connection usingqueryOleDbCommandmyCommand = new OleDbCommand(mySelectQuery, myConnection);// Open theconnectionmyCommand.Connection.Open();//Initializes a new instance of the OleDbDataAdapter classOleDbDataAdapter custDA = new OleDbDataAdapter();custDA.SelectCommand = myCommand;//Initializes a new instance of the DataSet classDataSetcustDS = new DataSet();// Addsrows in the DataSetcustDA.Fill(custDS, "Customers");//Initializes a new instance of the DataView classDataViewfirstView = new DataView(custDS.Tables[0]);// Sincethe DataView implements IEnumerable, pass the dataview directlyinto// the DataBind method with thename of the Columns selected in thequeryChart1.Series["Default"].Points.DataBindXY(firstView,"Name",firstView, "Sales");// Closesthe connection to the data source. This is the preferred// method of closing any openconnection.myCommand.Connection.Close();指定坐标轴的数据显示范围// Create a new random number generatorRandom rnd = new Random();// Add points to the stock chart seriesfor (int index = 0; index < 10; index++){Chart1.Series["Series1"].Points.AddXY(rnd.Next(10,90), // X value is a daternd.Next(40,50)); //Close Y value}Chart1.ChartAreas[0].AxisY.Minimum = 40;Chart1.ChartAreas[0].AxisY.Maximum = 50;数据排序// Use point index for drawing the chartChart1.Series["Series1"].IsXValueIndexed = true;// Sortseries points by second Y valueChart1.DataManipulator.Sort(PointSortOrder.Ascending, "Y2","Series1");查找数据最大值和最小值// Find point with maximum Y value and change colorDataPointmaxValuePoint =Chart1.Series["Series1"].Points.FindMaxValue(); maxValuePoint.Color = Color.FromArgb(255, 128, 128);// Findpoint with minimum Y value and change colorDataPointminValuePoint =Chart1.Series["Series1"].Points.FindMinValue(); minValuePoint.Color = Color.FromArgb(128, 128, 255);pie显示交互private void Page_Load(object sender, System.EventArgs e){// Addseries to the chartSeriesseries = Chart1.Series.Add("My series");// Setseries and legend tooltipsseries.ToolTip = "#VALX: #VAL{C} million";series.LegendToolTip = "#PERCENT";series.PostBackValue = "#INDEX";series.LegendPostBackValue = "#INDEX";// Populateseries datadouble[] yValues = {65.62, 75.54, 60.45, 34.73, 85.42, 32.12, 55.18, 67.15,56.24, 23.65};string[] xValues = {"France", "Canada", "Germany", "USA", "Italy", "Russia","China", "Japan", "Sweden", "Spain" };series.Points.DataBindXY(xValues, yValues);// Setseries visual attributesseries.Type= SeriesChartType.Pie;series.ShadowOffset = 2;series.BorderColor = Color.DarkGray;series.CustomAttributes = "LabelStyle=Outside";}protected void Chart1_Click(object sender, ImageMapEventArgse){intpointIndex = int.Parse(e.PostBackValue);Seriesseries = Chart1.Series["My series"];if(pointIndex >= 0 &&pointIndex < series.Points.Count){series.Points[pointIndex].CustomProperties +="Exploded=true";}}chart点击事件/// <summary>/// Page Load event handler./// </summary>protected void Page_Load(object sender, System.EventArgs e){this.Chart1.Click += new ImageMapEventHandler(Chart1_Click);// directusing of PostBackValueforeach(Series series in this.Chart1.Series){series.PostBackValue = "series:" + + ",#INDEX";}// transferof click coordinates. getCoordinates is a javascriptfunction.stringpostbackScript =ClientScript.GetPostBackEventReference(this.Chart1,"chart:@");this.Chart1.Attributes["onclick"] = postbackScript.Replace("@'", "'+ getCoordinates(event)"); }/// <summary>/// Handles the Click event of the Chart1 control./// </summary>/// <param name="sender">The sourceof the event.</param>/// <paramname="e">The<seecref="System.Web.UI.WebControls.ImageMapEventArgs"/>instance containing the eventdata.</param>protected void Chart1_Click(object sender, ImageMapEventArgse){this.Chart1.Titles["ClickedElement"].Text = "Nothing";string[]input = e.PostBackValue.Split(':');if(input.Length == 2){string[] seriesData = input[1].Split(',');if (input[0].Equals("series")){this.Chart1.Titles["ClickedElement"].Text = "Last Clicked Element:" + seriesData[0] + " - Data Point #" + seriesData[1];}else if (input[0].Equals("chart")){// hit test of X and Y click pointHitTestResult hitTestResult=this.Chart1.HitTest(Int32.Parse(seriesData[0]),Int32.Parse(seriesData[1]));if (hitTestResult != null){this.Chart1.Titles["ClickedElement"].Text = "Last Clicked Element:" + hitTestResult.ChartElementType.ToString();}}}}。
JavaSwing日历控件

Java swing日历控件,界面精美,使用方便,能用于个人作品首先,声明一点,这个控件是我从一套据说价值九百多美元的swing类包中提取出来,并加以修改的,所以:
一,你不能把该控件用于任何商业产品中。
二,该控件没有源代码。
(DatePicker.java除外,这个是我加进去的)
三,该控件可以用于你的个人作品中。
截图如下:
使用之前请把datepicker.jar导入classpath中
使用方法如下:
DatePicker datepick = new DatePicker();
或者
datepick = new DatePicker(date,DefaultFormat,font,dimension);//自定义参数值
//各参数含义如下
//参数1 设置该控件的初始值(可选)
//参数2 设置日期的格式(可选)
//参数3 设置该控件的字体(可选)
//参数3 设置该控件的大小(可选)
//该控件继承自JComponent ,它继承了Jcomponent的属性
datepick.setTimePanleVisible(true);//设置时钟面板可见
atepick.setHightlightdays(hilightDays, Color.red);//设置一个月份中需要高亮显示的日子
datepick.setDisableddays(disabledDays);//设置一个月份中不需要的日子,呈灰色显示。
KingviewPid控件使用方法-KVDBGrid控件使用方法

KingviewPid控件使用方法KingviewPid控件是组态王提供的用于对过程量进行闭环控制的专用控件。
通过该控件,用户可以方便的制作PID控制。
一、控件功能:1.实现pid控制算法:标准型2.显示过程变量的精确值,显示范围[-999999.99~999999.99]。
3.以百分比显示设定值(SP)、实际值(PV)和手动设定值(M)。
4.开发状态下可设置控件的总体属性、设定/反馈范围和参数设定。
5.运行状态下可设置PID参数和手动自动切换。
二、使用说明:1.在使用pid控件前,首先要注册此控件,注册方法是在Windows系统“开始\运行”输入如下命令“regsvr32 <控件所在路径>\KingviewPid.ocx”,按下“确定”按钮,系统会有注册信息弹出。
2.在画面中插入控件:组态王画面菜单中编辑\插入通用控件,或在工具箱中单击“插入通用控件”按钮,在弹出的对话框中选择“Kingview Pid Control”,单击确定。
3.按下鼠标左键,并拖动,在画面上绘制出表格区域。
图1 控件画面4.设置动画连接:双击控件或选择右键菜单中动画连接,在弹出的属性页中设置控件名称等信息(控件动画连接属性的具体设置请参见《组态王6.0使用手册》中控件一章)。
(1)、常规:图2 动画连接属性—常规设置控件名称、优先级和安全区(2)、属性类型关联对象:图3动画连接属性—属性5.设置控件属性:选择控件右键菜单中“控件属性”。
弹出控件固有属性页,可分别设置如下属性:(1)、总体属性:图4 总体属性控制周期:PID的控制周期,为大于100的整数。
且控制周期必须大于系统的采样周期。
反馈滤波:pv值在加入到PID调节器之前可以加入一个低通滤波器。
输出限幅:控制器的输出限幅。
(2)、设定/反馈变量范围:图5 设定/反馈变量范围输入变量:设定值sp对应的最大值(100%)和最小值(0%)的实际值。
输出变量:反馈值pv对应的最大值(100%)和最小值(0%)的实际值。
python tkinter columnconfigure函数使用及其参数详解

python tkinter columnconfigure函数使用及其参数详解1. 引言1.1 概述本篇文章将详细介绍python tkinter中的columnconfigure函数以及它的使用方法和参数解释。
Python tkinter是一个广泛使用的图形用户界面(GUI)库,它提供了丰富的功能和工具来创建各种类型的应用程序界面。
而布局管理器则是tkinter中用于控制组件在界面上的位置和大小的关键工具。
1.2 文章结构本文分为引言、正文、columnconfigure函数的功能和作用、具体参数详解与应用场景分析、结论等部分。
在正文部分,我们首先会简要介绍python tkinter 库以及如何使用它创建GUI界面。
接下来,我们将重点讨论布局管理器及其重要性,为后续对columnconfigure函数的理解做好铺垫。
1.3 目的本文旨在帮助读者全面理解python tkinter中columnconfigure函数的作用和使用方法,并提供具体参数详解与实际应用场景分析。
通过阅读本文,读者可以更有效地运用该函数来优化GUI界面布局,并从中获得实际应用方面的启示。
无论是初学者还是有一定经验的开发人员,都能从本文中收获一些有价值的知识和技能。
2. 正文:2.1 python tkinter简介Python tkinter是Python的标准GUI(图形用户界面)库,它提供了一组用于创建窗口、控件和布局的函数和类。
Tkinter是Python的一个包装器,它调用了一个名为Tk的图像化库。
使用Python tkinter,我们可以创建各种GUI应用程序。
2.2 使用python tkinter创建GUI界面在使用Python tkinter创建GUI界面之前,我们需要先导入tkinter模块。
例如:```import tkinter as tk```然后,我们可以通过实例化`Tk`类来创建一个窗口对象,并将其分配给变量。
MFC控件使用方法

MFC控件使用方法VC2012下MFC程序各控件的常用方法分类:vc控件2013-02-16 16:32 94人阅读评论(0) 收藏举报一下控件的用法全部在VC2012下调试通过,特发文收藏(部分内容来自或参考自网络):Static Text:将ID号改成唯一的一个,如:IDC_XX,然后进一次类向导点确定产生这个ID,之后更改Caption属性:GetDlgItem(IDC_XX)->SetWindowText(L"dsgdhfgdffd");设置字体:CFont *pFont= new CFont;pFont->CreatePointFont(120,_T("华文行楷"));GetDlgItem(IDC_XX)->SetFont(pFont);Edit Control:设置文本:SetDlgItemT ext(IDC_XX,L"iuewurebfdjf");获取所有输入:建立类向导创建一个成员变量(假设是shuru1,shuru2……)类型选value,变量类型任选。
UpdateData(true);GetDlgItem(IDC_XX)->SetWindowText(shuru1);第一句更新所有建立了变量的对话框组件,获取输入的值。
第二句将前面的IDC_XX的静态文本内容改为shuru1输入的内容。
若类型选用control:1.设置只读属性:shuru1.SetReadOnly(true);2.判断edit中光标状态并得到选中内容(richedit同样适用)int nStart,nEnd;CString strTemp;shuru1.GetSel(nStart,nEnd);if(nStart== nEnd){strTemp.Format(_T("光标在%d" ),nStart);AfxMessageBox(strTemp);}else{//得到edit选中的内容shuru1.GetWindowText(strTemp);strTemp= strTemp.Mid(nStart,nEnd-nStart);AfxMessageBox(strTemp);}其中nStart和nEnd分别表示光标的起始和终止位置,从0开始。
VBWebbrowser控件使用方法
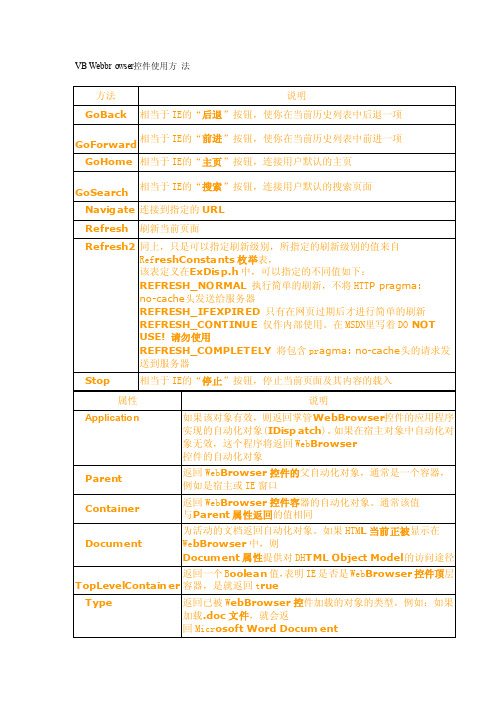
方法
说明
GoBack 相当于 IE的“后退”按钮,使你在当前历史列表中后退一项
GoForward 相当于 IE的“前进”按钮,使你在当前历史列表中前进一项 GoHome 相当于 IE的“主页”按钮,连接的“搜索”按钮,连接用户默认的搜索页面 Navigate 连接到指定的 URL
返回一个 Boolean 值,说明 WebBrowser 当前是否正在加 载URL,如果返回 true 就可以使用stop 方法来撤销正在执行的访问操作
WebBrowser 的事件
Priv ate Ev ents
Description
BeforeNavigate2
Private Sub Command2_Click() WebBrowser1.Document.parentwindow.scrollby 0, 30 End Sub
Private Sub Form _Load() WebBrowser1.Navigate "http://www.apple" End Sub
VB 调用 webbrowser 技巧集 4
1、如何使网页不出现滚动条:
Private Sub mnuSc roll1_Click() @#注意:必须在网页完全显示之后才可以运行 WebBrowser1.Document.body.Scroll = "no" @#不显示滚动条的办法 End Sub Private Sub mnuSc roll2_Click() @#注意:必须在网页完全显示之后才可以运行 WebBrowser1.Document.body.Scroll = "Auto" @#显示滚动条的办法 End Sub