大智慧分季度主要财务数据(更新至2014年年报)
思科公司2014年第一季度财务报告
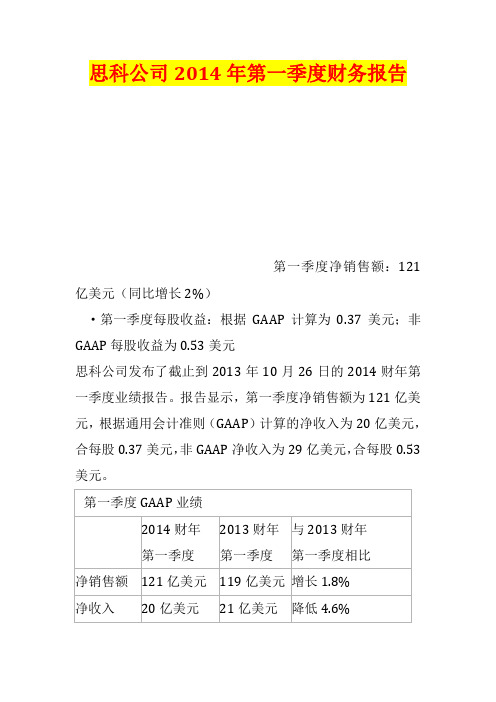
思科公司2014年第一季度财务报告第一季度净销售额:121亿美元(同比增长2%)·第一季度每股收益:根据GAAP计算为0.37美元;非GAAP每股收益为0.53美元思科公司发布了截止到2013年10月26日的2014财年第一季度业绩报告。
报告显示,第一季度净销售额为121亿美元,根据通用会计准则(GAAP)计算的净收入为20亿美元,合每股0.37美元,非GAAP净收入为29亿美元,合每股0.53美元。
2014财年第一季度的GAAP净收入包括与2013年8月宣布的人力缩减计划相关的2.37亿美元的税前收费所得,以及与因思科收购Insieme网络公司(简称Insieme)剩余股份而发生的补偿开支相关的2.57亿美元的税前收费所得。
这些收费没有包括在非GAAP净收入和每股收益中。
股票回购计划规模扩大思科还宣布,其董事会已授权将公司的股票回购计划规模扩大150亿美元。
思科董事会以前曾授权回购最多820亿美元的股票。
该回购计划没有最后期限。
该计划项目下剩余的授权股票回购数量(包括此次所增加的授权额度)大约为161亿美元。
其它业绩亮点·2014财年第一季度的运营现金流为26亿美元;相比之下,2013财年第四季度的运营现金流为40亿美元,2013财年第一季度的运营现金流为25亿美元。
·截至2014财年第一季度末,公司持有的现金、现金等价物和投资为482亿美元;相比之下,2013财年第四季度末为506亿美元。
·在2014财年第一季度,思科支付了每普通股0.17美元、总计9.14亿美元的现金红利。
·在2014财年第一季度,思科按照股票回购计划回购了大约8400万股普通股,平均每股回购价格为23.65美元,总回购价格为20亿美元。
“我们本季度实现了坚实的盈利结果,同时专注于我们的战略机会,”思科执行副总裁兼首席财务官Frank Calderoni 表示。
“我们对自己的资本分配战略是坚定不移的,今天宣布的使我们的股票回购计划授权额度增加150亿美元便证明了这一点。
阿里巴巴2014年第四季度财务报表
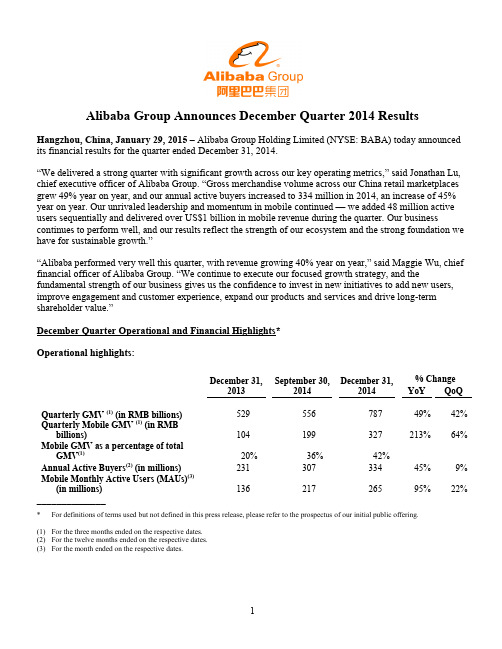
Alibaba Group Announces December Quarter 2014 Results Hangzhou, China, January 29, 2015– Alibaba Group Holding Limited (NYSE: BABA) today announced its financial results for the quarter ended December 31, 2014.“We delivered a strong quarter with significant growth across our key operating metrics,” said Jonathan Lu, chief executive officer of Alibaba Group. “Gross merchandise volume across our China re tail marketplaces grew 49% year on year, and our annual active buyers increased to 334 million in 2014, an increase of 45% year on year. Our unrivaled leadership and momentum in mobile continued — we added 48 million active users sequentially and delivered over US$1 billion in mobile revenue during the quarter. Our business continues to perform well, and our results reflect the strength of our ecosystem and the strong foundation we have for sustainable growth.”“Alibaba performed very well this quarter, with revenue growing 40% year on year,” said Maggie Wu, chief financial officer of Alibaba Group. “We continue to execute our focused growth strategy, and the fundamental strength of our business gives us the confidence to invest in new initiatives to add new users, improve engagement and customer experience, expand our products and services and drive long-term shareholder value.”December Quarter Operational and Financial Highlights*Operational highlights:December 31,2013 September 30,2014December 31,2014% ChangeYoY QoQQuarterly GMV (1) (in RMB billions)529 556 787 49% 42% Quarterly Mobile GMV (1) (in RMBbillions)104 199 327 213% 64% Mobile GMV as a percentage of totalGMV(1)20% 36% 42%Annual Active Buyers(2) (in millions)231 307 334 45% 9% Mobile Monthly Active Users (MAUs)(3)(in millions) 136 217 265 95% 22% ______________* For definitions of terms used but not defined in this press release, please refer to the prospectus of our initial public offering.(1)For the three months ended on the respective dates.(2)For the twelve months ended on the respective dates.(3)For the month ended on the respective dates.Financial highlights:Three months ended December 31,2013 2014RMB RMB US$⑤YoY % Change(in millions, except percentages and per shareamounts)Revenue18,745 26,179 4,219 40% Mobile Revenue 1,171 6,420 1,035 448% Income from Operations 8,801 9,347 1,506 6%Non-GAAP EBITDA⑤⑤11,246 15,103 2,434 34%Non-GAAP EBITDA Margin⑤⑤60% 58% 58%Net Income 8,357 5,983 964 (28%)⑤⑤⑤Non-GAAP Net Income⑤⑤10,463 13,115 2,114 25% Diluted Earnings per Share/ADS(EPS) 3.55 2.29 0.37 (35%)⑤⑤⑤Non-GAAP Diluted EPS⑤⑤ 4.45 5.05 0.81 13%_______________⑤This release contains translation of certain Renminbi (“RMB”) amounts into U.S. dollars (“US$”) for the convenience of the reader, unlessotherwise stated, all translations of RMB into US$ were made at RMB6.2046 to US$1.00, the exchange rate set forth in the H.10 statistical release of the Federal Reserve Board on December 31, 2014. The percentages stated in this release are calculated based on the RMB amounts.⑤⑤See the sections entitled “Non-GAAP Financial Measures” and “Reconciliati on of Non-GAAP Measures to the Nearest Comparable GAAPMeasures” for more information about the non-GAAP measures referred to within this release.⑤⑤⑤D ecrease primarily due to an increase in share-based compensation expense, a one-time charge for financing-related fees and an increase inincome tax expenses in the quarter ended December 31, 2014, as discussed in detail below.GMV –GMV transacted on our China retail marketplaces in the quarter ended December 31, 2014 wasRMB787 billion (US$127 billion), an increase of 49% compared to the same quarter of 2013, and compared to RMB556 billion in the quarter ended September 30, 2014, representing a net addition of RMB231 billion GMV in three months. GMV transacted on Taobao Marketplace in the quarter ended December 31, 2014 was RMB494 billion (US$80 billion), an increase of 43% compared to the same quarter of 2013. GMV transacted on Tmall in the quarter ended December 31, 2014 was RMB293 billion (US$47 billion), an increase of 60% compared to the same quarter of 2013. The GMV growth was primarily driven by an increase in the number of active buyers and also partially attributable to category expansion, for example, auction transactions. On November 11, 2014, our Singles Day promotion generated GMV settled through Alipay of RMB57 billion (US$9.2 billion) on our China and international retail marketplaces within a 24-hour period, an increase of 58% compared to the Singles Day in 2013.Mobile GMV –Mobile GMV in the quarter ended December 31, 2014 was RMB327 billion (US$53 billion), an increase of 213% compared to the same quarter of 2013. Mobile GMV accounted for 42% of total GMV transacted on our China retail marketplaces in this quarter, compared to 36% in the quarter ended September 30, 2014 and 20% in the same quarter of 2013. The growth was primarily driven by an increase in the monthly active users accessing our platforms through mobile devices and an increase in the level of their spending.Annual active buyers–Our China retail marketplaces had 334 million annual active buyers in the twelve months ended December 31, 2014, compared to 307 million in the twelve months ended September 30, 2014 and 231 million in the twelve months ended December 31, 2013, representing an increase of 45% compared to the same period in 2013. The growth in annual active buyers was driven by an increase in active buyers throughout China, with substantially faster growth from lower tier cities.Mobile MAUs–Mobile MAUs grew to 265 million in the month ended December 31, 2014, compared to 217 million in the month ended September 30, 2014, representing a record high net addition of 48 million MAUs in three months, and a 95% increase from 136 million in the month ended December 31, 2013. According to iResearch, our Mobile Taobao App continues to be the No. 1 e-commerce app in China, demonstrating our ability to attract mobile users with strong purchasing intent on a large scale.Revenue–Revenue increased by 40% to RMB26,179 million (US$4,219 million) in the quarter ended December 31, 2014, compared to RMB18,745 million in the same quarter of 2013. Revenue from the China commerce retail business increased by 32% to RMB21,275 million (US$3,429 million), compared toRMB16,149 million in the same quarter of 2013, mainly driven by the growth in commission revenue and online marketing services revenue. Mobile revenue from the China commerce retail business increased by 448% to RMB6,420 million (US$1,035 million) in the quarter ended December 31, 2014, compared to RMB1,171 million in the same quarter of 2013, primarily due to a greater proportion of GMV generated on mobile devices and an increase in the mobile monetization rate.Income from operations – Income from operations in the quarter ended December 31, 2014 was RMB9,347 million (US$1,506 million), an increase of 6% compared to RMB8,801 million in the same quarter of 2013. Operating income growth was lower than revenue growth primarily due to an increase in share-based compensation expense (as discussed in “Share-based compensation expense” below).Non-GAAP EBITDA–Non-GAAP EBITDA increased by 34% to RMB15,103 million (US$2,434 million) in the quarter ended December 31, 2014, compared to RMB11,246 million in the same quarter of 2013. Non-GAAP EBITDA margin was 58% in the quarter ended December 31, 2014, compared to 60% in the December quarter of 2013. The year-on-year decrease in non-GAAP EBITDA margin was primarily due to the consolidation of newly acquired businesses, mainly UCWeb Inc., or UCWeb, and AutoNavi Holding Limited, or AutoNavi, and investments in new business initiatives, such as our mobile operating system, local services and digital entertainment. The quarter-on-quarter increase in non-GAAP EBITDA margin from 51% in the quarter ended September 30, 2014 was primarily due to operating leverage in this seasonally strong quarter.Net income –Our net income in the quarter ended December 31, 2014 was RMB5,983 million (US$964 million), a decrease of 28% compared to RMB8,357 million in the same quarter of 2013. The decrease was primarily due to (i) an increase in share-based compensation expense (including the effect of “mark-to-market” accounting of share-based awards in an amount of RMB1,494 million (US$241 million)) (as discussed in “Share-based compensation expense” below), (ii) an RMB830 million (US$134 million) one-time charge for financing-related fees as a result of the early repayment of our US$8 billion bank borrowings (as discussed in “Interest expense” below), and (iii) an increase in income tax expenses, primarily due to the expiration of an enterprise income tax (“EIT”) exemption period for one of our major subsidiaries (as discussed in “Income tax expenses” below).Non-GAAP net income–Non-GAAP net income increased by 25% to RMB13,115 million (US$2,114 million) in the quarter ended December 31, 2014, compared to RMB10,463 million in the same quarter of 2013.Diluted EPS and non-GAAP diluted EPS –Diluted EPS in the quarter ended December 31, 2014 was RMB2.29 (US$0.37) on 2,588 million diluted shares outstanding, a decrease of 35% compared to RMB3.55 on 2,343 million diluted shares outstanding in the same quarter of 2013. Non-GAAP diluted EPS in the quarter ended December 31, 2014 was RMB5.05 (US$0.81) on 2,588 million diluted shares outstanding, an increase of 13% compared to RMB4.45 on 2,343 million diluted shares outstanding in the same quarter of 2013. The lower non-GAAP diluted EPS growth rate relative to non-GAAP net income growth rate was due to an increase in number of diluted shares outstanding in the quarter ended December 31, 2014 following the completion of our initial public offering in September 2014.December Quarter Financial ResultsRevenue –Revenue for the quarter ended December 31, 2014 was RMB26,179 million (US$4,219 million), an increase of 40% compared to RMB18,745 million in the same quarter of 2013. The increase was mainly driven by the continuing rapid growth of our China commerce retail business. The following table sets forth a breakdown of our revenue for the periods indicated.Three months ended December 31,2013 2014RMB% ofRevenue RMB US$% ofRevenueYoYChange (in millions, except percentages)China commerceRetail 16,149 86% 21,275 3,429 82% 32% Wholesale 612 3% 860 139 3% 41% Total China commerce 16,761 89% 22,135 3,568 85% 32% International commerceRetail 264 2% 554 89 2% 110% Wholesale 1,000 5% 1,209 195 5% 21% Total international commerce 1,264 7% 1,763 284 7% 39% Cloud computing and Internetinfrastructure 196 1% 362 58 1% 85% Others 524 3% 1,919 309 7% 266% Total 18,745 100% 26,179 4,219 100% 40% China commerce retail business –Revenue from our China commerce retail business in the quarter ended December 31, 2014 was RMB21,275 million (US$3,429 million), or 82% of total revenue, an increase of 32% compared to RMB16,149 million in the same quarter of 2013. The increase was mainly driven by the growth in commission revenue and online marketing services revenue. Commissionrevenue accounted for 37% of China commerce retail revenue in the quarter ended December 31, 2014, compared to 30% in the same quarter of 2013. Revenue growth during this period occurred in the context of and reflected an increase of 49% in GMV transacted on our China retail marketplaces, which was primarily driven by a 45% increase in the number of active buyers.The lower revenue growth relative to GMV growth was mainly a result of (i) the higher percentage of total GMV contributed by mobile GMV, which has a lower monetization rate compared to the non-mobile monetization rate, and (ii) lower pay-for-performance (“P4P”) monetization on the personal computer (“PC”) interface compared to the same quarter of 2013. The lower P4P monetization on PC was primarily caused by our continued efforts to improve user experience, which adversely affected cost per click. Our strong momentum in mobile and commitment to improving user experience may slow the growth rate of our online marketing services revenue in the near term, but we believe they will create significant value for both our users and our business in the longer term.Mobile revenue from the China commerce retail business in the quarter ended December 31, 2014 was RMB6,420 million (US$1,035 million), an increase of 448% compared to RMB1,171 million in the same quarter of 2013, representing 30% of our China commerce retail business revenue, compared to 29% in the quarter ended September 30, 2014 and 7% in the same quarter of 2013. The increase in mobilerevenue from the China commerce retail business was primarily due to a greater proportion of GMV generated on mobile devices and an increase in the mobile monetization rate.∙China commerce wholesale business –Revenue from our China commerce wholesale business in the quarter ended December 31, 2014 was RMB860 million (US$139 million), an increase of 41% compared to RMB612 million in the same quarter of 2013. The increase was due to an increase in average revenue from paying members and an increase in paying members.∙International commerce retail business –Revenue from our international commerce retail business in the quarter ended December 31, 2014 was RMB554 million (US$89 million), an increase of 110%compared to RMB264 million in the same quarter of 2013. The increase was primarily due to an increase in GMV transacted on AliExpress, partially attributable to AliExpress’ participation in our Singles Day promotion campaign on November 11, 2014 for the first time.∙International commerce wholesale business –Revenue from our international commerce wholesale business in the quarter ended December 31, 2014 was RMB1,209 million (US$195 million), an increase of 21% compared to RMB1,000 million in the same quarter of 2013. The main reason for this increase was an increase in the number of paying members and an increase in average revenue from payingmembers.∙Others –Other revenue in the quarter ended December 31, 2014 was RMB1,919 million (US$309 million), an increase of 266% compared to RMB524 million in the same quarter of 2013. This increase was primarily due to the consolidation of revenue from acquired business (mainly UCWeb and AutoNavi) and an increase in interest income generated by our SME loan business. When the restructuring of our relationship with Ant Financial closes, which we expect in the March 2015 quarter, we will no longer consolidate revenue generated by the SME loan business in our financial results.Cost of revenue –Cost of revenue in the quarter ended December 31, 2014 was RMB7,520 million(US$1,212 million), or 29% of revenue, compared to RMB4,171 million, or 22% of revenue, in the same quarter of 2013. The increase was primarily due to an increase in share-based compensation expense (as discussed in “Share-based compensation expense” below), an increase in costs associated with our new businesses initiatives, and an increase in payment processing fees resulting from an increase in GMV transacted on our retail marketplaces.Product development expenses – Product development expenses in the quarter ended December 31, 2014 were RMB3,083 million (US$497 million), or 12% of revenue, compared to RMB1,707 million, or 9% of revenue in the same quarter of 2013. The increase was primarily due to an increase in share-based compensation expense (as discussed in “Share-based compensation expense” below). The increase was partially offset by the decrease in royalty fees paid to Yahoo which terminated upon completion of our initial public offering in September 2014.Sales and marketing expenses –Sales and marketing expenses in the quarter ended December 31, 2014 were RMB3,021 million (US$487 million), or 12% of revenue, compared to RMB1,897 million, or 10% of revenue in the same quarter of 2013. The increase was primarily due to an increase in share-based compensation expense (as discussed in “Share-based compensation expense” below). The increase was alsodue to the consolidation of marketing expenses of acquired business (mainly UCWeb and AutoNavi), an increase in advertising and promotional spending mainly to strengthen marketing of our Taobao and Tmall brands, especially in lower tier cities, as well as to promote our new businesses initiatives (e.g., local services) during this quarter.General and administrative expenses – General and administrative expenses in the quarter ended December 31, 2014 were RMB2,419 million (US$390 million), or 9 % of revenue, compared to RMB2,046 million, or 11% of revenue in the same quarter of 2013. The decrease in general and administrative expenses as a percentage of revenue was primarily due to a one-time equity-settled donation expense of RMB1,269 million made in the quarter ended December 31, 2013 relating to the grant of options to purchase 50,000,000 of our ordinary shares to a non-profit organization, which was partially offset by an increase in share-based compensation expense in the quarter ended December 31, 2014 (as discussed in “Share-based compensation expense” below).Share-based compensation expense – Share-based compensation expense included in respective cost or expense items above in the quarter ended December 31, 2014 was RMB4,313 million (US$695 million), or 16% of revenue, an increase of 554% compared to RMB659 million, or 4% of revenue, in the same quarterof 2013. The increase was primarily caused by (1) performance-based and retention grants of share-based awards granted prior to our initial public offering in 2014, with vesting periods of four years for our employees and six years for senior management, (2) the “mark-to-market” accounting of (i) share-based awards we granted to the employees of Zhejiang Ant Small and Micro Financial Services Company Ltd., or Ant Financial, and (ii) Ant Financial’s share-based awards granted by a major shareholding entity of Ant Financial controlled by Jack Ma, our executive chairman, to our employees. The expense arising from such Ant Financial share-based awards granted to our employees represents a non-cash accounting charge to us that will not result in any equity dilution to our shareholders. Without the effect of such “mark-to-market” accounting, our share-based compensation expense would have been RMB2,819 million (US$454 million) in the quarter ended December 31, 2014, compared to RMB2,233 million in the quarter ended September 30, 2014. Pursuant to generally accepted accounting principles in the United States, we are required to perform such re-measurement at each period end. Accordingly, we expect that our share-based compensation expense will continue to be affected by changes in the fair value of our share-based awards as well as the fair value of Ant Financial’s share-based awards granted to our employees.Amortization of intangible assets – Amortization of intangible assets in the quarter ended December 31, 2014 was RMB614 million (US$99 million), a significant increase from RMB123 million in the same quarter of 2013. This increase was due to an increase in intangibles assets primarily as a result of our strategic acquisitions, mainly UCWeb and AutoNavi.Income from operations – Income from operations in the quarter ended December 31, 2014 was RMB9,347 million (US$1,506 million), an increase of 6% compared to RMB8,801 million in the same quarter of 2013. The lower growth of operating income relative to revenue growth in this quarter and the decrease in operating margin to 36% in the quarter ended December 31, 2014 from 47% in the same quarter of 2013 were primarily due to an increase in share-based compensation expense (as discussed in “Share-based compensation expense” above).Non-GAAP EBITDA – Non-GAAP EBITDA increased by 34% to RMB15,103 million (US$2,434 million) in the quarter ended December 31, 2014, compared to RMB11,246 million in the same quarter of 2013.Non-GAAP EBITDA margin was 58% in the quarter ended December 31, 2014, compared to 60% in the December quarter of 2013. The year-on-year decrease in non-GAAP EBITDA margin was primarily due to the consolidation of newly acquired businesses, mainly UCWeb and AutoNavi, and investments in new business initiatives, such as our mobile operating system, local services and digital entertainment. Thequarter-on-quarter increase in non-GAAP EBITDA margin from 51% in the quarter ended September 30, 2014 was primarily due to operating leverage in this seasonally strong quarter. A reconciliation of operating income to non-GAAP EBITDA is included at the end of this release.Interest and investment income, net – Interest and investment income, net in the quarter ended December 31, 2014 was RMB313 million (US$51 million), an increase of 6% compared to RMB296 million in the same quarter of 2013. The increase was primarily due to an increase in interest income as a result of higher cash balance during the period, which in turn was primarily due to the proceeds from our initial public offering in September 2014 and an increase in operating cash flow. This increase was partially offset by an increase in impairment charge of cost-method investments and losses recognized with respect to the periodic revaluation of convertible bonds we held in connection with our strategic investments in publicly traded entities.Interest expense –Interest expense in the quarter ended December 31, 2014 was RMB1,344 million(US$216 million), an increase of 247% compared to RMB387 million in the same quarter of 2013. The increase was primarily due to an RMB830 million (US$134 million) one-time charge for financing-related fees as a result of the early repayment of our US$8 billion bank borrowings with proceeds from our issuance of US$8 billion senior unsecured notes in this quarter.Other income, net –Other income, net in the quarter ended December 31, 2014 was RMB901 million (US$145 million), an increase of 64% compared to RMB548 million in the same quarter of 2013. The increase was primarily due to an increase of RMB101 million (US$16 million) in royalty fees and software technology service fees received from Ant Financial to RMB344 million (US$55 million) in the quarter ended December 31, 2014 from RMB243 million in the same quarter of 2013 as a result of an increase in pre-tax income of Ant Financial, as well as an increase in government grants received from central and local governments in connection with our contribution to technology development and investments in local business districts.Income tax expenses – Income tax expenses in the quarter ended December 31, 2014 were RMB2,429 million (US$392 million), an increase of 228% compared to RMB741 million in the same quarter of 2013. The increase was primarily due to the increase in taxable income from our operations in China. Our effective tax rate increased to 26% in the quarter ended December 31, 2014 from 8% in the same quarter of 2013. Excluding share-based compensation expense, impairment of goodwill, intangible assets and investments, and unrealized gain/loss on investments which are not deductible or assessable for income tax purposes, our effective tax rate would have been 17% in the quarter ended December 31, 2014, compared to 7% in the same quarter of 2013. The increase was primarily due to the expiration of an EIT exemption period for one of our major subsidiaries, upon which the subsidiary became subject to an EIT rate of 12.5% (or 50% of the statutory EIT rate) in calendar year 2014.Net income and non-GAAP net income –As a result of the foregoing, our net income in the quarter ended December 31, 2014 was RMB5,983 million (US$964 million), a decrease of 28% compared to RMB8,357 million in the same quarter of 2013. Excluding the effects of share-based compensation expense, impairment of goodwill and investment in equity investees, the one-time charge for financing-related fees, amortization of intangible assets and certain other items, non-GAAP net income in the quarter ended December 31, 2014 was RMB13,115 million (US$2,114 million), an increase of 25% compared to RMB10,463 million in the same quarter of 2013. A reconciliation of net income to non-GAAP net income is included at the end of this release.Net income attributable to ordinary shareholders – Net income attributable to ordinary shareholders in the quarter ended December 31, 2014 was RMB5,936 million (US$957million), a decrease of 28% compared to RMB8,266 million in the same quarter of 2013.Diluted EPS and non-GAAP diluted EPS –Diluted EPS in the quarter ended December 31, 2014 was RMB2.29 (US$0.37) on 2,588 million diluted shares outstanding, a decrease of 35% compared to RMB3.55 on 2,343 million diluted shares outstanding in the same quarter of 2013. Excluding the effects of share-based compensation expense, impairment of goodwill and investment in equity investees, the one-time charge for financing-related fees, amortization of intangible assets and certain other items, non-GAAP diluted EPS in the quarter ended December 31, 2014 was RMB5.05 (US$0.81), an increase of 13% compared to RMB4.45 in the same quarter of 2013. The lower non-GAAP diluted EPS relative to non-GAAP net income growth rate was due to an increase in the number of diluted shares outstanding in the quarter ended December 31, 2014 following the completion of our initial public offering. A reconciliation of diluted EPS to the non-GAAP diluted EPS is included at the end of this release.Cash –As of December 31, 2014, cash, cash equivalents and short-term investments were RMB130,741 million (US$21,071 million), compared to RMB43,632 million as of March 31, 2014.Cash flow from operating activities and free cash flow – Net cash provided by operating activities in the quarter ended December 31, 2014 was RMB19,408 million (US$3,128 million), an increase of 30% compared to RMB14,922 million in the same quarter of 2013. Capital expenditures in the quarter ended December 31, 2014 were RMB1,513 million (US$244 million), compared to RMB1,601 million in the same quarter of 2013. Capital expenditures in the quarter ended December 31, 2014 included cash outflow for acquisition of land use rights and construction in progress of RMB291 million (US$47 million). Free cash flow, a non-GAAP measurement of liquidity, in the quarter ended December 31, 2014 was RMB22,924 million (US$3,695 million), an increase of 34% compared to RMB17,163 million in the same quarter of 2013. A reconciliation of net cash provided by operating activities to free cash flow, a non-GAAP measure of liquidity, is included at the end of this release.Net cash used in investing activities – During the quarter ended December 31, 2014, net cash used in investing activities of RMB4,817 million (US$776 million) mainly included disbursements for short-term investments of RMB1,944 million (US$313 million), capital expenditure of RMB1,513 million (US$244 million) as well as investment and acquisition activities of RMB2,657 million (US$428 million) primarily in mobile and logistics related businesses.Employee number – As of December 31, 2014, we had a total of 34,081 employees, compared to 33,239 as of September 30, 2014 and 20,884 as of December 31, 2013.Webcast and Conference Call InformationA live webcast of the earnings conference call, which will be held shortly following the release of this announcement, can be accessed at /en/ir/earnings. An archived webcast will be available through the same link following the call. A replay of the conference call will be available for one week (dial-in number: +1 646-254-3697; conference ID: 65377381).Please visit Alibaba Group’s Investor Relations website at /en/ir/home on January 29, 2015 to view the earnings release and accompanying slides prior to the conference call.About Alibaba Group。
腾讯2014年报表

2014 年第四季度其它主要财务信息
本季度股份报酬开支为人民币 6.44 亿元,较去年同期上升 39%。 EBITDA 为人民币 79.29 亿元, 较去年同期上升 53%。 经调整的 EBITDA 为人民币 84.24 亿元, 较去年同期上升 54%。 资本开支为人民币 16.03 亿元,较去年同期下降 5%。 自由现金流为人民币 91.81 亿元,较去年同期上升 76%。
腾讯主席兼首席执行官马化腾表示: “2014 年,我们在一系列巩固我们领先地位、提高我们竞争力的战略举措中 取得了显著的进步。我们的社交平台 QQ 和微信实现了持续创新和增长。通过利用我们在移动互联网领域的专业洞 见,我们拓展了在游戏和网络媒体方面的领导地位,并在包括网络安全、安卓应用商店、移动支付等新兴领域实 现了突破。我们实行了连接的策略,将我们庞大的用户群与合适的内容、服务连接在一起,同时也通过投资和商 业合作与大量垂直领域的领先合作伙伴建立了战略合作关系。我们相信通过这个战略,我们能为用户提供一流的 体验,同时随着移动互联网在用户日常生活的进一步渗透,参与到垂直领域的增长中来。 ”
2014 年第四季度财务分析
增值服务。本公司增值服务业务的收入较 2013 年第四季增长 44%至 2014 年第四季的人民币 171.37 亿元。网络游 戏收入增长 41%至人民币 119.64 亿元。该项增加主要受 QQ 手机版及微信上智能手机游戏收入大幅增长所推动, 主要反映我们的用户群扩大、游戏组合更加丰富的影响及采用总额确认收入的较小程度的影响。PC 游戏收入亦有 所增加。社交网络收入增长 50%至人民币 51.73 亿元。该项增加主要受移动平台游戏内按条销售额增加以及我们 从 QQ 会员、超级会员、QQ 空间及数字内容订购服务所得的订购收入所推动。倘于 2013 年第四季智能手机游戏收 入采用总额确认, 则于 2014 年第四季我们增值服务业务、 网络游戏及社交网络的收入将分别增长 42%、 39%及 48%。 网络广告。本公司网络广告业务的收入较 2013 年第四季增长 75%至 2014 年第四季的人民币 26.27 亿元。该项增 加主要反映受观看用户数增加使得视频广告收入增长以及由于 QQ 空间手机版及微信公众账号所推动, 令移动社交 网络效果广告收入增加。 电子商务交易。本公司电子商务交易业务的收入较 2013 年第四季下降 87%至 2014 年第四季的人民币 4.46 亿元。 该项减少主要反映于 2014 年 3 月我们与京东进行战略合作后将流量转移至京东, 以及我们的易迅业务由自营重新 定位为交易平台,导致电子商务自营业务的收入下滑。
2014年一季末牛散持股 大智慧统计
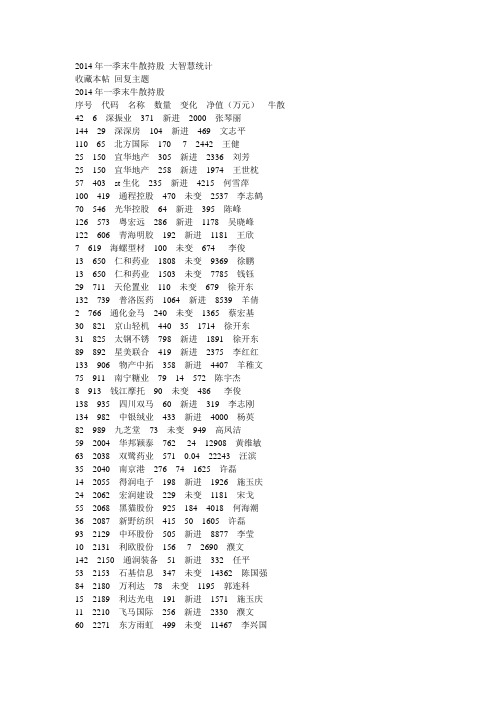
2014年一季末牛散持股大智慧统计收藏本帖回复主题2014年一季末牛散持股序号代码名称数量变化净值(万元)牛散42 6 深振业371 新进2000 张琴丽144 29 深深房104 新进469 文志平110 65 北方国际170 -7 2442 王健25 150 宜华地产305 新进2336 刘芳25 150 宜华地产258 新进1974 王世枕57 403 st生化235 新进4215 何雪萍100 419 通程控股470 未变2537 李志鹤70 546 光华控股64 新进395 陈峰126 573 粤宏远286 新进1178 吴晓峰122 606 青海明胶192 新进1181 王欣7 619 海螺型材100 未变674 李俊13 650 仁和药业1808 未变9369 徐鹏13 650 仁和药业1503 未变7785 钱钰29 711 天伦置业110 未变679 徐开东132 739 普洛医药1064 新进8539 羊倩2 766 通化金马240 未变1365 蔡宏基30 821 京山轻机440 35 1714 徐开东31 825 太钢不锈798 新进1891 徐开东89 892 星美联合419 新进2375 李红红133 906 物产中拓358 新进4407 羊稚文75 911 南宁糖业79 14 572 陈宇杰8 913 钱江摩托90 未变486 李俊138 935 四川双马60 新进319 李志刚134 982 中银绒业433 新进4000 杨英82 989 九芝堂73 未变949 高凤洁59 2004 华邦颖泰762 -24 12908 黄维敏63 2038 双鹭药业571 0.04 22243 汪滨35 2040 南京港276 74 1625 许磊14 2055 得润电子198 新进1926 施玉庆24 2062 宏润建设229 未变1181 宋戈55 2068 黑猫股份925 184 4018 何海潮36 2087 新野纺织415 50 1605 许磊93 2129 中环股份505 新进8877 李莹10 2131 利欧股份156 -7 2690 濮文142 2150 通润装备51 新进332 任平53 2153 石基信息347 未变14362 陈国强84 2180 万利达78 未变1195 郭连科15 2189 利达光电191 新进1571 施玉庆11 2210 飞马国际256 新进2330 濮文60 2271 东方雨虹499 未变11467 李兴国26 2289 宇顺电子164 新进2704 王世枕26 2289 宇顺电子152 新进2510 高春雷3 2327 富安娜315.96 新进4417 蔡宏基135 2332 仙琚制药333 新进4604 杨英17 2371 七星电子493 新进8886 施玉庆66 2414 高德红外162 新进2726 蔡运琴90 2432 九安医疗466 新进10647 李若璟18 2452 长高集团110 新进1799 施玉庆112 2464 金利科技24 新进356 王静116 2555 顺荣股份100 23 4053 王麟杰91 2556 辉隆股份743 新进6760 李若璟12 2574 明牌珠宝104 -234 2381 濮文19 2579 中京电子152 新进1352 施玉庆123 2579 中京电子79 新进705 王泽136 2579 中京电子148 53 1321 张成124 2590 万安科技90 新进1288 王泽97 2594 比亚迪1082 未变52077 李永光4 2602 世纪华通110 新进2013 蔡宏基103 2617 露笑科技94 新进1411 汤子花128 2617 露笑科技107 新进1596 肖贵清101 2630 华西能源199 新进5994 龙己连45 2660 茂硕电源200 未变2000 赵建平125 2669 康达新材37 新进693 王泽37 2677 浙江美大51 新进613 许磊83 2681 奋达科技149 未变6395 高凤洁94 2681 奋达科技23 未变993 李莹38 2685 华东重机131 69 1243 许磊39 2689 博林特433 198 3088 许磊46 2693 双成药业202 新进2798 赵建平102 2712 思美传媒31 新进1395 苏红86 2716 金贵银业18 新进374 冀晓斌32 300029 天龙光电180 未变1785 徐开东47 300030 阳普医疗190 未变4761 赵建平47 300030 阳普医疗229 -5 5751 高春雷58 300032 金龙机电350 新进4480 何雪萍72 300052 中青宝51 未变1506 陈小敏73 300053 欧比特74 未变813 陈小敏119 300053 欧比特102 6 1111 王涛105 300056 三维丝26 新进693 王必兴9 300130 新国都108 未变2689 李俊61 300139 福星晓程66 新进1445 刘芳115 300140 启源装备50 新进795 王敏127 300153 科泰电源130 新进1317 夏期长48 300177 中海达200 10 5900 赵建平33 300185 通裕重工733 33 3072 徐开东49 300188 美亚柏科110 30 1881 赵建平50 300201 海伦哲400 -100 2048 赵建平140 300204 舒泰神32 新进731 吕鸿标92 300210 森远股份260 新进5317 李卫萍137 300216 千山药机219 未变2622 张成67 300235 方直科技63.76 未变1555 常鑫民129 300235 方直科技78 -2 1907 肖小平20 300238 冠昊生物120 新进4901 施玉庆51 300244 迪安诊断100 未变7680 赵建平141 300256 星星科技71 未变938 潘毓文52 300260 新莱应材20 新进273 赵建平111 300281 金明精机47 未变559 王健130 300290 荣科科技82 -7 1420 肖小平21 300294 博雅生物64 新进2739 施玉庆145 300304 云意电气21 8 572 徐征宏139 300314 戴维医疗25 新进515 李志刚22 300318 博晖创新214 新进3666 施玉庆143 300319 麦捷科技32 新进735 王越74 300327 中颖电子56.8 新进847 陈小敏23 300368 汇金股份43 新进1718 施玉庆43 300369 绿盟科技93 新进7865 张琴丽131 600023 浙能电力574 新进3569 徐勤珍27 600084 中葡股份479 未变1932 徐开东56 600099 林海股份170 新进940 何雪萍108 600113 浙江东日165 -9 1409 王洪亮40 600139 西部资源516 20 4205 杨建民109 600139 西部资源296 未变2412 王健95 600158 中体产业387 -73 3262 李永光41 600260 凯乐科技214 -116 1446 杨建民62 600352 浙江龙盛2231 未变36290 潘小成96 600368 五洲交通308 新进1238 李永光5 600370 三房巷103 新进512 李俊54 600410 华胜天成1074 未变8432 富淑梅65 600436 片仔癀150 -100 11248 吴揆34 600483 福建南纺300 54 2073 许磊106 600487 亨通光电127 46 2631 王敢64 600521 华海药业1086 未变12968 翁震宇113 600538 北海国发151 新进749 王敏81 600589 广东榕泰175 -5 882 高凤洁77 600602 仪电电子724 -165 4846 房庄婷71 600604 市北高新124 11 1195 陈小敏114 600606 金丰投机92 新进817 王敏117 600606 金丰投资115 14 1023 王涛120 600647 同达创业68 -2 848 王欣79 600653 申华控股628 224 1659 高春雷68 600665 天地源189 新进632 陈峰99 600704 物产中大430 新进3567 李志鹤88 600710 常林股份293 新进909 李鼎兴107 600716 凤凰股份355 20 3355 王瀚康6 600722 金牛化工301 新进1375 李俊76 600748 上实发展216 新进1565 方伟清98 600767 运盛实业302 -3 2288 李运峰87 600770 综艺股份1045 36 9561 蒋立君87 600770 综艺股份1009 299 9232 蒋文丞1 600771 广誉远151.95 新进3523 蔡宏基118 600791 京能置业287 新进1507 王涛121 600871 ST仪化213 12 624 王欣44 600980 北矿磁材150 未变1920 赵建平69 600984 建设机械70 新进385 陈峰85 601010 文峰股份186 63 1289 冀晓斌28 601866 中海集运900 35 1925 徐开东80 603005 晶方科技48 新进1507 高春雷78 603555 贵人鸟27 新进324 房庄婷146 600051 宁波联合244 未变1828 张国建。
腾讯公布2014年第四季度及全年业绩
腾讯公布2014年第四季度及全年业绩香港,2015年3月18日–中国领先的互联网综合服务提供商–腾讯控股有限公司(“腾讯”或“本公司”,香港联交所股票编号: 00700) 今天公布截至 2014 年 12 月 31 日未经审核的第四季度综合业绩及经审核的全年综合业绩。
2014年全年业绩摘要:§总收入为人民币789.32亿元(128.99亿美元[1]),比去年同期增长31%。
§经营盈利为人民币305.42亿元(49.91亿美元),比去年同期增长59%;经营利润率由去年同期的32%升至39%。
§期内盈利为人民币238.88亿元(39.04亿美元),比去年同期增长53%;净利率由去年同期的26%升至30%。
§本公司权益持有人应占盈利为人民币238.10亿元(38.91亿美元),比去年同期增长54%。
§每股基本盈利2为人民币2.579元,每股摊薄盈利2为人民币2.545元。
§董事会建议就截至2014年12月31日止年度派发末期股息每股0.36港元(2013年:拆股前每股1.20港元,或拆股后每股0.24港元)。
此建议须待股东批准后,方可作实。
§按非通用会计准则3(撇除股份酬金、视同处置收益、无形资产摊销及减值拨备):-经营盈利为人民币304.97亿元(49.84亿美元),比去年同期增长49%;经营利润率由去年同期的34%升至39%。
-期内盈利为人民币244.20亿元(39.91亿美元),比去年同期增长42%;净利率由去年同期的28%升至31%。
-本公司权益持有人应占盈利为人民币242.24亿元(39.59亿美元),比去年同期增长43%。
-每股基本盈利为人民币2.624元,每股摊薄盈利为人民币2.589元。
2014年第四季度业绩摘要:§总收入为人民币209.78亿元(34.28亿美元),比去年同期增长24%。
§经营盈利为人民币73.94亿元(12.08亿美元),比去年同期增长56%。
2012-2014年1季度全国计算机、通信和其他电子设备制造业行业经营状况分析季报

5.69
数据来源:中国产业洞察网,2014年
图表10:2012年1季度-2014年1季度全国计算机、通信和其他电子设备制造业行业偿债能力趋势分析(%、倍)
数据来源:中国产业洞察网,2014年
如果您需要针对该行业更加全面的数据及研究报告,我们还可以为您提供:
(1)产业政策研究
(2)产业链及产业生命周期研究
图表7:2012年1季度-2014年1季度全国计算机、通信和其他电子设备制造业行业营运能力指标(次)
报告期
应收账款周转率
(次)
总资产周转率
(次)
流动资产周转率
(次)
2014年1季度
——
——
——
2013年4季度
6.30
1.60
——
2013年3季度
4.60
1.20
——
2013年2季度
3.20
0.80
——
(3)行业产销规模
(4)行业细分市场分析
(5)行业发展预测及趋势分析
(6)行业竞争格局研究分析
(7)行业内标杆企业研究
(8)行业发展机遇及挑战
联系方式:网址:
电话:400 088 5338 /010-6489 6485/010-6489 6481
机构简介:
中国产业洞察网创立于2005年,总部设在北京。目前拥有专职研究人员50多人,拥有分布在全国200多个城市的负责产业数据监测及研究工作的合作伙伴1200多人,专注于细分产业研究。累积服务过千余家国内外知名企业及机构,在1000多个细分产业领域拥有丰富的多年数据库基础及广泛的数据/信息调研渠道。
2013年2季度
3.37%
9.73%
3.48%
大智慧PFFIN(X,N)函数及应用(专业财务数据)

大智慧PFFIN(X,N)函数及应用(专业财务数据)大智慧PEFIN(X,N)函数及应用(专业财务数据)PFFIN(N,M) 表示取得M个报告期之前的第N号专业财务数据,例如PROFFIN(3001,0)表示最近一期总股本每股指标1001 摊薄每股收益1002 净资产收益率1003 每股经营活动现金流量1004 每股净资产1005 每股资本公积金1006 每股未分配利润1007 每股主营收入1008 扣除非经常损益每股收益资产负债表1051 货币资金1052 交易性金融资产1053 应收票据1054 应收账款1055 预付款项1056 应收利息1057 应收股利1058 其他应收款1059 应收关联公司款1060 存货1061 其中:消耗性生物资产1062 一年内到期的非流动资产1063 其他流动资产1064 流动资产合计1065 可供出售金融资产1066 持有至到期投资1067 长期应收款1068 长期股权投资1069 投资性房地产1070 固定资产1071 在建工程1072 工程物资1073 固定资产清理1074 生产性生物资产1075 油气资产1076 无形资产1077 开发支出1078 商誉1079 长期待摊费用1080 递延所得税资产1081 其他非流动资产1082 非流动资产合计1083 资产总计1084 短期借款1085 交易性金融负债1086 应付票据1087 应付账款1088 预收账款1089 应付职工薪酬1090 应交税费1091 应付利息1092 应付股利1093 其他应付款1094 应付关联公司款1095 一年内到期的非流动负债1096 其他流动负债1097 流动负债合计1098 长期借款1099 应付债券1100 长期应付款1101 专项应付款1102 预计负债1103 递延所得税负债1104 其他非流动负债1105 非流动负债合计1106 负债合计1107 实收资本(或股本)1108 资本公积1109 库存股1110 盈余公积1111 未分配利润1112 外币报表折算差额1113 非正常经营项目收益调整1114 股东权益合计(不含少数股东权益) 1115 少数股东权益1116 股东权益合计(含少数股东权益) 1117 负债和股东权益合计利润表1251 营业收入1252 营业成本1253 营业税金及附加1254 销售费用1255 管理费用1256 堪探费用1257 财务费用1258 资产减值损失1259 公允价值变动净收益1260 投资收益1261 其中:对联营企业和合营企业的投资收益1262 影响营业利润的其他科目1263 营业利润1264 补贴收入1265 营业外收入1266 营业外支出1267 其中:非流动资产处置净损失1268 影响利润总额的其他科目1269 利润总额1270 所得税费用1271 影响净利润的其他科目1272 净利润(含少数股东损益)1273 净利润(不含少数股东损益)1274 少数股东损益现金流量表1301 销售商品、提供劳务收到的现金1302 收到的税费返还1303 收到的其他与经营活动有关的现金1304 经营活动现金流入小计1305 购买商品、接受劳务支付的现金1306 支付给职工以及为职工支付的现金1307 支付的各项税费1308 支付的其他与经营活动有关的现金1309 经营活动现金流出小计1310 经营活动产生的现金流量净额1311 收回投资所收到的现金1312 取得投资收益所收到的现金1313 处置固定、无形和其他长期资产收回的现金净额1314 处置子公司及其他营业单位收到的现金净额1315 收到的其他与投资活动有关的现金1316 投资活动现金流入小计1317 购建固定资产、无形资产和其他长期资产支付的现金1318 投资所支付的现金1319 取得子公司及其他营业单位支付的现金净额1320 支付其他与投资活动有关的现金1321 投资活动现金流出小计1322 投资活动产生的现金流量净额1323 吸收投资所收到的现金1324 其中:子公司吸收少数股东权益性投资收到的现金1325 取得借款收到的现金1326 收到其他与筹资活动有关的现金1327 筹资活动现金流入小计1328 偿还债务支付的现金1329 分配股利、利润或偿付利息支付的现金1330 其中:子公司支给付少数股东的股利、利润1331 支付其他与筹资活动有关的现金1332 筹资活动现金流出小计1333 筹资活动产生的现金流量净额1334 汇率变动对现金的影响1335 其他原因对现金的影响1336 现金及现金等价物净增加额1337 期初现金及现金等价物余额1338 期末现金及现金等价物余额1339 净利润1340 加:资产减值准备1341 固定资产折旧、油气资产折耗、生产性生物资产折旧1342 无形资产摊销1343 长期待摊费用摊销1344 处置固定资产、无形资产和其他长期资产的损失1345 固定资产报废损失1346 公允价值变动损失1347 财务费用1348 投资损失1349 递延所得税资产减少1350 递延所得税负债增加1351 存货的减少1352 经营性应收项目的减少1353 经营性应付项目的增加1354 其他1355 债务转为资本1356 一年内到期的可转换公司债券1357 融资租入固定资产1358 现金的期末余额1359 减:现金的期初余额1360 加:现金等价物的期末余额1361 减:现金等价物的期初余额偿债能力分析1401 流动比率1402 速动比率1403 现金比率1404 负债权益比率1405 股东权益比率1406 股东权益对负债比率1407 权益乘数1408 长期债务与营运资金比率1409 长期负债比率1410 利息支付倍数1411 股东权益与固定资产比率1412 固定资产对长期负债比率1413 有形净值债务率1414 清算价值比率1415 债务保障率1416 现金流量比率1417 每股有形资产净值1418 每股营运资金1419 债务总额/EBITDA经营效率分析1451 营业周期1452 存货周转天数1453 应收账款周转天数1454 流动资产周转天数1455 总资产周转天数1456 存货周转率1457 应收账款周转率1458 流动资产周转率1459 固定资产周转率1460 总资产周转率1461 净资产周转率1462 股东权益周转率1463 营运资金周转率1464 存货同比增长率1465 应收帐款同比增长率发展能力分析1601 主营业务收入增长率1602 营业利润增长率1603 利润总额增长率1604 净利润增长率1605 净资产增长率1606 流动资产增长率1607 固定资产增长率1608 总资产增长率1609 摊薄每股收益增长率1610 每股净资产增长率1611 每股经营性现金流量净额增长率获利能力分析1651 三年算术平均净资产收益率1652 总资产净利润率1653 投入资本回报率ROIC1654 成本费用利润率1655 营业利润率1656 主营业务成本率1657 销售净利率1658 总资产报酬率1659 销售毛利率1660 三项费用比重1661 营业费用率1662 管理费用率1663 财务费用率1664 非主营比重1665 营业利润比重1666 每股息税折旧摊销前利润EBITDA 1667 每股息税前利润EBIT1668 EBITDA/主营业务收入资本结构分析1701 资产负债率1702 股东权益比率1703 长期负债比率1704 股东权益与固定资产比率1705 负债与所有者权益比率1706 长期资产与长期资金比率1707 资本化比率1708 资本固定化比率1709 固定资产比重现金流量分析1751 经营现金净流量对销售收入比率1752 资产的经营现金流量回报率1753 经营现金净流量与净利润的比率1754 经营现金净流量对负债比率1755 每股营业现金流量1756 每股经营活动现金流量净额1757 每股投资活动产生的现金流量净额1758 每股筹资活动产生的现金流量净额1759 每股现金及现金等价物净增加额1760 现金流量满足率1761 现金营运指数分红送配2001 (每10股)送股数2002 (每10股)转增股数2003 (每10股)派息数(税前)2004 每10股配股数2005 配股价格2006 基准股本2007 除权除息日2008 股权登记日/B股最后交易日2009 B股股权登记日2010 派息日2011 新增可流通股份上市日2012 股本基准日期2013 董事会公告日期2014 股东大会通过日期2015 刊登实施公告日期2016 分红对象2017 分红进度2018 分红方案摘要(税前) 股本结构3001 股份总数3002 无限售股份合计3003 A股3004 B股3005 境外上市外资股3006 其他流通股份3007 限售股份合计3008 国家持股3009 国有法人持股3010 境内法人持股3011 境内自然人持股3012 其他发起人股份3013 募集法人股份3014 境外法人持股3015 境外自然人持股3016 内部职工股3017 优先股或其他十大流通股东4001 第1流通股东名称4002 第1流通股东持股数量4004 第1流通股东持股变化4005 第1流通股东持股变化数量4006 第1流通股东持股类型4011 第2流通股东名称4012 第2流通股东持股数量4013 第2流通股东持股比例4014 第2流通股东持股变化4015 第2流通股东持股变化数量4016 第2流通股东持股类型4021 第3流通股东名称4022 第3流通股东持股数量4023 第3流通股东持股比例4024 第3流通股东持股变化4025 第3流通股东持股变化数量4026 第3流通股东持股类型4031 第4流通股东名称4032 第4流通股东持股数量4033 第4流通股东持股比例4034 第4流通股东持股变化4035 第4流通股东持股变化数量4036 第4流通股东持股类型4041 第5流通股东名称4042 第5流通股东持股数量4043 第5流通股东持股比例4044 第5流通股东持股变化4045 第5流通股东持股变化数量4046 第5流通股东持股类型4051 第6流通股东名称4052 第6流通股东持股数量4054 第6流通股东持股变化4055 第6流通股东持股变化数量4056 第6流通股东持股类型4061 第7流通股东名称4062 第7流通股东持股数量4063 第7流通股东持股比例4064 第7流通股东持股变化4065 第7流通股东持股变化数量4066 第7流通股东持股类型4071 第8流通股东名称4072 第8流通股东持股数量4073 第8流通股东持股比例4074 第8流通股东持股变化4075 第8流通股东持股变化数量4076 第8流通股东持股类型4081 第9流通股东名称4082 第9流通股东持股数量4083 第9流通股东持股比例4084 第9流通股东持股变化4085 第9流通股东持股变化数量4086 第9流通股东持股类型4091 第10流通股东名称4092 第10流通股东持股数量4093 第10流通股东持股比例4094 第10流通股东持股变化4095 第10流通股东持股数量4096 第10流通股东持股类型4251 前十流通股东合计持股4252 前十流通股东占流通盘比例4253 股东人数4254 人均持流通股数十大股东5001 第1股东名称5002 第1股东持股数量5003 第1股东持股比例5004 第1股东持股变化5005 第1股东持股变化数量5006 第1股东持股类型5011 第2股东名称5012 第2股东持股数量5013 第2股东持股比例5014 第2股东持股变化5015 第2股东持股变化数量5016 第2股东持股类型5021 第3股东名称5022 第3股东持股数量5023 第3股东持股比例5024 第3股东持股变化5025 第3股东持股变化数量5026 第3股东持股类型5031 第4股东名称5032 第4股东持股数量5033 第4股东持股比例5034 第4股东持股变化5035 第4股东持股变化数量5036 第4股东持股类型5041 第5股东名称5042 第5股东持股数量5043 第5股东持股比例5045 第5股东持股变化数量5046 第5股东持股类型5051 第6股东名称5052 第6股东持股数量5053 第6股东持股比例5054 第6股东持股变化5055 第6股东持股变化数量5056 第6股东持股类型5061 第7股东名称5062 第7股东持股数量5063 第7股东持股比例5064 第7股东持股变化5065 第7股东持股变化数量5066 第7股东持股类型5071 第8股东名称5072 第8股东持股数量5073 第8股东持股比例5074 第8股东持股变化5075 第8股东持股变化数量5076 第8股东持股类型5081 第9股东名称5082 第9股东持股数量5083 第9股东持股比例5084 第9股东持股变化5085 第9股东持股变化数量5086 第9股东持股类型5091 第10股东名称5092 第10股东持股数量5093 第10股东持股比例5095 第10股东持股数量5096 第10股东持股类型5251 前十股东合计持股5252 前十股东占总股本比例5253 股东人数5254 人均持股数基金收益6001 本期净收益(元)6002 份额本期净收益(元)6003 期末基金资产净值(元) 6004 期末基金份额净值(元) 6005 股票市值(元)6006 债券市值(元)6007 股票比例(%)6008 债券比例(%)6009 合计市值(元)6010 期初基金份额总额(份) 6011 加:本期基金总申购份额(份) 6012 减:本期基金总赎回份额(份) 6013 期末基金份额总额(份) 6014 本期净申购(份)6015 持有人户数6016 户均份额(份)6017 机构投资者持有份额(份) 6018 机构投资者持有比例(%) 6019 个人投资者持有份额(份) 6020 个人投资者持有比例(%) 6021 过去三个月净值表现基金投资组合7002 第1持股名称7003 第1持股数量7004 第1持股比例7005 第1持股变化7006 第1持股变化数量7011 第2持股代码7012 第2持股名称7013 第2持股数量7014 第2持股比例7015 第2持股变化7016 第2持股变化数量7021 第3持股代码7022 第3持股名称7023 第3持股数量7024 第3持股比例7025 第3持股变化7026 第3持股变化数量7031 第4持股代码7032 第4持股名称7033 第4持股数量7034 第4持股比例7035 第4持股变化7036 第4持股变化数量7041 第5持股代码7042 第5持股名称7043 第5持股数量7044 第5持股比例7045 第5持股变化7046 第5持股变化数量7052 第6持股名称7053 第6持股数量7054 第6持股比例7055 第6持股变化7056 第6持股变化数量7061 第7持股代码7062 第7持股名称7063 第7持股数量7064 第7持股比例7065 第7持股变化7066 第7持股变化数量7071 第8持股代码7072 第8持股名称7073 第8持股数量7074 第8持股比例7075 第8持股变化7076 第8持股变化数量7081 第9持股代码7082 第9持股名称7083 第9持股数量7084 第9持股比例7085 第9持股变化7086 第9持股变化数量7091 第10持股代码7092 第10持股名称7093 第10持股数量7094 第10持股比例7095 第10持股变化7096 第10持股变化数量===================================自编一个公式中的一段,例:上季主营:=PFFIN(1601,1);DRAWTEXTABS(880,34,'■上季主营率:'+NUMTOSTRN(上季主营,1)+'%'),Color0066FF;本季主营:=PFFIN(1601,0);DRAWTEXTABS(880,50,'■本季主营率:'+NUMTOSTRN(本季主营,1)+'%'),Color0066FF;上季度净利润率:=PFFIN(1604,1);DRAWTEXTABS(999,34,'■上季度净利润率:'+NUMTOSTRN(上季度净利润率,1)+'%'),Color336600;本季度净利润率:=PFFIN(1604,0);DRAWTEXTABS(999,50,'■本季度净利润率:'+NUMTOS。
2014年上市银行年报分析

2011增幅
2012增幅
2013增幅
2014增幅
2
预计未来中国银行业所承受的业绩压力将进一步增加,伴随着利率市场 化的推进、互联网金融的冲击、民营银行试点范围的扩大、贷款质量承 压、各项成本与投入保持增长等多方面因素的综合影响,中国银行业的 利润增速将承受较大压力。
图表3:ROA与ROE水平
ROA% 5.00
6
2. 信贷资产质量下滑
2014年,我国上市商业银行信 贷资产规模继续稳步增长,于 2014年末,上述11家上市商业银 行的信贷资产规模合计为51.38 万亿元,较2013年末增加5.28万 亿元,同比增长11.4%。随着我 国经济进入新常态,经济增长 速度换挡期、结构调整阵痛期 及前期刺激政策消化期“三期 叠加”效应显现,2014年度上 市商业银行的不良贷款余额和 不良贷款率继续保持“双升” 的态势,尤其制造业、批发和 零售行业等成为新增不良贷款 较多的领域。
资产规模 利润 (万亿元) (亿元)
银行
15-20
工商银行、农业银行、建设
1600-2800
银行、中国银行
交通银行、招商银行、中信
4-7
400-700
银行、民生银行、浦发银行
<3
<300
光大银行、平安银行
信贷资产质量下滑 11家银行均出现不良贷款金额及比率双升,拨 备的增加是导致利润增速放缓的主要原因。根 据逾期减值比率的趋势,信贷资产质量在短期 内有进一步下滑的风险。
图表4:11家上市银行2012-2014 ROA与ROE均值
(%) 25
21.27
20
15
10
5
1.32
1.32
1.28