天津统计年鉴2017社会经济发展指标:各区经济指标(2016年)
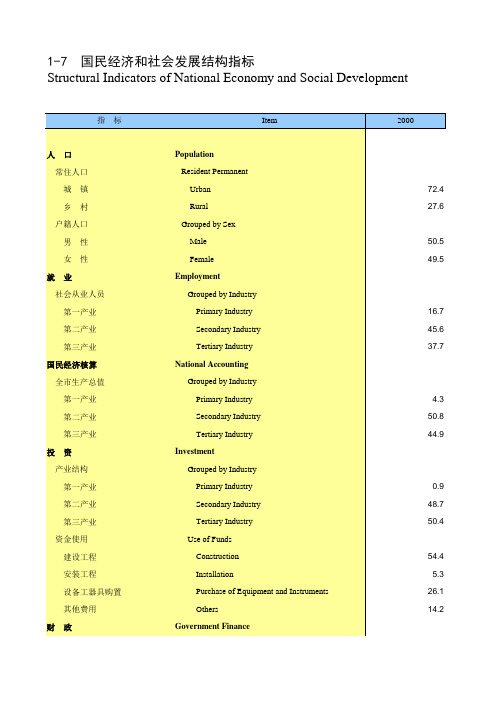
天津统计年鉴2017社会经济发展指标:国民经济和社会发展结构指标
53.4
林业
Forestry
0.9
牧业
Animal Husbandry
33.1
渔业
Fishery
12.6
农林牧渔服务业
FFAF Services
工业
Industry
全部工业总产值
Gross Output Value of Industry
轻工业
Light Industry
41.0
重工业
Heavy Industry
51.5
住宿和餐饮业
Accommodation and Catering Services
10.7
其他行业
Others
37.8
对外经济贸易
Foreign Trade and Economic Cooperation
进出口贸易总额
Imports and Exports
出口总额
Exports
50.3
进口总额
50.1
49.7
49.9
49.9
10.1
7.4
7.2
41.5
35.7
34.0
48.4
56.9
58.8
1.5
1.2
1.2
52.8
47.0
42.4
45.7
51.8
56.4
1.5
1.8
2.0
45.2
39.3
26.9
53.3
58.9
71.1
55.3
57.5
55.3
4.3
6.7
7.3
18.6
17.5
19.7
21.7
金融机构存款余额
中国统计年鉴2019全国各省市区社会经济发展指标:按行业分城镇非私营单位就业人员数(年底数)

544.0 515.7 506.9 514.4 520.8 535.1 647.5 711.8 890.8 888.6 883.3 875.0 842.8 823.3
613.9 612.7 623.1 627.3 634.4 631.1 662.8 667.5 846.2 861.4 854.4 849.5 843.9 819.0
181.2 183.9 185.8 193.2 202.1 209.2 242.7 265.1 304.4 289.3 276.1 269.7 265.9 269.8
130.1 138.2 150.2 159.5 173.8 185.8 212.8 222.8 327.3 336.3 349.9 364.1 395.4 424.3
33.4
26.6
57.9
55.6
46.0
18.0
32.0
39.4
25.4
33.5
36.8
30.1
13.8
21.8
45.0
22.4
29.1
科学研究 和技术 服务业
水利、环境 和公共设施 管理业
居民服务、 修理和其他
服务业
教育
卫生和 社会工作
文化、体育 和娱乐业
公共管理、 社会保障和
社会组织
227.7 235.5 243.4 257.0 272.6 292.3 298.5 330.7 387.8 408.0 410.6 419.6 420.4 411.5
3210.9 3351.6 3465.4 3434.3 3491.9 3637.2 4088.3 4262.2 5257.9 5243.1 5068.7 4893.8 4635.5 4178.3
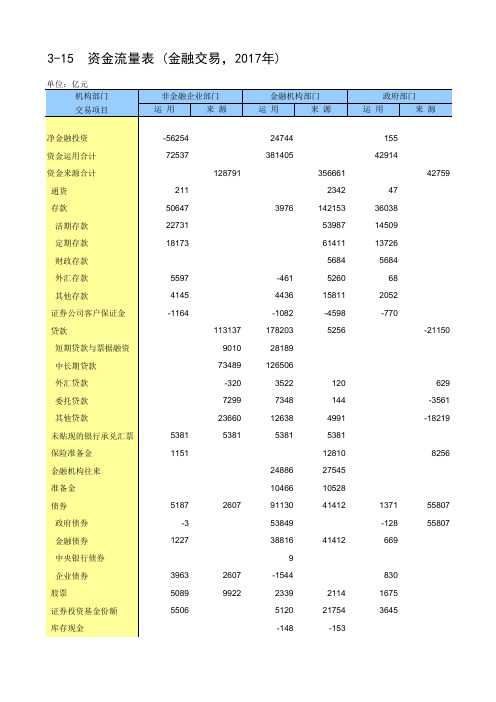
中国统计年鉴2019全国各省市区社会经济发展指标:资金流量表(金融交易,2017年)
1625
24731 66081
6881 -229 6179
24731 66081 11358
2145
-14982
11358 2145
-14982
6881 -229 6179
24731 66081 18239
1916 6179 -14982
24731 66081 18239
1916 6179 -14982
607699 2342
142153 53987 61411 5684 5260 15811 -4598
175105 28189
126506 426
7346 12638 10762 21065 27545 10528 99827 55807 41412
2607 12036 21754
-153
-11127 14412
-2 5226
3439 1786 -116
394
394
4127 62
3359 1872 1553
-66 2293
548
25538 3336
3336
3492
3490 2
1468 1863
319 881
9 654 2545
4
633238
2342 145489
53987 61411
5684 8596 15811 -4598 178597 28189 126506 3916 7348 12638 10762 21065 29013 10528 101689 56126 42294
3-15 资金流量表 (金融交易,2017年)
单位:亿元 机构部门 交易项目
非金融企业部门
运用
来源
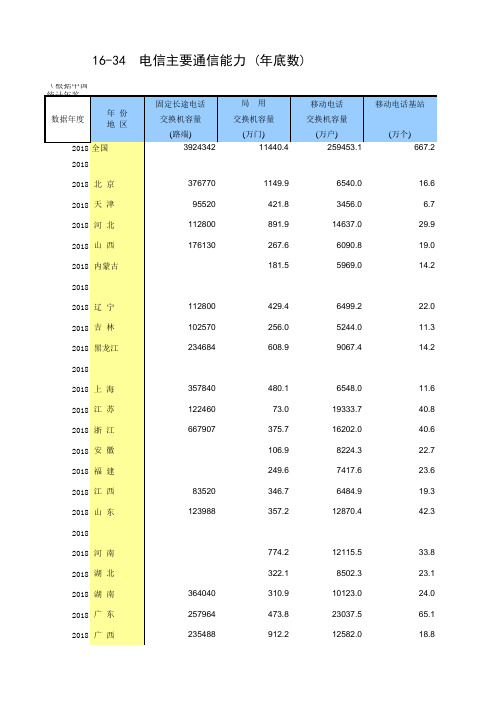
全国各省市区社会经济发展数据:16-34 电信主要通信能力(2011-2018指标)
179708 161376 771264
42470 10910 37579
24863348
275461 163995 1031586 765679 465966
2018 海 南
2018
2018 重 庆
2018 四 川
2018 贵 州
2018 云 南
2018 西 藏
2018
2018 陕 西
2018 甘 肃
2018 青 海
2018 宁 夏
2018 新 疆
2018
2018 不分地区
2018
2017 全国 2017 2017 北 京 2017 天 津 2017 河 北 2017 山 西 2017 内蒙古 2017 2017 辽 宁 2017 吉 林 2017 黑龙江 2017 2017 上 海 2017 江 苏 2017 浙 江 2017 安 徽 2017 福 建 2017 江 西 2017 山 东
13111.2 3731.0 7318.7
4424.0 10633.1 11423.7
8407.8 8203.6 4085.9 11970.4
11713.0 8753.3
465.6
12.4 4.6
19.2 13.4
9.4
16.7 7.8
10.0
8.5 32.5 32.7 16.6 18.7 13.8 28.4
64.3
1583.0
3.7
169.2
6769.0
18.1
6035297
458340 105874 254380 215190
45924
233606 86288
262137
463517 211751 783630
天津统计年鉴2016社会经济发展指标:各区县户籍人口户数人口数及人口密度

年平均人口 (万人)
Average Annual Population
(10 000 persons)20ຫໍສະໝຸດ 5人口密度 (人/平方公里)
Population Density
(person/sq.km)
2015
1026.90 941.24 399.61 41.57 75.08 82.14 86.23 62.93 51.66 36.72 38.85 43.62 39.37 90.08 70.11 123.92 39.73 59.23 85.66 85.66
1021.78 936.22 398.92 41.33 74.87 82.01 86.19 62.79 51.74 36.39 38.51 43.27 39.03 89.39 69.77 122.27 39.62 59.07 85.56 85.56
873 1630 22568 41570 18945 21610 22368 21246 24299
3-3 各区县户籍人口户数、人口数及人口密度 Registered Households,
地区
Region
年末户数 (万户)
Year-end Households (10 000 households)
2014
2015
年末人口数 (万人)
Year-end Population (10 000 persons)
1016.66 931.20 398.22 41.08 74.65 81.88 86.14 62.65 51.82 36.06 38.16 42.91 38.69 88.70 69.43 120.61 39.51 58.91 85.46 85.46
年末人口数 (万人)
天津统计年鉴2017社会经济发展指标:规模以上工业企业工业总产值

Bamboo, Rattan, Palm and Straw Products Manufacture of Furniture Manufacture of Paper and Paper Products Printing, Reproduction of Recording Media and Manufacture of Articles for Culture, Education Industrial
Hong Kong, Macao and Taiwan Foreign Funded Enterprises Grouped by Administrative Relationship Central Industry Local Industry Grouped by Size of Enterprises Large-sized Medium-sized Small-sized Mini-sized Grouped by Company Hholding Type State-owned and State-holding Enterprises
外商投资企业 按隶属关系分
中央 地方 按企业规模分 大型 中型 小型 微型 按企业控股情况分 国有及国有控股企业
Total Grouped by Status of Registration Domestic-funded Enterprises
State-owned Enterprises Collective-owned Enterprises Cooperative Enterprises Private Enterprises Share-holding Corporations Ltd. Limited Liability Corporations Sole State-funded Corporations Joint Ownership Enterprises Collective Joint Ownership Enterprises Others Enterprises with Investment from
2016年天津国民经济和社会发展统计公报
2016年天津市国民经济和社会发展统计公报天津市统计局国家统计局天津调查总队2017年3月3日2016年,全市上下认真贯彻中央和市委市政府决策部署,牢固树立和落实新发展理念,主动适应经济发展新常态,牢牢把握天津发展的历史性窗口期,积极推进京津冀协同发展,扎实推进供给侧结构性改革,经济保持平稳增长,社会事业不断完善,人民生活水平持续提升,“十三五”实现良好开局。
一、综合全年全市生产总值(GDP)17885.39亿元,按可比价格计算,比上年增长9.0%。
其中,第一产业增加值220.22亿元,增长3.0%;第二产业增加值8003.87亿元,增长8.0%;第三产业增加值9661.30亿元,增长10.0%。
三次产业结构为1.2:44.8:54.0。
图1 2012-2016年全市生产总值和服务业比重财政收支增势平稳。
全年一般公共预算收入2723.46亿元,增长10.0%。
其中,税收收入1624.18亿元,增长12.1%,占一般公共预算收入的59.6%。
从主体税种看,增值税455.80亿元,增长36.4%;企业所得税278.42亿元,增长7.1%;个人所得税96.78亿元,增长18.4%。
民生支出不断扩大。
全年一般公共预算支出3700.68亿元,增长6.3%。
其中,社会保障和就业支出378.27亿元,增长20.2%;医疗卫生支出206.07亿元,增长10.8%;住房保障支出66.75亿元,增长31.9%。
投资保持较快增长。
全年全社会固定资产投资14629.22亿元,增长12.0%。
在固定资产投资(不含农户)中,第一产业投资289.15亿元,增长19.5%;第二产业投资3940.48亿元,增长6.5%;第三产业投资10376.56亿元,增长14.0%,比重达到71.0%,比上年提高1.3个百分点。
实体投资主体地位进一步显现,完成投资9590.06亿元,增长17.2%,占固定资产投资的65.7%;基础设施投资2716.12亿元,占固定资产投资的18.6%。
中国统计年鉴2019全国各省市区社会经济发展指标:互联网主要指标发展情况(年底数)
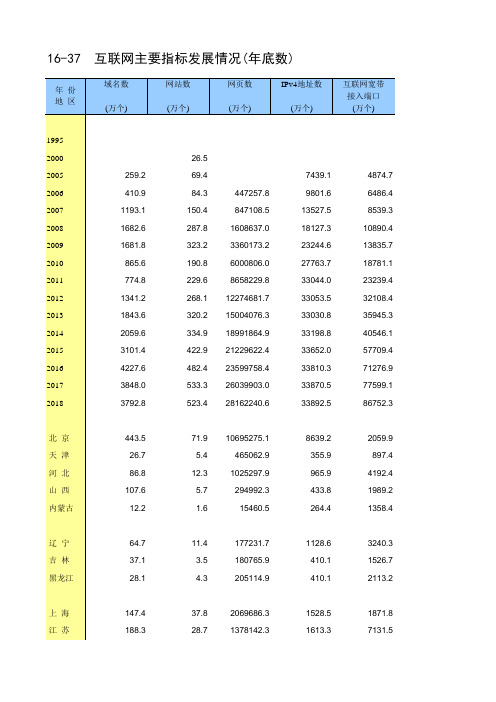
180765.9
410.1
1526.7
28.1
4.3
205114.9
410.1
2113.2
上海 江苏
147.4 188.3
37.8
2069686.3
28.7
1378142.3
1528.5 1613.3
1871.8 7131.5
移动互联网 用户 (万户)
移动互联网 接入流量 (万GB)
互联网宽带 接入用户 (万户)
259.2 410.9 1193.1 1682.6 1681.8 865.6 774.8 1341.2 1843.6 2059.6 3101.4 4227.6 3848.0 3792.8
26.5 69.4 84.3 150.4 287.8 323.2 190.8 229.6 268.1 320.2 334.9 422.9 482.4 533.3 523.4
922.5 493.9 569.5
772.9 2107.5
2475.7 3308.8 4075.9 4737.3 4873.7 6398.4 7454.0 9377.3 11741.7
67.8 26.2 857.5 196.7 96.4
213.5 94.3
241.1
1244.4
16333.6 21716.4 24926.8 29552.2 35351.6
638.8 437.9 2159.8 991.0 628.3
1136.0 588.2 810.7
772.9 3351.9
9963.5 11691.4 13442.4 14153.6 15174.6 19547.2 22266.6 25476.7 28996.5
571.0 411.8 1302.2 794.3 531.9
- 1、下载文档前请自行甄别文档内容的完整性,平台不提供额外的编辑、内容补充、找答案等附加服务。
- 2、"仅部分预览"的文档,不可在线预览部分如存在完整性等问题,可反馈申请退款(可完整预览的文档不适用该条件!)。
- 3、如文档侵犯您的权益,请联系客服反馈,我们会尽快为您处理(人工客服工作时间:9:00-18:30)。
2016 比2015年 增长(%) Increase Rate in 2016 over 2015 (%)
社会消费品 零售总额 Retail Sales
of Consumer Goods
2016 比2015年 增长(%) Increase Rate in 2016 over 2015 (%)
外贸出口 总额(亿美元) Total Value of
56.13 100.80
94.83
18.7 32.5
9.1 30.1 18.3 16.1 -7.3 24.7 33.9 20.9 26.5 24.7 19.0 -10.2 19.7 32.2
189.46 180.06 283.06 193.12 179.74 183.08 917.04 1190.26 862.91 1154.59 1281.44 830.61 4609.00 720.37 775.44 788.69
规模以上 工业总产值 Gross Output Value of Industrial Enterprises above Designated Size
2016 比2015年 增长(%) Increase Rate in 2016 over 2015 (%)
和平区 Heping District 河东区 Hedong District 河西区 Hexi District 南开区 Nankai District 河北区 Hebei District 红桥区 Hongqiao District 东丽区 Dongli District 西青区 Xiqing District 津南区 Jinnan District 北辰区 Beichen District 武清区 Wuqing District 宝坻区 Baodi District 滨海新区 Binhai New Area 宁河区 Ninghe District 静海区 Jinghai District 蓟州区 Jizhou District
Exports in Foreign Trade (USD 100 million)
2016 比2015年 增长(%) Increase Rate in 2016 over 2015(%)
15.5
488.74
19.5
414.39
20.9
509.46
20.3
575.57
15.7
260.25
3.4
199.46
6.4
22.53
-0.3
12.77
14.5
27.36
2.2
24.14
11.8
4.44
6.1
264.67
7.6
3.60
13.2
15.02
3.2
3.35
ቤተ መጻሕፍቲ ባይዱ
-2.2 -17.0
-5.8 -7.2 -14.8 -5.4 -8.1 7.4 -4.3 -6.9 -12.5 -13.1 -18.3 -8.8 -5.3 193.2
2016 比2015年 增长(%) Increase Rate in 2016 over 2015 (%)
全社会固定 资产投资 Total Investment in Fixed
Assets
93.56 58.88 89.41 74.82 60.96 28.76 78.79 116.55 61.25 93.12 126.01 64.72 672.98 29.46 64.87 41.44
22-1 各区主要经济指标(2016年) Basic Statistics on Districts,2016
地区
Region
地区 生产总值 Gross Domestic Product of
District
2016 比2015年 增长(%) Increase Rate in 2016 over 2015 (%)
实际直接利用外资 (万美元)
Actual Direct Utilization of Foreign Capital (USD 10 000)
9.00
8.5
1370.04
10.6
1760.53
8.0
1653.99
10.8
2539.64
11.5
2439.37
12.8
1041.51
7.0
12381.39
7.4
713.18
10.9
2033.15
7.5
309.68
49.2 9.3
-11.5 9.5 -1.3 6.0 5.5
10.2 8.4
11.0 14.1 20.0
0.4 12.3 15.7 18.3
5.6 11.9 -19.2 13.0 -25.6 17.6 13.0 13.4 10.8 -25.6 12.2 10.7
118.18 93.14 86.48 96.50 86.49 52.14
101.93 157.33 109.50 114.80 176.32 109.93 905.53
0.7 8.7 9.2 16.9
注:各区 生产总值增
Note: Increase rate of gross domestic product of district is calculated at constant prices,same as following next.
区级 一般公共预算收入
0.1
287.88
12.2
226.45
6.3
280.18
15.3
229.53
10.7
393.40
12.5
211.89
9.6
1103.09
3.3
119.66
12.3
151.52
10.6
184.35
6.6
18.22
11.3
3.73
6.6
9.26
0.6
6.70
8.1
5.95
12.8
1.06
27.0
20.08
802.62 290.98 819.85 652.09 415.67 208.16 927.08 1040.27 810.16 1058.14 1151.65 684.07
525.37 667.83 392.55
8.4
16.49
8.0
27.75
8.3
109.94
8.5
149.87
7.3
406.38
7.4
General Public Budget
Revenue at District Level
2016 比2015年 增长(%) Increase Rate in 2016 over 2015(%)
区级 一般公共预算支出
General Public Budget
Expenditure at District Level