89600 矢量信号分析软件
Agilent89600VSA软件介绍

Agilent89600VSA软件介绍89601B/BN-200 Basic Vector Signal Analysis89601B/BN-300 Hardware Connectivity89600 VSA SoftwareTechnical OverviewKey FeaturesMeasure and analyze signals in the time, frequency andmodulation domainsAnalyze data from over 40 supported hardware instruments, oruse in simulation tools to verify designCharacterize power amplifier behavior with complex stimulus-response measurementsConfigure, execute and display multiple measurementssimultaneously with unlimited number of traces and markers Record and playback signals for thorough analysisAutomate tests using familiar SCPI programming or anysupported .NET languageBasic vector signal analysis (Option200) provides the foundation of the tools and user interface that make up the 89600 VSA software. Explore virtually every facet of today’s most complex signals with views of time, frequency and modulation domains. Benefit from the flexible GUI capabili-ties: arbitrary arrangement and sizing of unlimited display traces, each with unlimited markers. Powerful display formats, signal recording and play-back, and detailed Help text provide the insight needed for analyzing signals. Use the 89600 VSA software in simulation with sink and source componentsproviding real-time, in-teractive analysis of results. Co-simu-lation is available with Agilent EEsof Advanced Design System (ADS) and SystemVue ESL, and The MathWorks’ Simulink as part of Option 200. Hardware connectivity (Option 300) allows the 89600 VSA software to be linked to over 40 Agilent instru-ments. Choose the right instrument for your application and apply vector signal analysis across your mixed signal design. Use the 89600 VSA software for consistent, comparable results at simulation, prototype and design-validation stages of develop-ment.These options work together to provide a comprehensive set of tools for demodulation and vector signal analysis. These tools enable you to explore virtually every facet of a sig-nal and optimize your most advanced designs. As you assess the tradeoffs, the 89600 VSA helps you see through the complexity.Try before you buy!Download the 89600 VSA software and use it free for 30 days to make measurements with your analysis hard-ware, or use our recorded demo signals by selecting File > Recall > Recall Demo > signal type > on the software toolbar. Request your free trial license today:/doc/6229e50e6edb6f1aff001f32.html /find/89600_trialTechnical OverviewVec tor signal analysis Today’s wide-bandwidth, vector-modulated (also called complex or digitally modulated), time-varying signals benefit greatly from the capa-bilities of FFT analysis and other DSP techniques. Vector signal analysis offers fast, high-resolution spectrum measurements, demodulation, and advanced time-domain analysis. It is especially useful forcharacterizing burst, transient, or modulated signals used in communications, video, broadcast, radar, and ultrasound imaging applications.The 89600 VSA software is funda-mentally a digital system that uses data and mathematical algorithms to perform analysis. All it requires is sampled data from an instrument, software, or digital bus. As a larger portion of wireless designs becomes digital, the 89600 VSA software is uniquely suited to provide signal analysis for these complex systems. The 89600 VSA software running on a PC uses a measurement “front-end” or data acquisition subsystem to provide formatted sampled data. The front-end performs the following func-tions: connection to the device under test, signal digitizing, signal capture capability, and data transfer to the PC in a sequential stream of data blocks. Once the data blocks are available, the 89600 VSA software is able to perform all vector and modulation analysis functions.Complex stimulus-response measurements analyze envelope tracking power amplifier and power supply signals together, providing envelope/RF time alignment and shaping information.Powerful visualization and triggering tools highlight subtle and transient events like this radio turn-on event.Analysis and TroubleshootingFind the root cause of signal problems with advancedtroubleshooting toolsQuantify spectral performance with high-resolution FFT-based measurements and a rich set of markers. Analyze timedomain signal quality using pulse-timing features, robust trigger controls, CCDF, and more. Use analog demodulation to characterize AM, FM and PM behavior.Complex stimulus-response measurements enable plotting of one signal versus another for results like AM/AM, AM/PM and gain compression. Automatic time alignment, amplitude normalization and phase error compensationgreatly simplify measurement setup. As the industry’s only solution to correlate baseband and RF signals, the 89600 VSA software is ideal for characterizing envelope tracking power amplifier and power supply designs.Catch short-lived signal events using sophisticated displays and triggeringThe digital persistence, cumulative history and spectrogram displays are useful for viewing signal amplitude and frequency behavior over time and identifying infrequently occurring events. Capture elusive signals with flexible magnitude and external triggers, as well as frequency mask trigger with real-time enabled PXA and MXA signal analyzers. Initiate measurements or recordings based on trigger conditions to analyze and thoroughly characterize dynamic signals.Display unlimited traces simultaneously to gain greater clarityPinpoint problems with arbitrary arrangement and sizing of trace windows. You can assign any mea-surement to any trace, as well as unlimited markers per trace. Optimize the trace window shape to see the most data in each trace. A docking manager tool lets you position traces anywhere within the 89600 VSA soft-ware display window. Multiple display windows can be created to manage a large number of results or take advantage of multiplemonitors.Record and analyze your signals in detail Especially useful in early R&D, you can capture transient events, compare signal outputs after design iterations, or share the signal for collaborative analysis with remote colleagues. Additional tools, like overlap process-ing, let you effectively “slow down” the apparent measurement for more in-depth analysis. Show unlimited traces, each with unlimited markers, wherever and however you need them. Overlay related traces or hide them. Undock a window and place it anywhere on your desktop using the docking manager tool.The 89600 VSA software lets you record signals. Using familiar recording controls, you can replayand analyze the signal as though it were a live measurement.Make use ofsophisticated toolswith an easy-to-use GUIThe 89600 VSA software featuresmany time-saving GUI features. Hoveryour mouse over a display “hot spot”to bring up a special cursor and ahelpful message. T o change a value,you can choose from a drop-downmenu, scroll using the mouse, ortype in a numeric value, dependingon the parameter. Right-clicking inthe trace display brings up a menu ofoften-used tools, such as Y-autoscale.The 89600 VSA software’s toolbarincludes one-button selection of othercommon tasks, such as auto-range,record, start/stop, special markersselection, macros, and more.GUI tools let you easily set up your measurements and customize your work area. Hover your mouse over the many “hot spots” on the display, shown highlighted here. Use them to easily change any parameter value without accessing the menus. In addition, you can right-click in the display to bring up a menu of frequently-performed tasks, like auto-scaling the trace.Marker toolTrace data menubutton or right-click)Y-axis top scaleTrace formatY-axis/division scaleResolution bandwidthTrigger channelMain time length**Trigger delay*Trigger level* Y-axis context menuMarkers readoutX-axis context menuY-value for active markerButtons for selectinga trace tab in a tab setand for closing a trace Center frequencyY-axis/bottom scale* Trace hotspots(double-click to edit)Hover your mouse over a trace or menu and Dynamic Help will provide you with an instant display of user documentation. The content can be locked to show your desired information, and the Helpwindow detached and placed anywhere on your workspace.Learn about the89600 VSA - the fast wayDynamic Help lets you access detailed information on theproduct and its applications. Place your mouse over any trace or menu and the pertinent Help text automatically appears - this is particularly useful when setting up complex new modu-lation schemes. Help text includes information on using the 89600 VSA software, setting up measurements, and application information for the specific modulation schemes.Develop automated tests easilyCreate design verification tests using familiar SCPI or any supported .NET language. Use macro recording to capture key-strokes and automate repetitive tasks. The macros toolbar can be displayed for easy macro selection.Connect to over 40instrument platforms Option 300 lets you choose from signal analyzers, oscilloscopes, logic analyzers, modular instruments, and more. The same GUI is used to control measurements, no matter what hardware platform is used, minimizing the learning curve. Connect to the instruments via GPIB, LAN or USB. Or, run it inside the instrument itself if it is PC-based. For a list of currently supported products, go to www. /doc/6229e50e6edb6f1aff001f32.html/find/89600_hardware.A configuration menu simplifies the instrument detection and validation process.Make measurements anywhere in your design processUse the 89600 VSA software in simulation environments to analyze and visualize simulated results. When device prototypes are ready, select the measurement hardware best suited to your task and apply the same 89600 VSA software measurement science to your physical device under test. Access analog and digital baseband; IF and RF signals, comparing signal qualityparameters, like EVM, from one signal block to the next, from simulation to implementation.Automate tests using programs written in SCPI or any supported .NET language. The 89600 VSAsoftware also supports macros developed with C# and other languages.Whether you’re making measurements using a logic analyzer, oscilloscope, or signal analyzer, the UI and measurement algorithms are the same. Safely compare results from baseband to RF and evalu-ate against your error budget.DSP DACIF/RF/μWBB (I-Q)Signal AnalyzerOscilloscopeLogic AnalyzerDigital (SSI)Create, configureand execute multiple measurements at the same timeThe new, innovative multi-measurement capability is now standard in the 89600 VSA software. The multi-measurement capability allows you to configure, execute and display several measurements at once, simplifying and speeding analysis of multi-carrier or multi-format devices, simul-taneous uplink and downlink signals, or single signals compared at multiple test points (RF, baseband, IF). When all signals are spaced to fit within an instrument’s analysis bandwidth, measurements are perfectly simultaneous. For wider frequency coverage, the VSA software can coordinate two or more independentinstruments toacquire all desired signals.Multi-measurements in action: Traces A and B provide a composite spectrum overlaid with the CCDF statistics for the combined waveform. Traces C and F show a GSM signal. Traces D and G outline aW-CDMA downlink signal and Traces E and H analyze an LTE downlink signal.Channel configuration wizard lets you view and map hardware channels to multiple measurements.Software FeaturesBasic VSA (Option 200)Note: The following features are independent of hardware platform used, unless otherwise noted.This technical overview provides nominal performance specifications for the software when making measurements with the specified platform. Nominal values indicate expected performance, or describe product performance that is useful in the application of the product, but is not covered by the product warranty. For a complete list of specifications refer to the measurement platform literature.Key Specifications 11. Data subject to change2. Values are for baseband measurements; values increase to match 1 ch BW for zoom measurements. Select baseband/zoom in the 89600 VSA software by clicking on MeasSetup>Frequency (tab)>Time Data> then either baseband or zoom.Basic VSA (Option 200)Key Specifications(Continued)Key Specifications(Continued)1. For complete Option BBA BBIQ specifications, see literature part number 5989-6538EN.2. Measured at –6 dB below max for each range, 250 kHz reference frequency, all ranges, nominal value.3. Reference level is input signal of –25 dBm at a range setting of 0 dBm.4. With dither turned on.1101001000110100Measurement span (MHz)C a p t u r e l e n g t h (s e c )Capture length vs. span for MXA/EXA (without DP2, MPB, B40 or wider bandwidth)MXA (BBIQ mode) capture length vs. spanCapture length vs. span for MXA/EXA (with DP2, MPB, B40 or wider band-width) and PXAPXA noise density (nominal, 1.8GHz).1. With Option MPB, DP2, B40, B85, B1A or B1X.2. With Option MPB, DP2 or B40.。
89600矢量信号分析(VSA)软件推出第12版

电话 :0 0 6 3 -1 1 1- 25 20
ht /www. k r ni . o 。 n t / p: t to x c m c e
P M M *E —E o 的 预 防 。此 外 ,R&S VMS 还 具 有 极 HS A+ I O N DGE v 分 析 提 供 D 1
高的性价 比。
( 8 0 用 ) 内 的 1 种 插 入式 模块 可 DL 5V专 在 5
电话 :0 0 8 7 — 6 8 l — 0 0 6 8
ht /www.i L o t / p: rgo c m
列 高性 能 示 波 器 ,生 成 和 分 析 经过 校 准 的 宽 带 雷 达 和 卫 星 信 号 , 满 足 1 以 GH z 上 带 宽 及 高达 5 GH 频 的 测 试 要 求 。 0 z 载
了多 种新 的 增 强特 性 ,并 针 对 新操 作
高性能数 字万用表
DM3 6 系列 6 08 位半 数 字万 用表 整 体性 能卓越 ,其 基本直流 电压准 确度可
以达 到 0 0 3 %,同 时 ,在 测 量 速 度 方 .0 5
Ro d & Sc wa z he h r
电话 :0 0 6 3 — 8 8 1 — 4 1 2 2
提高通 道数的同时 ,不影 响采样率 或数 电 流 的 测 量 范 围 扩 展 到 了 2 0 A, 电 非常适 合精确测量变频 器的波形信号 。 0
据 吞 吐 量 。 由于 具 有 更 小 的 体 积 、 更 简 容 测 量 的 范 围扩 展 到 了 1 0 F 除 了基 DL 5 /DL8 0 0m 。 8 0 5 V支 持 最 大 1 0 S s M / 的 0
ht /www. c m t / p: nL o
安捷伦8960测量原理及操作说明
安捷伦8960测量原理及操作说明一、测量原理1.信号调制解调:测量设备与被测设备之间建立无线连接后,通过信号调制解调模块将测试信号转换成与被测设备相适应的信号,然后将被测设备发送的信号经过解调转换成数字信号。
2.信号发射与接收:通过射频信号处理系统,将数字信号转换成高频射频信号,通过无线天线发送到被测设备,同时接收被测设备发送的信号。
3.信号分析:通过信号处理单元,对接收信号进行频谱分析、波形分析、调制解调分析等,获取信号的各项参数。
二、操作说明1.连接设备:将测试设备与被测设备通过数据线或者无线连接,在软件界面上选择正确的接口和通信制式。
2.设置测试参数:根据测试需求,设置相应的测试参数。
包括频率范围、带宽、功率级别、调制方式等。
3.启动测试:点击开始测试按钮,仪器将自动产生测试信号并发送到被测设备。
同时,仪器将接收被测设备发送的信号并进行分析。
4.监测信号性能:根据测试需求,在界面上选择需要监测的信号性能参数,如信号强度、误码率、速率等。
仪器将实时显示和记录这些参数。
5.结果分析:测试完成后,可以通过仪器提供的分析工具对测试结果进行进一步分析,如绘制波形图、功率谱图、调制解调图等。
6. 测试报告生成:系统可生成详细的测试报告,包括测试参数、测试结果、分析图表等。
可以导出为Excel、PDF等格式。
三、使用注意事项1.使用正确的天线和连接器,确保信号传输的质量和稳定性。
2.在设备连接之间进行频谱清洁,避免干扰信号的出现。
3.在设置测试参数时,根据被测设备的要求进行合理选择。
4.在测试过程中要注意设备的工作温度和通风情况,确保设备的正常运行。
5.对于不同通信制式的测试,要熟悉相关的技术标准和测试规范,确保测试结果的准确性。
通过以上的操作说明,您可以正确使用安捷伦8960进行无线信号测试和性能检测。
根据测试需求,合理设置测试参数并分析测试结果,可以帮助您更好地了解被测设备的性能和信号质量。
安捷伦89600矢量信号分析软件功能概述及测量指南
安捷伦89600矢量信号分析软件功能概述及测量指南2009年4月© Copyright 2009Agilent Technologies, Inc.通告本文档所含内容如有修改,恕不另行通知。
安捷伦对本资料不作任何形式的保证,包括但不限于为特定目的的适销性和适用性所作的暗示保证。
对其中包含的错误或由供给、使用本资料或由本资料的实用性而引起的偶然或继发的损失,安捷伦不承担任何责任。
© Agilent Technologies, Inc. 2009在安捷伦没有预先同意之前。
不得以任何形式复制本手册中的任何部分(包括电子存储和检索或翻译为其它语言)。
简介本手册介绍了安捷伦89600矢量信号分析软件的基本功能并重点说明了其数字解调分析功能及操作流程。
同时给出89600 矢量信号分析软件的多种数字解调分析工具和故障诊断方法。
通过对QPSK和W-CDMA信号的测量举例,详细描述了使用89600 矢量信号分析软件进行解调分析的测量过程和操作步骤。
其它信息欲获得更多信息,包括最新的产品信息、软件升级和应用信息,请访问下列网址:/find/89600目录Agilent 89600 VSA软件描述 (5)配置 (5)包含两个应用模式 (5)可接收多个测量前端的数据 (5)设计流程中应用Agilent 89600 VSA软件 (6)软件编程 (6)Agilent 89600 VSA软件功能举例 (7)宽频带测量 (7)窄扫宽超高分辨率测量 (7)捕获完整信号 (7)使用Bandpower Markers简化信道功率测量 (8)录制信号以延展分析能力 (9)使用模拟解调分析信号的建立过程 (9)使用模拟解调定位残余调制 (9)使用数字解调隔离符号时钟错误 (10)使用数字解调更容易地发现滤波问题 (10)使用窗口灵活配置用户化工具栏和显示 (11)结合Agilent ADS的分析 (12)数字解调分析 (13)数字解调器工作原理 (13)数字解调器设置十步骤 (13)QPSK解调分析步骤 (13)分析工具 (16)矢量图 (17)星座图 (17)眼图 (18)I/Q vs时间 (18)解调频谱 (19)误差矢量幅度 (19)幅度和相位误差 (20)误差矢量频谱 (21)符号表/错误摘要 (21)自适应均衡结果:脉冲响应和信道响应 (22)故障诊断 (22)诊断测试流程 (22)诊断:I/Q增益不平衡 (23)诊断:正交误差 (23)诊断:I/Q偏移 (24)诊断:符号速率错误 (25)诊断:滤波错误 (25)诊断:杂散和干扰信号 (30)诊断:压缩 (32)无线测量举例 – W-CDMA(3GPP)/HSPA (34)W-CDMA (3GPP)/HSPA 概览 (34)进行W-CDMA测量 (34)解调下行信号 (35)解调上行信号 (37)分析W-CDMA信号 (40)选择所分析的时隙 (43)测量诊断 (45)Agilent 89600 VSA软件描述Agilent 89600 VSA(Vector Signal Analysis)矢量信号分析软件提供基于Windows用户界面的矢量信号分析。
Keysight 高频宽带一体化测试解决方案 (设计 802.11ad 设备)
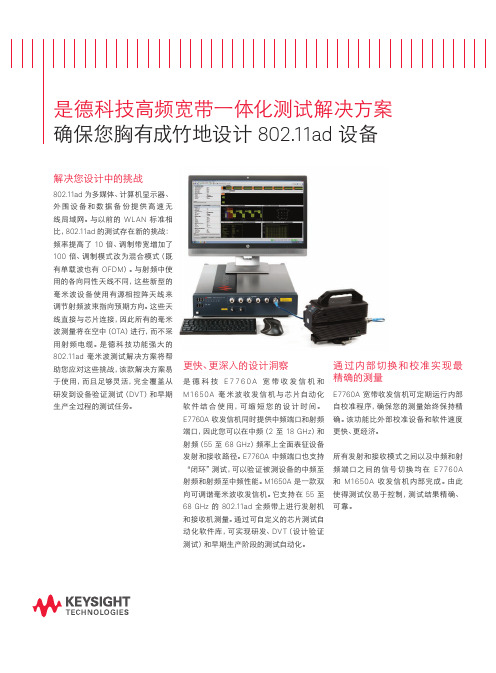
是德科技高频宽带一体化测试解决方案确保您胸有成竹地设计 802.11ad 设备解决您设计中的挑战802.11ad 为多媒体、计算机显示器、外围设备和数据备份提供高速无线局域网。
与以前的 WLAN 标准相比,802.11ad 的测试存在新的挑战:频率提高了 10 倍、调制带宽增加了100 倍、调制模式改为混合模式(既有单载波也有 OFDM)。
与射频中使用的各向同性天线不同,这些新型的毫米波设备使用有源相控阵天线来调节射频波束指向预期方向。
这些天线直接与芯片连接,因此所有的毫米波测量将在空中(OTA)进行,而不采用射频电缆。
是德科技功能强大的802.11ad 毫米波测试解决方案将帮助您应对这些挑战,该款解决方案易于使用,而且足够灵活,完全覆盖从研发到设备验证测试(DVT)和早期生产全过程的测试任务。
更快、更深入的设计洞察是德科技E7760A宽带收发信机和M1650A 毫米波收发信机与芯片自动化软件结合使用,可缩短您的设计时间。
E7760A 收发信机同时提供中频端口和射频端口,因此您可以在中频(2 至 18 GHz)和射频(55 至 68 GHz)频率上全面表征设备发射和接收路径。
E7760A 中频端口也支持“闭环”测试,可以验证被测设备的中频至射频和射频至中频性能。
M1650A 是一款双向可调谐毫米波收发信机。
它支持在 55 至68 GHz 的 802.11ad 全频带上进行发射机和接收机测量。
通过可自定义的芯片测试自动化软件库,可实现研发、DVT(设计验证测试)和早期生产阶段的测试自动化。
通过内部切换和校准实现最精确的测量E7760A 宽带收发信机可定期运行内部自校准程序,确保您的测量始终保持精确。
该功能比外部校准设备和软件速度更快、更经济。
所有发射和接收模式之间以及中频和射频端口之间的信号切换均在 E7760A和 M1650A 收发信机内部完成。
由此使得测试仪易于控制,测试结果精确、可靠。
本文中的产品指标和说明可不经通知而更改© Keysight Technologies, 2016 - 2017Published in USA, February 3, 2017出版号:5992-1714CHCN 在 802.11 ad 全频带上优化射频测试M1650A 毫米波收发信机–利用与被测设备(DUT )相距合适距离处发送的信号优化射频测试–通过可调谐 M1650A 收发信机在 55 至 68 GHz 的 802.11ad 全频带上执行发射和接收测量–结合使用一台 E7760A 与最多6台 M1650A 收发信机,测试波束赋形和波束控制–以最少的电缆布线执行更快的多被测设备吞吐量测试–802.11ad 频带上的典型 EVM 为 -29 dB –在多种环境下分析信号,信号幅度范围为 -50 至 +20 dBm全面测试被测设备的中频性能E7760A 宽带收发信机可深入分析设备的中频性能。
Agilent N9010A EXA 信号分析仪 说明书
设置为 normal(正常),则分析 仪必须开机至少 30 分钟;如果 “Auto Align”设置为 off(关闭) 或partia(l 部分),则必须在足够 近的时间内进行过校正,以避免 出现告警信息。如果“告警”条 件从“时间和温度”变成禁用的 时间长度选择之一,则分析仪可 能达不到技术指标,并且不会向 用户发出通知。
Agilent N9010A EXA
信号分析仪
技术资料
可用的频率范围 N9010A-503 N9010A-507 N9010A-513 N9010A-526
9 kHz~3.6 GHz 9 kHz~7.0 GHz 9 kHz~13.6 GHz 9 kHz~26.5 GHz
LXI C 类标准认证
目录
定义与条件 .............................. 3
9 kHz~3.6 GHz 3.5~7.0 GHz 6.9~13.6 GHz 13.5~17.1 GHz 17~26.5 GHz
频率基准 精度 老化率
温度稳定性 20~30℃ 5~50℃
可获得的最初校准精度
最后一次调整后 1 年内的频率 基准精度示例(包括选件 PFR) 剩余 FM(调频)
选件 PFR 标准
一般技术指标 ......................... 11
温度范围 ................................... 11 EMC .......................................... 11 安全 ........................................... 11 音频噪声 ................................... 11 环境强化测试 ........................... 11 电源要求 ................................... 12 数据存储 ................................... 12 重量 ........................................... 12 尺寸 ........................................... 12 保修 ........................................... 12 校准周期 ................................... 12
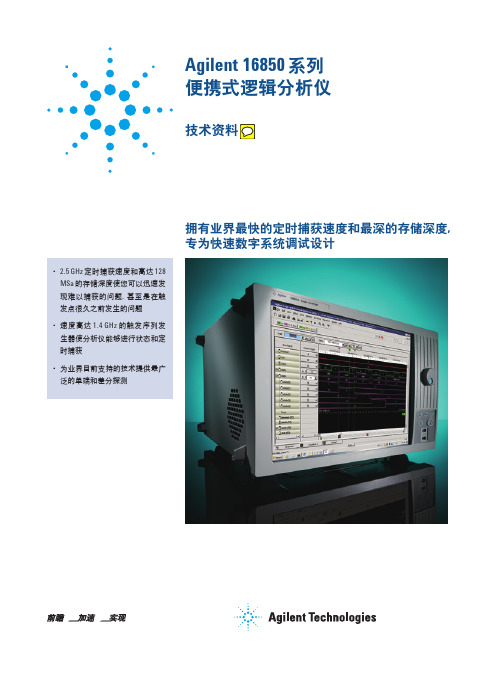
是德科技keysight16850系列逻辑分析技术手册
效窗口宽度有关的信号完整性问题
图 2. 眼图扫描(Eye Scan)可自动设置采样位置,进行精确的状态捕获;无需使用 示波器即可提供针对每个输入信号的信号完整性视图。
全通道模式下的最大采样率 半通道模式下的最大采样率 所有通道上的采样时间 采样周期(半通道模式) 最小数据脉宽 最大跳变时间间隔 16 通道适配夹内部的时间间隔精度 (典型值) 1 跨越 16 通道适配夹的时间间隔精度 (典型值) 1
1. 使用单端飞线和 Soft Touch Pro 探头。
传统和跳变定时 (深度高达 128 M)
更深入的系统分析
图 1. 该系列有 4 种型号可供选择, 并可配备 多种选件来升级状态速度和存储深度,让 您可以获得测量能力匹配您的需求的逻辑 分析仪。
自动捕获 FPGA 内部信号
16850 系列逻辑分析仪与 FPGA 动 态探头配合使用,使您能够通过自动 化流程利用逻辑分析仪的深存储器探 测 Xilinx 和 Altera 器件上的 FPGA 内部网 络或节点信号。
700 Mb/s 标准配置
2 M 默认
4 M (选件 004)
8 M (选件 008)
16 M (选件 016)
32 M (选件 032)
64 M (选件 064)
128 M (选件 128)
单端、差分
支持
支持
直接连接单端飞线
Mictor 和 Soft Touch Pro 无连接器
90 针连接器单端和差分探头, 适用于飞线、Mictor、Soft Touch (软接触)、Soft Touch Pro 和 Samtec 连接 (与 U4201A 电缆结合使用)
安捷伦频谱仪所有型号指南
安捷伦频谱和信号分析仪选型指南引言安捷伦科技公司拥有全面的频谱分析仪和信号分析仪产品线,频率范围覆盖直流至 325G Hz,可对失真、杂散、相位噪声和无线通信信号的频率、幅度和调制进行精确测量。
这些仪器和 89600B 矢量信号分析(VSA)软件(一种灵活的调制分析软件或测量应用软件)结合使用后,可进一步扩展仪器功能,对广泛的标准数字信号和通用数字信号和格式进行解调。
购买信号分析仪器是一项重要投资。
购买的仪器不仅要满足当前的工作需求,而且要适应未来的要求。
鉴于每个项目和用户都有不同的需求,选择能够满足所有需求的最佳仪器可能会十分复杂且耗时,而时间就是金钱。
安捷伦作为全球领先的测试测量公司,可提供广泛的分析仪和应用软件,满足各个层次的预算需求。
本选型指南将帮助您轻松找到最适合您自身需求的频谱分析仪或信号分析仪。
产品定义频谱分析仪和信号分析仪传统意义上的频谱分析仪是指可提供幅度/频率显示、具备调谐扫描功能的超外差接收机。
当今分析仪具有调谐扫描功能和 FFT 体系结构。
尽管“频谱分析仪”和“信号分析仪”两个术语现在常常互换使用,但对于当今可进行全面频域、时域和调制域信号分析的分析仪来说,“信号分析仪”一词更为准确。
台式分析仪和手持式分析仪台式频谱/信号分析仪可提供优异的射频技术指标和测量应用软件。
而手持式频谱分析仪更被那些由于频谱空间日益拥挤、射频技术不断演进而需要花费大量时间在外场完成工作的射频工程师或技术人员所青睐。
为了解决他们所面临的难题,手持式频谱分析仪需要具备坚固、精确、快速且简单易用等特性。
测量应用软件和测量软件安捷伦提供了基于 PC 和基于仪器的应用软件,以满足从研发、故障诊断到一键完成制造测量的测试需求,这些软件适用于广泛的通信标准和调制类型。
EMI 和 EMC 解决方案电磁干扰(EMI)是由设备的辐射或传导发射造成的。
EMI 分析仪和接收机能够准确定位干扰源的频率和位置,从而减少或消除干扰信号。
- 1、下载文档前请自行甄别文档内容的完整性,平台不提供额外的编辑、内容补充、找答案等附加服务。
- 2、"仅部分预览"的文档,不可在线预览部分如存在完整性等问题,可反馈申请退款(可完整预览的文档不适用该条件!)。
- 3、如文档侵犯您的权益,请联系客服反馈,我们会尽快为您处理(人工客服工作时间:9:00-18:30)。
System Vue
•雷达电子战 •动态系统仿真软件。它可以提供各种复 杂的模拟、数字、数/模混合、多速率系统 •数字接收机 以及语音编码应用,可用于各种线性、非 •定向 线性控制系统的设计和仿真。平台。 •移动通信 •灵活的信号建模工具 • 通用性 •复杂雷达信号的建立
Matlab或用户开发软件
采集的信号数据
复杂信号产生以及分析技术发展
议程
第一章: 复杂电子系统 第二章: 宽带信号产生分析 第三章: 雷达信号产生分析 第四章: OFDM信号产生分析
为什么需要多通道系统???
信号路径 发射机
...
接收机
...
Pt – Lt + Gt – Lp – LF + Gr – NFr – kT – BW – C/Nrequired = M ≥ 0
PCIe Differential I/Q signals Modulation BW up to 2 GHz RF up to 44 GHz
M8190A Marker output Pulse mod. input
E8267D, Opt. 016
RF/IF out
Direct IF/RF
RF/IF out
21
Amplitude Correction Setup
Remote Control • AWG and spectrum analyzer are remotely controlled by a PC running an equalization routine Magnitude of each tone in the multi-tone signal is measured and frequency response stored in a file Pre-distorted multi-tone signal can be calculated PC running Multi-tone and equalization routine AWG
24
Amplitude Correction Setup
• AWG and spectrum analyzer are remotely controlled by a PC running an amplitude correction routine Magnitude of each tone in the multi-tone signal is measured and frequency response stored in a file Pre-distorted multi-tone signal calculated based on measurement Multi-tone and equalization scripts are available for free
26
High-Precision AWG Example: Multi-Tone Signal
•Multi-tone signal with 200 tones, 3 GHz bandwidth Fs = 7.2 GHz with amplitude correction
27
High-Precision AWG Example: Digital Modulation
Page 3
孔径组合
• 越多越好! • 接收到更强的信号能量! • 另外: – 抵抗多径 – 波束赋形 – 提高波束分辨率 – 更高的数据处理能力 – 快捷的动态 SDMA – 定位发射方向
Page 4
多径与分集天线
RSL (dBm) 主 接收机
破坏性叠加 发射机 直射波
反射波 增强性叠加 分集 接收机
超宽带信号
为什么需要超宽带信号
• 雷达目标
• 线性调频及相位编码
• 大的宽带数据管道
• 智能图像 • 数据通信
• 频率捷变通信
• 低的截获概率 • 频谱效率
议程
第一章: 复杂电子系统 第二章: 宽带信号产生分析 第三章: 雷达信号产生分析 第四章: OFDM信号产生分析
宽带信号合成的实现方式
下载 信号产生工具 任意波形发生器 Q 信号产生工具 用来产生复杂的宽带信号 下载到 任意波形发生器中 任意波形发生器产生基带IQ信号 通过矢量信号源的外部IQ调制最终通过信号源的 RF端口输出 信号产生工具: 任意波形发生器: 矢量信号源: I
Theoretical signal
23
Digital I/Q Up-Conversion (1/2)
•Digital up-conversion avoids a few of the problems associated with analog I/Q modulators: • No (in-band) carrier feed-through • No (in-band) images •BUT: Frequency response is still not flat
Page 6
相控阵天线 & SDMA
波束形成网络(BFN)
τ1
τ2
τ3
τ4 Σ
τ5
τ6
τ7
τ8
Page 7
空分多址 (SDMA)
Rx2 Rx1 [WRx2] [WRx1] [WRx3] Rx3
控制 矩阵 [W ] W1
τ1
W2
τ2
W3
τ3
W4
τ4
W5
τ5
W6
τ6
W7
τ7
W8
τ8
(BFN)
Σ
Page 8
持续推陈出新
Step Step 2 Step 1
M9330A / 15 bit, 1.2 Gsa/s
71.9 N8241A dB 64 dB
3
M8190
14 bit 8 GSa/s / 12 bit 12 Gsa/s
86.3 dB
81180A
Released Q3/2010
12 Bit, 4.2 GSa/s AWG
信号复杂性
信号带宽 信号播放长度 信号质量
信号带宽 信号质量 信号载波频率 信号载波功率
信号产生工具平台
关键技术指标 ADS软件
灵活的信号建模工具 • 可调用的设计库 • 用户开发算法的嵌入 • 系统仿真和电路仿真的嵌套 • 实际电路测试参数的嵌入(放大器,天 线等)
主要应用
•复杂雷达信号的建立 •雷达回波信号的建立 •受干扰雷达信号的建立
分集
主
180º 相移
Page 5
偏移
使用MIMO(多进多出)得到高动态
• 使用6个天线得到 360º覆盖 • 较大的天线增益! • 必须选择天线 • 开关方法 • 矩阵方法
2 x 2 MIMO x1 h11 h12 x1 Tx1 h21 x2 x2 Tx2 h22 Linear Channel Rx2 x1 h12 + x2 h22 x2 Rx1 H-1x 1 (DSP) x1 h11 + x2 h21
Theoretical signal
Analog I/Q Modulation Example (3/4)
•Adjusting the differential offset of the I and Q signals reduces the carrier feed-through
Theoretical signal
Nearest competitor SFDR: 48dBc Resolution: 10bit, even only 8 bit with marker Fixed Resolution Standard DAC
Analog I/Q Modulation vs. Digital I/Q UpAWG Conversion
Perceived leader in signal performance
Be on the market as soon as possible
M8190A 业内最高性能
Agilent SFDR: 75dBc Resolution: 14bit Switchable Resolution (14bit/12bit) Agilent DAC Technology
•分析仪表的宽频率覆盖和深存储能力 • 实际设备的采集信号数据的利用
•真实试验信号的实验室恢复 •电子对抗信号的参数特性分析
任意波形发生器平台
硬件平台 关键技术指标 • 15Bit •1.25 G Sa/s • 1 GHz IQ 调制带宽 •16M Sa的波形存储器 • 支持波形序列功能 • 12 Bit •4.2 GSa/s • 2 GHz IQ 调制带宽 • 64M Sa 的波形存储器 •支持波形序列功能 • 14 Bit 或者 12 Bit • 8G Sa/s 或者 12G Sa/s • 4GHz IQ 调制带宽 •2 G Sa的波形存储器 •支持波形序列功能
•Wideband digital modulation: QAM16, 1G Sym/s (~ 4 Gb/s) Fs = 7.2 GHz with amplitude correction
PCIe
IF/RF up to 5 GHz Modulation BW up to 2 * (5 GHz – IF)
M8190A
Analog I/Q Modulation Example (1/4)
•Multi-tone signal with 20 tones spanning 2 GHz •Asymmetric with respect to the carrier frequency • Notice: • Images • Carrier feed-through • Non-Flatness