NeuroCheck_Manual_V1_3
SoundCheck指导手12132册

S o u n d C h e c k指导手12132册(总13页)--本页仅作为文档封面,使用时请直接删除即可----内页可以根据需求调整合适字体及大小--SoundCheck操作指导手册目录1,线路连接2,S oundCheck 界面3,打开喇叭测试序列4,频响曲线的测量5,对Hadware(硬件) 进行设置6,对仪器进行校准(Calibration)7,对Stimulus(激发信号)进行设置8,对 Acq play & record, (演示和记录) Ana Fundamental(基本曲线的分析)进行设置9,对Display (显示)进行设置10,对曲线进行平滑11,对曲线求平均12,界限的设置13,把一条标准喇叭的测试曲线设置为界限曲线14,制作一条黄金曲线15,测喇叭的THD(总谐波失真)和Rub & Buzz(磨擦峰鸣杂音) 16,测喇叭阻抗和谐振频率17,提示信息的编辑18,分频器的测量19,如何使参考曲线和要测量的曲线以及界限曲线都变成直线20,其它东源音响公司1,线路连接1,基本线路注意,声卡插孔在电脑里排列7 在最右,2 在最左。
2,前置放大器:Soundconnect此三个按钮1,3都调到“0”2调到 20dB接话筒后背接声卡3,功放用CROWN D-75A 型功放,使用时,放大量级(level)调到“0”的位置(即最大的位置),后板接到CH-1通道。
4,扬声器—MICMIC用 SCM-1 型。
连接到前置放大器的前面。
2,SoundCheck 界面启动,继续,重做耗时前缀编码测量次数序列名暂停2主界面下拉菜单注意setup 下拉菜单中的名称和意思。
Hardware (硬件设置) Calibration (仪器校准) Messages (信息设置)Stimulus (激发信号) Acquisition (数据采集) Analysis (数据分析)Recall (资料回叫) Post Processing (后处理) Limits (界限设置)Display (显示设置) Serial Number (系列号设置) Autosave(自动保存) Printing (打印设置) Assign Channel (通道安排) Sequence (序列设置) Memory List (储存列表)(版有)3打开喇叭测试序列。
人工智能应用导论实验手册-OCR实验手册

OCR实验手册4.3任务二:文字识别(OCR)4.3.1任务目标通过采用深度学习技进行对验证码进行图像识别,通过采用程序进行验证码生成进行数据集准备、采用opencv进行验证码分割、利用深度学习框架Keras进行模型搭建与训练、最后读取模型进行验证码识别,使读者能够:(1)体验一个完整的深度学习算法对验证码进行图像识别应用开发。
(2)掌握图像数据生成、处理、读取等操作。
(3)掌握使用深度学习框架进行模型搭建,训练与预测方法。
4.3.2任务实现本项目的主要流程:灰度→二值化→去干扰线及噪点→切割成单个字符→标注→识别学习并得到模型→使用模型识别。
对获得的原始验证码,处理流程总共分为以下几步:(1)对图片进行灰度处理,如图4-32。
图4-32 灰度处理(2)根据自己设置的阈值,对图片进行二值化处理。
图4-33 二值化处理(3)降噪处理,去除干扰的像素点及像素块。
图4-34 降噪处理(4)对图片进行切割,获得单个字符,并进行人工标注。
图4-35 图片分割(5)使用卷积神经网络进行模型训练,得到模型。
(6)使用训练得到的模型进行验证码识别。
步骤一:批量生成验证码在使用深度学习框架搭建验证码识别模型时,需要大量的验证码图片。
在这里,使用captcha模块生成验证码图片,验证码图片名称为验证码上显示的字符串。
验证码支持10个数字加26+26个大小写英文字母,一共62种字符类型。
通过运行程序在当前目录文件夹pic生成验证码。
运行代码:1gen_captcha.py,将使用代码生成随机验证码图像,运行程序后,在pic 文件夹中输出100张图像,如图4-36所示图4-36 验证码数据集步骤二:使用opencv看到验证码生成验证可以通过电脑的默认图片查看器查看,也可以用程序进行显示,这里采用opencv模板对图像进行读取与显示,同时还有打印图片的信息,例如图像宽高等。
代码路径:2show_img.pyimport cv2file_name = "./test_img/test_img_1.png"#读取图像img = cv2.imread(file_name)#图片大小信息print(img.shape)#显示验证码图片和验证码标题cv2.imshow("win", img)#窗口结束时间,如果为0,一直显示cv2.waitKey(0)运行效果如图4-37所示:图4-37 验证码显示步骤三:图像二值化处理由于验证码图像是四个字符,因此需要对这4个字符进行图像处理,完成分割,得到分别4个独立的字符,字符识别是对每个字符分别进行。
微视凌志相机

pylon Release Notes Version 2.3.0Document ID Number: AW00013312Revision Date: September 16, 2010Subject to Change Without Notice© Basler Vision TechnologiesInstallation InformationYou can find detailed information on installing the Basler pylon software in the Installation and Setup Guide for Cameras Used with Basler’s pylon API (AW000611xx000).You can download the guide free of charge from the Basler website atRestricted Compatibility of the APIThe programming interface for pylon 2.x is in some respects not backwards compatible with pylon 1.x. The pylon Programmer’s Guide and API Reference describes the modifications needed to rebuild an application that was developed using pylon 1.0.When updating an application from a pylon version older than pylon 2.2, the application's Visual Studio project settings must be adjusted with respect to the compiler include search path, linker library search path, and the linker's "Additional Dependencies" settings. References to the GENICAM_ROOT or GENICAM_ROOT_V1_1 environment variable must be replaced by the PYLON_GENICAM_ROOT variable introduced with the pylon 2.2 release. If the import libraries for pylon or GenICam are explicitly listed in the linker configuration settings of your project, these references should be removed since some of the libraries have been renamed. Your application should include the PylonIncludes.h header file rather than explicitely specify the import libraries. By including the PylonIncludes.h header file, the required import libraries will be linked to your application automatically. Refer to the "Building Applications with pylon" and "Migrating from Previous pylon Versions" sections of the pylon for Windows Programmer's Guide and API Reference document for detailed information about the required project settings. The Microsoft Windows 2000 operating system is no longer supported since pylon 2.2. Version 2.3.0New FeaturesRuntime•Support of Windows 7.C++ SDK•Improved device enumeration and device creation.When enumerating cameras a filter can be applied allowing to enumerate only devicesmatching given criteria. Refer to the "Applying a Filter when Enumerating Cameras"section in the "pylon Programmer's Guide and API Reference" help document. The"Creating Specific Cameras" section describes how to create devices by specifyingdevice properties like serial number or IP address.•Version of pylon can be retrieved at runtime.Use the GetPylonVersion() function to query the version of the pylon installation.The VersionInfo class serves as a helper class for comparing version numbers.•Camera classes used for camera configuration have been extended to support new camera features.•CPixelTypeMapper classThe CPixelTypeMapper class provides a mapping of camera specific pixel format values(e.g. "Mono8") to PixelType enum values (e.g. PixelType_Mono8).IEEE 1394 Transport Layer•Updated the camera description file for Basler cameras with IEEE 1394 interface.Camera features introduced with latest firmware versions are supported.Camera Link Transport Layer•Specifying maximum baud rate.Pylon will use the maximum possible baud rate reported by the Camera Link framegrabbers by default. For some frame grabbers however, the communication at higherbaud rates might be unreliable. The "probe device" functionality of the CL Configurator tool will test the reliability of the serial port currently probed. In case there are anycommunication errors it will repeat the test at lower baud rates, shows a warningmessage, and suggest lowering the maximum baud rate to ensure propercommunication.In addition, the CL Configurator tool provides a dialog for manually setting the maximum baud rate.•64-bit support for Camera Link.The 64-bit pylon installer installs both, a 32 bit and a 64 bit version of the TransportLayer. This allows operating Basler aviator cameras regardless whether the framegrabber manufacturer provides 32 bit or 64 bit versions of the DLLs required for theserial communication.Pylon Viewer• A 64 bit version of the pylon Viewer is available.The 64 bit version is required to access Camera Link cameras if the frame grabbermanufacturer provides only 64 bit versions of the DLLs required for the serialcommunication.•Save images as .tiff files.Grabbed images can be saved as .tiff files. Saving .tiff images with 16 bit per pixel issupported.Pylon NeuroCheck DriverFor NeuroCheck 6.0 a driver based on pylon is available. By installing pylon 2.3 and the pylon NeuroCheck driver Basler GigE and IEEE 1394 cameras are supported by the NeuroCheckapplication. The pylon NeuroCheck driver can be downloaded from the Basler website: When installed the assembly is now visible in the Add Reference dialog in Visual Studio 2010.Fixed BugsIEEE 1394 Transport Layer•Frequent bus resets could have caused an IEEE 1394 camera to stop grabbing or to disappear from the IEEE 1394 bus.•Occasionally grabbing images failed with a "Not enough storage is available to process this command" error.SDK•When compiling pylon applications using Microsoft Visual Studio 2010 you may have received compilation errors.•Including Basler1394Camera.h in your project prevented the delay loading of GCBase.DLL resulting in a Missing DLL error message when starting the application.•Fixed an issue where the installation of the Filter Driver on Windows 7 could have caused a bluescreen.•Closing the stream grabber or calling FinishGrab() without stopping the image acquisition caused the camera to stream data although the required resources werealready freed.•The camera's trigger settings were not saved to file.Installer•On 64 bit Windows 7 the installer always requested a reboot after installing IEEE 1394 drivers.•The installer occasionally hung when updating the environment.•After uninstalling the Direct Show filter it was still visible in the list of available Direct Show filters.Documentation•C++ camera class documentation: grouping of class members was broken.SpeedOMeter•The Speedometer occasionally hung when closed while grabbing was still active..Samples•The VB6 and .NET viewer samples did not display Bayer images correctly. Known RestrictionsInstallation of .NET features fails when .NET Framework is not already installedSynopsis: Installing the pylon .NET runtime and SDK features fails if there is no Framework 2.0 installed.Solution: Install the .NET 2.0 Framework. The installer can be downloaded from/downloads/details.aspx?displaylang=en&FamilyID=0856eacb-4362-4b0d-8edd-aab15c5e04f5.Note: Windows Vista or later have .NET 2.0 Framework preinstalled.The pylon::CLock and pylon::AutoLock Classes Are Deprecated Synopsis: These classes are also provided by the GenApi SDK which is part of the pylon SDK. For that reason, the pylon versions will be omitted in the next releases.Solution: If you are using the Pylon::CLock or the Pylon::AutoLock classes in your application, include the <genapi/Synch.h> file instead of <pylon/Synch.h> and use the GenApi::CLock and GenApi::AutoLock classes instead of the Pylon::CLock and Pylon::AutoLock classes. "missing driver" Error Message After Uninstalling pylonSynopsis: When you uninstall a previous pylon version (pylon 2.2 or earlier) you may get an error message stating that drivers for IEEE 1394 Camera/Generic Desktop Camera could not be found or installed. Windows may sometimes even ask for a driver disk.Solution: The error message is displayed because after the pylon setup has uninstalled its drivers for IEEE 1394 cameras, windows tries to restore the previous drivers for these cameras. You can safely ignore this message or click "Cancel" if Windows asks for a driver disk during uninstall.Missing pylon/GenICam DLLs when Starting pylon Viewer or Any Other Application Using pylonSynopsis: When the pylon installation is performed under the Administrator’s account, under some circumstances the changes of the environment variables don’t take effect immediately. This leads to error messages that pylon DLLs cannot be found when starting a pylon based application (e.g., the pylon Viewer complains about a missing PylonUtility_MD.dll).Workaround: When installing pylon as Administrator, log off and on again after the pylon installation is finished. After logging on again the environment changes become effective. Restrictions on 64 Bit Operating SystemsSynopsis: In general, due to limited hardware or operating system resources, it is not possible to enqueue an arbitrary number of image buffers at a time. For the IEEE 1394 camera driver, there are limitations due to restricted DMA resources provided by the OHCI chip sets. The actual amount of memory that can be fed into the driver’s input queues depends on the currently available amount of free physical memory below 4 GByte. For the GigE drivers there are similar restrictions.Feeding in too much memory will result in exceptions and can cause a high CPU load and an extremely reduced system performance.Solution: You can use an arbitrary amount of memory for grabbing, but you must not register and feed in all buffers into the driver’s input queue simultaneously (by using theRegisterBuffer()and QueueBuffer() methods). We recommend to register and enqueue sufficient memory buffers for receiving images for a certain period (e.g. 250 ms). Each time a filled buffer is retrieved from the driver’s output queue (by using the RetrieveResult() method), it can be deregistered (by using the DeregisterBuffer() method). Then, a new buffer can be registered and fed into the driver’s input queue. See the pylon Programmer’s Guide and API Reference for an explanation of the concepts of the queues for the drivers. Applications Using a Previous Version of pylon (pylon 2.2 or earlier) May Not CompileSynopsis: Applications using a previous pylon version (pylon 2.2 or earlier), may not compile when pylon 2.3 is used.Solution: For information on how to adjust the code, see the pylon Programmer’s Guide and API Reference.MFC Applications Report Memory LeaksSynopsis: In debug mode, MFC applications using the pylon API report a huge number of memory leaks.Workaround: The pylon runtime libraries free the reported memory blocks after the MFC memory tracking feature has dumped the assumed leaking memory leaks.Use the PylonTerminate() method to explicitly free memory resources allocated by the pylon runtime system. In order to terminate the application properly, call PylonTerminate()in the ExitInstance() method of your application object. Due to a design problem of the MFC memory tracking feature the memory leaks are dumped before DLLs like the pylon runtime libraries are unloaded/freed. This in turn frees global static data allocated by these DLLs. As a result, even after calling PylonTerminate(), the MFC memory tracking features reports false memory leaks. As a workaround the memory tracking feature can be disabled in the application’s InitInstance() method:BOOL CWinMyApp::InitInstance(){#ifdef _DEBUG// Disable tracking of memory for the scope of the InitInstance() AfxEnableMemoryTracking(FALSE);#endif // _DEBUG}Unable to See Multiple GigE Cameras in the pylon IP Configuration ToolSynopsis: When using multiple GigE cameras connected to more than one network adapter in your PC, not all cameras are listed in the pylon IP Configuration tool.Solution: When using multiple network adapters or multiport network adapters, ensure that for each adapter (network interface) a different subnet is configured. When two or more adapters are configured for the same subnet, GigE cameras cannot be found. Be aware that configuring more than one network adapter for automatic IP addressing, causes all these adapters to share the same subnet (169.245.255.255), and this will lead to non-discoverable GigE cameras. Unable to Establish a Connection to a GigE Camera Using a 100 MBit Network AdapterSynopsis: When using a 100 MBit network adapter with a GigE camera, a connection can only be established if the speed and duplex mode settings of the network adapter are set to Auto. Workaround: The Installation and Setup Guide for Cameras Used with Basler’s pylon API describes how to install the Basler network drivers and how to configure the network adapter. Ensure that the speed and duplex mode settings of the network adapter are set to Auto. Unable to Establish a Connection to a GigE Camera When Using Multiple Network Adapters (I)Synopsis: When multiple network adapters are used on one PC with multiple adapters included in the same subnet, connections to cameras cannot be established.Workaround: Assign fixed IP addresses to your network adapters. Ensure that each adapter is in a different subnet.Unable to Establish a Connection to a GigE Camera When Using Multiple Network Adapters (II)Synopsis: A connection to a camera cannot be established when more than one adapter is configured for automatic IP addressing.Workaround: Assign fixed IP addresses to your network adapters. Ensure that each adapter is in a different subnet.Unable to Establish a Connection to a GigE Camera When Using Debug LibrariesSynopsis: Using the debug version of the Pylon GigE transport layer library sets the heartbeat timeout to 5 minutes. This allows single stepping during the debugging without loosing theconnection to the camera. When restarting the program after an anomalous termination or after terminating the application in the debugger, no connection to the camera can be established. A Device is controlled by another application error message is issued.Workaround: Remove the network cable to the camera temporarily. If this is not convenient, a tool is available allowing to shutdown the connection to the camera after an application aborted. Contact Basler Technical support for obtaining the tool.GigE Camera Detection Fails If More than One Device Is Configured for AutoIP (e.g., if a Mobile Device Is Connected)Synopsis: An attached GigE camera configured for automatic IP addressing is not detected when a further device is also configured for automatic IP addressing, for example a mobile device such as a PDA using MS Active Sync®.Workaround: Assign fixed IP addresses to the camera and to the network adapter the camera is connected to. Make sure that the adapter and the camera are in the same subnet.GigE Camera UnreachableSynopsis: Camera is temporarily not reachable because the MS Windows® operating system adds an incorrect entry in the routing table when a camera is removed while a connection to it exists.Workaround: Use Microsoft’s route utility to detect and remove the incorrect route. The route print command shows all entries. Remove the entry to your camera using theroute delete <camera ip>command.Unable to Grab ImagesSynopsis: When pylon drivers for GigE and IEEE 1394 cameras are not installed, pylon based applications fail to grab images. A Failed to open stream grabber error message is issued. Workaround: Depending on whether you use GigE and/or IEEE 1394 cameras, install the appropriate pylon drivers as described in the Installation and Setup Guide for Cameras Used with Basler’s pylon API.Samples may report invalid PixelFormat enumeration value when using an ace cameraSynopsis: Some samples may report an invalid PixelFormat value when using an ace camera. Workaround: Some samples explicitly use the PixelFormat value “Mono16” which may not be supported by all ace cameras. Change all occurrences of “Mono16” to “Mono12” which is a pixel format supported by all ace cameras.Known BugsBluescreen may occur when uninstalling pylon softwareSynopsis: Uninstalling pylon software while an IEEE 1394 camera is connected to the IEEE 1394 bus may cause a bluescreen.Workaround: Make sure to unplug the plug of the IEEE 1394 cable from the camera before you start uninstalling pylon software. If you can not unplug the plug switch off camera power.IEEE 1394 Transport Layer: A Deadlock might occur when closing an IEEE 1394 camera while the camera still acquires images.Synopsis: If you close a 1394 camera while a acquisition is still active the Close() function may deadlock and not return.Workaround: Ensure that an AcquisitionStop command is issued before closing the camera device.Pylon Viewer: Process Hangs When Closing the ViewerSynopsis: Under some circumstances, the pylon Viewer process keeps running after closing the Viewer application. The GUI of the viewer is no longer visible, but the process is still visible in the task manager.Workaround: Currently, there is no workaround other than killing the process using the Windows task manager.GigE Filter Driver: Dropped FramesSynopsis: If the first packet of an image frame (the so-called data leader packet) is missed, the complete frame will be dropped since the filter driver generates no resend requests for this data leader packet.Workaround: Use a network adapter that is compatible with the performance driver. When the performance driver is used, a frame will be received even if its first packet was missed.When a compatible network adapter can not be used, optimize the transport layer parameters of the filter driver and reduce the network traffic. As a rule of thumb, set the packet size to its maximum. See also the camera User’s Manual and the Installation and Setup Guide for Cameras Used with Basler’s pylon API.GigE Filter Driver: RAS, VPN Is Not WorkingSynopsis: The RAS and VPN services do not work with the Basler filter driver.Workaround: Unbind the Pylon GigE Vision filter driver from the adapter that is used for the RAS and/or VPN service. Do not share a network connection between GigE Vision devices and the RAS and/or VPN service. How to unbind a filter driver is explained in the Installation and Setup Guide for Cameras Used with Basler’s pylon API.SpeedOMeter May Show Error Messages When Unplugging the Camera while Acquiring Images.Synopsis: When you start the SpeedOMeter, select a camera, press Start and unplug the camera you may get several error messages.Workaround: Press Stop to end the acquisition before unplugging the camera. Version 2.2.1New FeaturesSDK & Runtime•64 bit support for PylonC and API.IEEE 1394 Transport Layer•The device info objects contain valid serial numbers. In previous versions, the serial number of an IEEE1394 camera could only be retrieved after creating and opening apylon device object. With pylon 2.2.1, the serial number is available by just enumerating camera devices. The device info objects for IEEE 1394 cameras contain now the serial numbers. A serial number can be retrieved by calling theCDeviceInfo::GetSerialNumber() function. Note: The serial number information is only valid if the camera is not opened by an application when enumerating the device. Camera Link Transport Layer•Support of the aviator camera's Acquisition Status feature.Fixed BugsSDK•The assembly is not listed in the Visual Studio "Add Reference" dialog.• API: XML help is not available.•Including PylonGigEIncludes.h causes compiler errors (references to non-existing files).•PylonGigE DLL is not linked automatically (missing #pragma comment lib).•PylonUtilities DLL is not linked automatically. (missing pragma comment lib).•Missing #pragma comment lib for user32.dll and shell32.dll.•VS 2008: COMPILER define redefinition when not including PylonIncludes.h first.Installer•The GenICam x64 bin folder is not added to the PATH environment variable.•64 bit runtime redistributables for IEEE 1394 and for GigE cannot be installed.Camera Link Transport Layer•I/O errors during XML file download are ignored causing corrupted XML files added to the XML file cache.Camera Link Transport Layer and GigE Transport Layer•If the XML file download fails, an XML file stored in the file system is used.Direct Show / Twain•The tree view control does not respect increment constraints of certain camera features.Known RestrictionsFor the 2.2.1 release there are the same restrictions as for the 2.2.0 release (see below).Known BugsFor the 2.2.1 release there are the same known bugs as for the 2.2.0 release (see below).Version 2.2.0New FeaturesPylon•Support for the aviator Camera Link cameras. The pylon Viewer tool can be used to configure aviator cameras. In order to use aviator cameras, you must run theCLConfiguration tool to select the serial ports to be probed for aviator cameras. TheCLConfiguration tool will be automatically started when running the pylon Viewer for the first time.•Update to GenICam 2.0. With the newer GenICam version, the creation of pylon device objects is much faster than for previous pylon versions.•Facility to avoid conflicts with non-Basler software based on GenICam 2.0. The pylon installer no longer sets a system-wide GENICAM_ROOT_VX_Y and otherGenICam related environment variables. Setting these environment variables globallycould have influenced the installation of non-Basler software based on GenICam. Forbackward compatibility reasons, the pylon installer by default extends the PATHenvironment variable so that the GenICam DLLs shipped with pylon can be found atruntime. If that causes conflicts with non-Basler software, deselect or uninstall theExtend PATH Environment Variable feature. Refer to the "Delay Loading of DLLs andBootstrapping" section of the pylon for Windows API Reference and Programmer'sGuide document for more information about how pylon based applications set up theenvironment at runtime.SDK•Support for Camera Link. This release provides a new transport layer for aviator Camera Link cameras. This transport layer supports camera configuration only.Grabbing images with the Camera Link transport layer is not supported. To grab images use the API provided by your frame grabber manufacturer.•Pylon C API. Libraries and header files of the pylon C API are provided as an alternative to the pylon C++ API. As part of the installation procedure, a set of sample C programs is installed at <Program Files Folder>\Basler\Pylon 2.2\Samples\C. Projectfiles for Microsoft Visual Studio 6.0 and make files for the Borland C++ command-linecompiler are provided.•Pylon API. The pylon 2.2.0 installer installs a .NET assembly allowing to build pylon based applications using .NET languages. A set of C# sample programs isinstalled at <Program Files Folder>\Basler\Pylon 2.2\Samples\C#.•Pylon VB6 API. A type library for building pylon based applications with Visual Basic 6 is provided. A set of VB 6 sample programs is installed at <Program FilesFolder>\Basler\Pylon 2.2\Samples\VB.•IEEE 1394 Transport Layer•New camera configuration XML files for Basler FireWire cameras. New features introduced with the latest firmware updates are supported. The new XML files areoptimized to reduce delays when starting image acquisition.GigE Transport Layer•Support for ace cameras•Heartbeat timeout adjustable per environment variable. Refer to the "The pylon Programmer’s Guide and API Reference" document for more details. Fixed BugsPylon Viewer•The viewer crashes when collapsing the feature tree.•The viewer crashes when changing the user level.•Under some circumstances drop down boxes in the feature tree are not updated.Installer•Failed to detect older pylon installations.•Failed to uninstall network drivers.•Failed to install due to remaining network drivers from previous pylon installations. The pylon 2.2 installer now detects and removes remaining network drivers from previous installations.SDK•No delay loading possible due to exported string constants.GigE•Dead locks when closing a GigE device.•Failed to reopen a GigE event grabber.•Device discovery failed if there were no network interfaces enabled.•Device discovery failed if non-camera devices sent unexpected responses to device discovery requests.1394•Fixed handle leak in 1394 transport layer.•Memory leak when using chunk parser or event grabber.•Failed to set ExposureTimeBase feature for A102f, A31xf and A60xf cameras.Direct Show•Broken support of Bayer and YUV pixel formats.•AOI settings were reset when starting image acquisition.Known RestrictionsThe pylon Installer Requires the Microsoft .NET Framework 2.0 Synopsis: Installing the pylon .NET runtime and SDK features fails if there is no Framework 2.0 installed.Solution: Install the .NET 2.0 Framework. The installer can be downloaded from/downloads/details.aspx?displaylang=en&FamilyID=0856eacb-4362-4b0d-8edd-aab15c5e04f5.Windows Vista or higher have .NET 2.0 Framework preinstalled.The pylon::CLock and pylon::AutoLock Classes Are Deprecated Synopsis: These classes are also provided by the GenApi SDK which is part of the pylon SDK. For that reason, the pylon versions will be omitted in the next releases.Solution: If you are using the Pylon::CLock or the Pylon::AutoLock classes in your application, include the <genapi/Synch.h> file instead of <pylon/Synch.h> and use the GenApi::CLock and GenApi::AutoLock classes instead of the Pylon::CLock and Pylon::AutoLock classes."missing driver" Error Message After Uninstalling pylon 2.2Synopsis: When you uninstall pylon 2.2 you may get a message stating that drivers for 1394 Camera/Generic Desktop Camera could not be found or installed.Sometime Windows may even ask for a driver disk.Solution: This error message is displayed because after the plyon setup has uninstalled its drivers for 1394 cameras windows tries to restore the previous drivers for these cameras.You can safely ignore these messages or click "Cancel" if Windows asks for a driver disk during uninstall.When Installing as Administrator, Changes to the Environment Are not Effective ImmediatelySynopsis: When the pylon installation is performed under the Administrator’s account, under some circumstances the changes of the environment variables don’t take effect immediately. This leads to error messages that pylon DLLs cannot be found when starting a pylon based application (e.g., the pylon Viewer complains about a missing PylonUtility_MD.dll). Workaround: When installing pylon as Administrator, log off and on again after the pylon installation has been finished. After logging on again the environment changes become effective.Restrictions on 64 Bit Operating SystemsSynopsis: In general, due to limited hardware or operating system resources, it is not possible to enqueue an arbitrary number of image buffers at a time. For the IEEE 1394 camera driver, there are limitations due to restricted DMA resources provided by the OHCI chip sets. The actual amount of memory that can be fed into the driver’s input queues depends on the currently available amount of free physical memory below 4 GByte. For the GigE drivers there are similar restrictions.Feeding in too much memory will result in exceptions and can cause a high CPU load and an extremely reduced system performance.Solution: You can use an arbitrary amount of memory for grabbing, but you must not register and feed in all buffers into the driver’s input queue simultaneously (by using theRegisterBuffer()and QueueBuffer() methods). We recommend to register and enqueue sufficient memory buffers for receiving images for a certain period (e.g. 250 ms). Each time a filled buffer is retrieved from the driver’s output queue (by using the RetrieveResult() method), it can be deregistered (by using the DeregisterBuffer() method). Then a new buffer can be registered and fed into the driver’s input queue. See the Programmer’s Guide and API Reference for an explanation of the concepts of the queues for the drivers. Applications Using an Old pylon Version May Not CompileSynopsis: Current applications using a pylon version older than pylon 2.0, may not compile when pylon 2.2 is used.Solution: For information on how to adjust the code, see the Programmer’s Guide and API Reference.MFC Applications Report Memory LeaksSynopsis: In debug mode, MFC applications using the pylon API report a huge number of memory leaks.。
NuttX OS意识型监控手册说明书

OS Awareness Manual NuttX Release 09.2023TRACE32 Online HelpTRACE32 DirectoryTRACE32 IndexTRACE32 Documents ......................................................................................................................OS Awareness Manuals ................................................................................................................OS Awareness Manual NuttX (1)Overview (3)Brief Overview of Documents for New Users3 Supported Versions4Configuration (5)Quick Configuration Guide6 Hooks & Internals in NuttX6Features (7)Display of Kernel Resources7 Task Stack Coverage7 Task-Related Breakpoints8 Task Context Display9 Dynamic Task Performance Measurement9 Task Runtime Statistics10 Function Runtime Statistics11 NuttX specific Menu12NuttX Commands (13)TASK.Task Display tasks13 TASK.BuiLTinAPP Display built-in applications13NuttX PRACTICE Functions (14)TASK.CONFIG()OS Awareness configuration information14Version 09-Oct-2023 OverviewThe OS Awareness for NuttX contains special extensions to the TRACE32 Debugger. This manualdescribes the additional features, such as additional commands and statistic evaluations.Brief Overview of Documents for New UsersArchitecture-independent information:•“Training Basic Debugging” (training_debugger.pdf): Get familiar with the basic features of a TRACE32 debugger.•“T32Start” (app_t32start.pdf): T32Start assists you in starting TRACE32 PowerView instances for different configurations of the debugger. T32Start is only available for Windows.•“General Commands” (general_ref_<x>.pdf): Alphabetic list of debug commands.Architecture-specific information:•“Processor Architecture Manuals”: These manuals describe commands that are specific for the processor architecture supported by your Debug Cable. T o access the manual for your processorarchitecture, proceed as follows:-Choose Help menu > Processor Architecture Manual.•“OS Awareness Manuals” (rtos_<os>.pdf): TRACE32 PowerView can be extended for operating system-aware debugging. The appropriate OS Awareness manual informs you how to enable theOS-aware debugging.Supported VersionsCurrently NuttX is supported for the following versions:•All NuttX versions on ARM/Cortex.ConfigurationThe TASK.CONFIG command loads an extension definition file called “nuttx.t32” (directory“~~/demo/<processor>/kernel/nuttx”). It contains all necessary extensions.Automatic configuration tries to locate the NuttX internals automatically. For this purpose all symbol tables must be loaded and accessible at any time the OS Awareness is used.If you want to have dual port access for the display functions (display “On The Fly”), you have to mapemulation or shadow memory to the address space of all used system tables.For system resource display and trace functionality, you can do an automatic configuration of the OSAwareness. For this purpose it is necessary that all system internal symbols are loaded and accessible at any time, the OS Awareness is used. Each of the TASK.CONFIG arguments can be substituted by '0', which means that this argument will be searched and configured automatically. For a fully automatic configuration omit all arguments:TASK.CONFIG nuttx.t32Quick Configuration GuideTo get a quick access to the features of the OS Awareness for NuttX with your application, follow this roadmap:1.Copy the files “nuttx.t32” and “nuttx.men” to your project directory.(from TRACE32 directory “~~/demo/<processor>/kernel/nuttx”).2.Start the TRACE32 Debugger.3.Load your application as usual.4.Execute the command:TASK.CONFIG nuttx.t32See “Configuration”.5.Execute the command:MENU.ReProgram nuttx.menSee “NuttX Specific Menu”.6.Start your application.Now you can access the NuttX extensions through the menu.In case of any problems, please carefully read the previous Configuration chapter.Hooks & Internals in NuttXNo hooks are used in the kernel.For detecting the current running task, the kernel symbol “g_readytorun” is used.For retrieving the kernel data structures, the OS Awareness uses the global kernel symbols and structure definitions. Ensure that access to those structures is possible every time when features of the OSAwareness are used.FeaturesThe OS Awareness for NuttX supports the following features.Display of Kernel ResourcesThe extension defines new commands to display various kernel resources. Information on the following NuttX components can be displayed:TASK.Task Display tasksTASK.BuiLTinApp Display the built-in application within NuttX imageFor a detailed description of each command, refer to chapter “NuttX Commands”.When working with emulation memory or shadow memory, these resources can be displayed “On The Fly”,i.e. while the target application is running, without any intrusion to the application. If using this dual portmemory feature, be sure that emulation memory is mapped to all places where NuttX holds its tables.When working only with target memory, the information will only be displayed if the target application is stopped.Task Stack CoverageFor stack usage coverage of tasks, you can use the TASK.STacK command. Without any parameter, this command will open a window displaying with all active tasks. If you specify only a task magic number as parameter, the stack area of this task will be automatically calculated.T o use the calculation of the maximum stack usage, a stack pattern must be defined with the command TASK.STacK.PATtern (default value is zero).T o add/remove one task to/from the task stack coverage, you can either call the TASK.STacK.ADD or TASK.STacK.ReMove commands with the task magic number as the parameter, or omit the parameter and select the task from the TASK.STacK.* window.It is recommended to display only the tasks you are interested in because the evaluation of the used stack space is very time consuming and slows down the debugger display.Task-Related BreakpointsAny breakpoint set in the debugger can be restricted to fire only if a specific task hits that breakpoint. This is especially useful when debugging code which is shared between several tasks. T o set a task-relatedbreakpoint, use the command:Break.Set<address>|<range>[/<option>] /TASK <task>Set task-related breakpoint.•Use a magic number, task ID, or task name for <task>. For information about the parameters, see “What to know about the Task Parameters” (general_ref_t.pdf).•For a general description of the Break.Set command, please see its documentation.By default, the task-related breakpoint will be implemented by a conditional breakpoint inside the debugger.This means that the target will always halt at that breakpoint, but the debugger immediately resumesexecution if the current running task is not equal to the specified task.NOTE:T ask-related breakpoints impact the real-time behavior of the application.On some architectures, however, it is possible to set a task-related breakpoint with on-chip debug logic that is less intrusive. T o do this, include the option /Onchip in the Break.Set command. The debugger then uses the on-chip resources to reduce the number of breaks to the minimum by pre-filtering the tasks.For example, on ARM architectures: If the RTOS serves the Context ID register at task switches, and if the debug logic provides the Context ID comparison, you may use Context ID register for less intrusive task-related breakpoints:eContextID ON Enables the comparison to the whole Context ID register.Break.CONFIG.MatchASID ON Enables the comparison to the ASID part only.TASK.List.tasks If TASK.List.tasks provides a trace ID (traceid column), thedebugger will use this ID for comparison. Without the trace ID,it uses the magic number (magic column) for comparison.When single stepping, the debugger halts at the next instruction, regardless of which task hits thisbreakpoint. When debugging shared code, stepping over an OS function may cause a task switch and coming back to the same place - but with a different task. If you want to restrict debugging to the current task, you can set up the debugger with SETUP.StepWithinTask ON to use task-related breakpoints for single stepping. In this case, single stepping will always stay within the current task. Other tasks using the same code will not be halted on these breakpoints.If you want to halt program execution as soon as a specific task is scheduled to run by the OS, you can use the Break.SetTask command.Task Context DisplayY ou can switch the whole viewing context to a task that is currently not being executed. This means that all register and stack-related information displayed, e.g. in Register, Data.List, Frame etc. windows, will refer to this task. Be aware that this is only for displaying information. When you continue debugging theapplication (Step or Go), the debugger will switch back to the current context.T o display a specific task context, use the command:Frame.TASK[<task>]Display task context.•Use a magic number, task ID, or task name for <task>. For information about the parameters, see “What to know about the Task Parameters” (general_ref_t.pdf).•To switch back to the current context, omit all parameters.T o display the call stack of a specific task, use the following command:Frame /Task <task>Display call stack of a task.If you’d like to see the application code where the task was preempted, then take these steps:1.Open the Frame /Caller /Task<task> window.2.Double-click the line showing the OS service call.Dynamic Task Performance MeasurementThe debugger can execute a dynamic performance measurement by evaluating the current running task in changing time intervals. Start the measurement with the commands PERF.Mode TASK and PERF.Arm, and view the contents with PERF.ListTASK. The evaluation is done by reading the ‘magic’ location (= current running task) in memory. This memory read may be non-intrusive or intrusive, depending on the PERF.METHOD used.If PERF collects the PC for function profiling of processes in MMU-based operating systems(SYStem.Option.MMUSPACES ON), then you need to set PERF.MMUSPACES, too.For a general description of the PERF command group, refer to “General Commands Reference Guide P” (general_ref_p.pdf).Task Runtime StatisticsNOTE:This feature is only available, if your debug environment is able to trace taskswitches (program flow trace is not sufficient). It requires either an on-chip tracelogic that is able to generate task information (eg. data trace), or a softwareinstrumentation feeding one of TRACE32 software based traces (e.g. FDX orLogger). For details, refer to “OS-aware Tracing” (glossary.pdf).Based on the recordings made by the Trace (if available), the debugger is able to evaluate the time spent ina task and display it statistically and graphically.T o evaluate the contents of the trace buffer, use these commands:Trace.List List.TASK DEFault Display trace buffer and task switchesTrace.STATistic.TASK Display task runtime statistic evaluationTrace.Chart.TASK Display task runtime timechartTrace.PROfileSTATistic.TASK Display task runtime within fixed time intervalsstatisticallyTrace.PROfileChart.TASK Display task runtime within fixed time intervals ascolored graphTrace.FindAll Address TASK.CONFIG(magic) Display all data access records to the “magic”locationTrace.FindAll CYcle owner OR CYcle context Display all context ID records The start of the recording time, when the calculation doesn’t know which task is running, is calculated as “(unknown)”.All kernel activities up to the task switch are added to the calling task.Function Runtime StatisticsNOTE:This feature is only available, if your debug environment is able to trace taskswitches (program flow trace is not sufficient). It requires either an on-chip tracelogic that is able to generate task information (eg. data trace), or a softwareinstrumentation feeding one of TRACE32 software based traces (e.g. FDX orLogger). For details, refer to “OS-aware Tracing” (glossary.pdf).All function-related statistic and time chart evaluations can be used with task-specific information. The function timings will be calculated dependent on the task that called this function. T o do this, in addition to the function entries and exits, the task switches must be recorded.T o do a selective recording on task-related function runtimes based on the data accesses, use the following command:; Enable flow trace and accesses to the magic locationBreak.Set TASK.CONFIG(magic) /TraceDataT o do a selective recording on task-related function runtimes, based on the Arm Context ID, use the following command:; Enable flow trace with Arm Context ID (e.g. 32bit)ETM.ContextID 32T o evaluate the contents of the trace buffer, use these commands:Trace.ListNesting Display function nestingTrace.STATistic.Func Display function runtime statisticTrace.STATistic.TREE Display functions as call treeTrace.STATistic.sYmbol /SplitTASK Display flat runtime analysisTrace.Chart.Func Display function timechartTrace.Chart.sYmbol /SplitTASK Display flat runtime timechartThe start of the recording time, when the calculation doesn’t know which task is running, is calculated as “(unknown)”.All kernel activities up to the task switch are added to the calling task.NuttX specific MenuThe menu file “nuttx.men” contains a menu with NuttX specific menu items. Load this menu with theMENU.ReProgram command.Y ou will find a new menu called NuttX.•The Display menu items launch the kernel resource display windows.•The Stack Coverage submenu starts and resets the NuttX specific stack coverage and provides an easy way to add or remove tasks from the stack coverage window.In addition, the menu file (*.men) modifies these menus on the TRACE32 main menu bar:•The Trace menu is extended. In the List submenu, you can choose if you want a trace list window to show only task switches (if any) or task switches together with default display.•The Perf menu contains additional submenus for task runtime statistics, task-related function runtime statistics or statistics on task states.NuttX CommandsTASK.TaskDisplay tasksDisplays detailed information about the tasks.“magic” is a unique ID, used by the OS Awareness to identify the task.TASK.BuiLTinAPPDisplay built-in applicationsDisplays the built-in applications within the NuttX image with detailed information.Format:TASK.Task Format:TASK.BuiLTinAPPNuttX PRACTICE FunctionsThere are special definitions for NuttX specific PRACTICE functions.TASK.CONFIG()OS Awareness configuration information Syntax:TASK.CONFIG(magic | magicsize)Parameter and Description:magic Parameter Type: String (without quotation marks).Returns the magic address, which is the location that contains thecurrently running task (i.e. its task magic number).magicsize Parameter Type: String (without quotation marks).Returns the size of the task magic number (1, 2 or 4).Return Value Type: Hex value.。
Neuroscan开放实验申请表【模板】

分析参数:数字滤波__0-16Hz___,排除眨眼伪迹的方法__自动___,伪迹标准_±80μV_,基线校正_-200-0ms__
5.被试要求:
年龄范围_________利手_____性别______双眼矫正视力_______被试来源________________________
Neuroscan开放实验申请表
申请人
所属单位
联系电话
使用仪器名称
实验助理
Neuruscan
实际记录时间
脑电记录人数
被试预算
具体实验起止时间
1.实验名称:
2.实验目的:
3.刺激材料:
类型:图片、文字、声音其他
文件名:存放文件夹路径:
来源及编制方法:
刺激程序软件:STIME-prime其他(请注明)
4.记录参数设置:务设置:
被试反应:
7.实验指导语
8.实验预期
行为实验结果:
Neuruscan实验结果:
9.实验研究设计的讨论情况:
课题负责人签字:
批准日期:年月日
10.中心伦理和人体委员会评审意见
伦理和人体委员会负责人签字:
批准日期:年月日
11.脑电实验室平台学术委员会专家组评审意见
学术委员会负责人签字:
神经系统查体图文详解

神经系统查体详解之马矢奏春创作神经系统检查(一)一般检查一般检查主要是检查病人的意识状态.通过与病人交谈并检查病人对外界安慰的反应而进行评价.意识状态可分为以下几类:1.清醒状态(clear-headed state) 被检查者对自身及周围环境的认识能力良好,应包括正确的时间定向、地址定向和人物定向.当问诊者问及姓名、年龄、地址、时刻等问题时,被检查者能做出正确回答.2.嗜睡状态(somnolence state) 意识清晰度降低为主的意识障碍的一种形式.指病人意识清醒水平降低较轻微,呼叫或推动病人肢体,病人可立即清醒,并能进行一些简短而正确的交谈或做一些简单的举措,但安慰一消失又入睡.此时,病人吞咽、瞳孔、角膜等反射均存在.3.意识模糊(confusion) 指病人意识障碍的水平较嗜睡深,对外界安慰不能清晰地认识;空间和时间定向力障碍;理解力、判断力痴钝,或发生毛病;记忆模糊、近记忆力更差;对现实环境的印象模糊不清、常有思维不连贯,思维活动痴钝等.一般来说,病人有时间和地址定向障碍时,即称为意识模糊.4.昏睡状态(stupor state) 意识清晰度降低较意识模糊状态为深.呼喊或推动肢体不能引起反应.用手指压迫病人眶上缘内侧时,病人面部肌肉(或针刺病人手足)可引起防御反射.此时,深反射亢进、震颤及不自主运动,角膜、睫毛等反射减弱,但对光反射仍存在.5.浅昏迷(superficial coma) 指病人随意运动丧失,呼之不应,对一般安慰全无反应,对强疼痛安慰如压眶、压甲根等有反应,浅反射消失,腱反射、舌咽反射、角膜反射、瞳孔对光反射存在,呼吸、脉搏无明显变动.见于重症脑血管病、脑炎、脑脓肿、脑肿瘤、中毒、休克早期、肝性脑病等.6.深昏迷(deep coma) 指病人对各种安慰均无反应,完全处于不动的姿势,角膜反射和瞳孔对光反射均消失,年夜小便失禁,呼吸不规则,血压下降,此时可有去年夜脑强直现象.后期病人肌肉松弛,眼球固定,瞳孔散年夜,濒临死亡.见于肝性脑病,肺性脑病,脑血管病,脑肿瘤,脑外伤,严重中毒,休克晚期等.去脑强直去皮层强直7.谵妄(delirium) 一种急性意识障碍,暗示为定向障碍、错觉、幻觉、情绪不稳、行为紊乱等,有时可有片断的妄想.症状常暗示日轻夜重的摆荡.患者有时白天嗜睡、夜间吵闹.由于受到错觉或幻觉的影响,患者可发生自伤或伤人的行为.可由多种原因引起,罕见的有中毒、感染、外伤、严重代谢或营养障碍等.神经系统检查(二)脑神经检查脑神经检核对颅脑损害的定位诊断极有意义.脑神经共有12对,检查脑神经应按先后顺序进行,以免重复和遗漏.一.嗅神经检查(olfactory nerve examination)嗅觉的灵敏度可通过问诊了解.1.检查方法:嘱病人闭目,并用手指压住一侧鼻孔,然后用醋、酒、茶叶、牙膏等带有气味的物品分别放于鼻孔前,让病人说出所嗅到的气味.同法检核对侧.嗅觉正常时可明确分辨出测试物品的气味.嗅神经检查2.临床意义:如一侧嗅觉减退或丧失,则为同侧的嗅球、嗅束、嗅丝的损害.见于创伤、前颅凹占位病变、颅底脑膜结核等.鼻粘膜炎症或萎缩亦可呈现嗅觉障碍.二.视神经检查(optic nerve examination)包括视力、视野和眼底检查.1.视力检查(vision examination)2.视野检查(visual field examination)视野是指患者正视前方,眼球不动时所能看到的范围.(1)检查方法一般可先用手试法,分别检查两侧视野.嘱病人背光与医师对坐,相距约为60~100cm,各自用手遮住相对眼睛(病人遮左眼,医师遮右眼),对视片刻,坚持眼球不动,医师用手指分别自上、下、左、右由周边向中央慢慢移动,注意手指位置应在检查者与病人之间,如医师视野正常,病人应与检查者同时看得手指,如病人视野变小或异常时应进一步作视野计检查.视野测定-对比法(2)临床意义视野的异常改变提示视神经通路的损害,对定位诊断有重要意义.视通路及对光反射途径3.眼底检查(ocular fundus examination)三.动眼神经检查oculomotor nerve examination)动眼神经支配提睑肌、上直肌、下直肌、内直肌及下斜肌的运动,检查时如发现上睑下垂,眼球向内、上、下方向活动受限,均提示有动眼神经麻痹.左动眼神经麻痹四.滑车神经检查(trochlear nerve examination)滑车神经支配眼球的上斜肌,如眼球向下及外展运动减弱,提示滑车神经有损害.滑车神经检查五.三叉神经检查(trigeminal examination)三叉神经具有运动与感觉两种功能.检查内容包括面部感觉检查、运动功能检查、角膜反射检查及下颌反射检查.1.面部感觉检查医师用针、棉签及盛有冷、热水的试管分别检查面部三叉神经分布区域(前额、鼻部两侧及下颌)内皮肤的痛觉、触觉及温度觉,两侧比较.观察有无减退、消失或过敏.面部感觉检查2.运动功能检查医师将双手置于病人两侧下颌角上面嚼肌隆起处,嘱病人作咀嚼举措,即可比较两侧嚼肌力量强弱的不同.也可将一手置于病人的颊下向上用力,然后嘱病人作张口举措,以感触张口举措时的肌力.正凡人两侧翼内、外肌肌力相等,张口时下颌位于中间而无偏斜.当一侧三叉神经运动支损害时,张口时下颌偏向病侧.检查时可嘱病人张口,以上下门齿的中缝为标识表记标帜,观察下颌有无偏斜.咀嚼肌肌力检查方法翼肌肌力检查3.角膜反射检查角膜反射检查法4.下颌反射检查下颌反射检查法六.展神经检查(abduct nerve examination)右外展神经麻痹检查法展神经支配眼球的外直肌,检查时将目标物分别向左右两侧移动,观察眼球向外转动情况.展神经受损时眼球外展障碍.七.面神经检查(facial nerve examination)包括运动和味觉检查两部份.1.运动首先观察病人在宁静、说话和做脸色举措时有无双正面肌的分歧毛病称,例如睑裂、鼻唇沟及口角两侧是否对称.其次可嘱病人作皱眉、闭眼、露齿、鼓腮或吹口哨等举措,观察左右两则不同.受损时患侧举措有障碍,罕见于面神经瘫痪及脑血管病变.面部脸色肌检查周围性面瘫面神经瘫示意图2.味觉味觉检查准备分歧的试液(如糖水、盐水、醋酸溶液等),嘱患者伸舌,检查者以棉签分别依次蘸取上述试液,轻涂于患者舌面上,让其辩味.每试一侧后即需漱口,两侧分别试之.面神经损害时舌前2/3味觉丧失.八.位听神经检查(auditory nerve examination)1.听力检查粗略的检查可用耳语、表音或音叉,准确的检查需借助电测听计.听力的音叉试验检查表声试验韦伯试验检查法任内试验2.前庭功能检查询问病人有否眩晕,夜行困难;观察病人有否眼球震颤等,若有以上症状需考虑耳蜗及前庭神经病变.闭目行走试验行走试验变位性眼震检查法闭目难立征眼震检查指指试验旋转试验原地踏步试验九.舌咽神经检查(glossopharyngeal nerve examination)舌咽神经检查检查时嘱病人张口,先观察腭垂是否居中,两侧软腭高度是否一致,然后嘱病人发“ā”音,观察两侧软腭上抬是否有力、腭垂是否偏斜等,若病人有吞咽困难,饮水呛咳等,见于Guillain-Barre综合征、脑干病变或鼻咽癌脑转移等.十.迷走神经检查(vagus nerve examination)迷走神经有许多功能与舌咽神经密切结合,检查时嘱病人张口发“ā”音,若一侧软腭不能随之上拾及腭垂偏向健侧,则为迷走神经麻痹的暗示.十一.副神经检查(accessory nerve examination)副神经主要支配胸锁乳突肌和斜方肌,前者主要作用是向对侧转颈,后者作用为耸肩.检查时,需注意观察有无萎缩,有无斜颈及垂肩等.检测肌力的方法是:医师将一手置于病人腮部,嘱病人向该侧转头以测试胸锁乳突肌的收缩力,然后将两手放在病人双肩上下压,嘱病人作对立性抬肩举措.若力量减弱见于副神经损伤、肌萎缩、脊髓侧索硬化、后颅凹肿瘤等.十二.舌下神经检查(hypoglossal nerve examination)舌下神经检查支配同侧舌肌,其作用是伸舌向前,并推向对侧.检查时嘱病人伸舌,观察有无舌偏斜,舌缘两侧厚薄不相等及颤抖等.呈现以上现象提示舌下神经核病变,舌向一侧偏斜罕见于脑血管病变.舌下神经舌下神经检查舌下神经瘫示意图神经系统检查(三)运动功能检查运动功能年夜体可分随意和不随意运动两种.随意运动由锥体束司理,不随意运动(不自主运动)由锥体外系和小脑系司理.本部份检查包括随意运动与肌力、肌张力、不随意运动、共济运动等.一、随意运动与肌力(一)随意运动是指意识支配下的举措,随意运动功能的丧失称为瘫痪.由于暗示分歧,在水平上可分为完全性及不完全性(轻)瘫,在形式上又可分为单瘫、偏瘫、截瘫及交叉瘫痪.1.偏瘫(hemiplegia)为一侧肢体随意运动丧失,并陪伴同侧中枢性面瘫及舌瘫.见于脑出血、脑动脉血栓形成、脑栓塞、蛛网膜下腔出血、脑肿瘤等.2.单瘫(monoplegia)为单一肢体的随意运动丧失,多见于脊髓灰质炎.3.截瘫(paraplegia)多为双侧下肢随意运动丧失,是脊髓横贯性损伤的结果,见于脊髓外伤、脊髓炎、脊椎结核等.内囊病变引起偏瘫4.交叉瘫(crossed paralysis)为一侧脑神经损害所致的同侧周围性脑神经麻痹及对侧肢体的中枢性偏瘫.5.四肢瘫见于高位(颈段)脊髓横断.(二)肌力(myodynamia)指肢体作某种主动运动时肌肉最年夜的收缩力.除肌肉的收缩力量外,还可以举措的幅度与速度衡量.1.肌力分级肌力年夜小水平分六级.0级:肌肉完全麻痹,通过观察及触诊肌肉完全无收缩力;Ⅰ级:病人主动收缩肌肉时,虽然有收缩,但不能带动关节活动;Ⅱ级:肌肉活动可以带动水平方向的关节活动,但不能对立地心引力;Ⅲ级:对立地心引力时关节仍能主动活动,但不能对立阻力;Ⅳ级:能抗较年夜的阻力,但比正常者为弱;Ⅴ级:正常肌力.2.肌力测定方法肌肉肌力检查方法是嘱被检查者依次作上下肢各关节屈伸运动,同时检查者给予适当阻力,以发现肌力是否正常、减退或瘫痪.下面列举脊髓各节段支配的主要肌肉肌力测定方法:(1)颈丛支配的主要肌肉肌力检查1)菱形肌患者两手叉腰使肘关节向后用力,肩胛内收,检查者给予阻抗并沿脊柱缘触摸肌肉.菱形肌肌力试验2)冈上肌患者肩外展15°时,检查者给予阻抗,并在冈上窝处触摸收缩的肌肉.冈上肌肌力检查法3)冈下肌患者肘关节屈曲后再使前臂外旋,并在冈下窝处触摸此肌.冈下肌肌力检查法4)胸年夜肌上臂平举状态下强力内收,检查者给予阻抗.胸年夜肌肌力试验5)背阔肌使上举之臂放至水平位,检查者给予阻抗,或使臂下垂向后伸并给予阻抗,触摸在肩胛下角处收缩的肌肉.背阔肌肌力检查6)三角肌抬臂至水平位(由15°至90°)并给予阻抗.三角肌的三个部份及其作用三角肌肌力试验7)肱二头肌屈前臂并使之外旋,检查者给予阻抗.肱二头肌肌力检查8)肱三头肌屈前臂后再伸直,检查者给予阻抗.肱三头肌肌力试验9)拇长伸肌患者拇指末节伸直,检查者给予阻抗.拇长伸肌肌力试验10)拇长展肌患者拇指外展并稍伸直,检查者从第一掌骨外侧给予阻抗.拇长展肌肌力试验11)拇长屈肌患者拇指末节屈曲,检查者给予阻抗.拇长屈肌肌力试验12)指浅屈肌患者屈曲第2-5指的中节,检查者给予阻抗.指浅屈肌肌力试验13)桡侧腕屈肌患者屈腕及外展,检查者给予阻抗,并于桡腕关节处触摸紧张的肌腱.桡侧腕屈肌肌力试验14)尺侧腕屈肌患者屈曲并内收腕部,检查者给予阻抗,并触摸收缩的肌肉及肌腱.尺侧腕屈肌肌力试验15)小指展肌患者小指外展,检查者给予阻抗.小指展肌肌力试验(2)腰丛支配的主要肌肉肌力检查1)髂腰肌患者仰卧位,使髋关节屈曲,检查者给予阻抗.髂腰肌肌力试验2)股四头肌患者仰卧位,膝关节与髋关节屈曲,然后伸直小腿.股四头肌肌力试验(3)骶丛支配的主要肌肉肌力检查1)臀年夜肌患者俯卧,小腿屈曲后抬年夜腿使膝关节离床面,检查者给予阻抗.臀年夜肌肌力试验2)股二头肌患者仰卧,先将膝关节与髋关节屈曲抬起,然后再强力屈膝,检查者给予阻抗.股二头肌肌力试验3)胫骨前肌患者足伸直,内收并提举足内缘,检查者给予阻抗,并触摸收缩的肌肉胫骨前肌肌力试验4)拇长伸肌患者拇指伸直,检查者给予阻抗,并触摸紧张的肌腱.拇长伸肌肌力试验5)趾长伸肌患者伸直第2-5趾的近端趾节,检查者给予阻抗,并触摸紧张的肌腱.趾长伸肌肌力试验6)腓肠肌患者仰卧位,使足跖屈,检查者给予阻抗.腓肠肌肌力试验3.肌力测定的临床意义通过检查肢体肌力,可以估计神经系统或肌肉损害的水平、范围及其分布情况.神经系统疾患(如年夜脑半球、脊髓或周围神经损害)罕见到某个肌肉或肌群呈现分歧水平的肌力减弱或瘫痪.外科病中如骨折或其他骨关节病亦可引起相应肌肉群的废用性萎缩.各种肌病如重症肌无力、进行性肌营养不良症等也可呈现肌力改变.另外肌无力或瘫痪亦可见于低钾血症.二、肌张力(muscular tone)指肌肉静止松弛状态下的紧张度. (一)检查方法在病人肌肉松弛时,医生的双手握住病人肢体,用分歧的速度和幅度,反复作主动的伸屈和旋转运动,感到的轻度阻力就是这一肢体有关肌肉的张力.以同样方法进行各个肢体及关节的主动运动,并作两侧比力.其次用手触摸肌肉,从其硬度中亦可测知其肌张力.(二)肌张力改变及其临床意义1.肌张力增高肌肉坚硬,主动运动阻力增年夜,关节运动范围缩小.可暗示为痉挛性或强直性.肌张力增高时的下肢外展角(1)痉挛性肌张力增高在主动运动开始时阻力较年夜,终末时突感减弱,称为折刀(clasp knife)现象,见于锥体束损害.(2)强直性肌张力增高指一组拮抗肌群的张力均增加,作主动运动时,伸肌与屈肌的肌张力同等增强,如同弯曲铅管,故称铅管样强直,见于锥体外系损害.如在强直性肌张力增强的基础上又陪伴震颤,当作主动运动时可呈现齿轮抑扬样感觉,称齿轮强直(cogwheel rigidity).2.肌张力减弱肌肉缓和松软,主动运动时阻力减退或消失,关节运动范围扩年夜,有时呈过度屈伸现象.见于周围神经、脊髓前角灰质及小脑病变等.肌张力降低时关节过度屈伸现象三、不随意运动(involuntary movement) 亦称不自主运动.指病人不能随意控制的无目的的异常举措.(一)检查方法及内容不自主运动的检查主要依靠视诊.应着重注意其部位、时间、幅度及节律、运动形式是均匀一致还是变动多端等.并直接观察或询问随意运动、情绪紧张、姿势、睡眠、转移注意力、宁静休息、疲劳等对不自主运动的影响,进而确定其不自主运动的类型.(二)罕见类型不自主运动的暗示类型见有肌束颤抖、震颤、手足搐搦、手足徐动症、舞蹈样运动、摸空症、扭转痉挛、肌阵挛等.1.肌束颤抖(fasciculation)指病人身体某处肌肉呈现细小快速的或蠕动样的颤抖.可用叩诊槌轻度叩打肌肉诱发.它是下运动神经元损害的重要体征,常作为神经原性肌萎缩与肌原性肌萎缩的鉴别依据.可见于下运动神经元变性所致的继发肌萎缩,如肌萎缩性侧束硬化症、进行性脊肌萎缩症,进行性延髓麻痹等.亦可见于其它各种下运动神经元疾患,如脊髓空洞症、脊髓灰质炎、髓内或髓外肿瘤.2.震颤(tremor)一种不自主而有节律、交替的细小颤动.根据震颤与随意运动的关系分为(1)静止性震颤指病人在清醒宁静状态下,身体某部份有一系列不随意的较有规律的颤动,睡眠时震颤消失.静止性震颤时手可呈搓丸样震颤抖作,此种震颤可与其它类型的震颤合并呈现.典范的静止性震颤见于帕金森病及综合征,肝豆状核变性、特发性震颤等.(2)举措性震颤可为姿势性震颤或意向性震颤,前者病人在坚持某个姿势时呈现震颤,静止时则消失;后者在举措时呈现,在举措终末,愈近目的物时愈明显.见于小脑疾患、扑翼样震颤及酒精、汞、烟酸等药物中毒.亦可见于慢性肝病、早期肝昏迷.(3)老年性震颤常暗示为颔首或摇头举措,一般不陪伴肌张力的改变.与震颤麻痹相似,但多见于老年动脉硬化患者.另外,手指的细微震颤,罕见于甲状腺功能亢进.3.手足搐搦(tetany)发作时手足肌肉呈紧张性痉挛,在上肢暗示为腕部屈曲、手指伸展、指掌关节屈曲、拇指内收靠近掌心并与小指相对,形成“助产士手(obstetrician hand)”.在下肢时暗示为踝关节与趾关节皆呈屈曲状.在发作间隙时可作激发试验,即在患者前臂缠以血压计袖带,然后充气使水银柱达舒张压以上,继续4分钟呈现搐搦时称为Trousseau征阳性.见于低钙血症和碱中毒.手抽搐4.手足徐动(athetosis)又称“指划举措(point at movements)”.检查时,令患者肢体作随意运动,肢体远端呈现有规律的、重复的、缓慢而继续的扭曲举措,暗示为各种水平的屈曲、伸直、外展、内收相混合的蠕虫样运动及各种奇特姿态,可重复呈现且较有规则,睡眠时消失.此症是纹状体病变引起的综合征,可出见于:(1)先天性及婴儿期疾病,如先天性双侧手足徐动症、婴儿年夜脑性瘫痪.(2)症状性手足徐动症,如脑炎、肝豆状核变性、脑动脉硬化伴脑软化、核黄疸、麻痹性聪慧症、脑穿通畸形等.5.舞蹈样运动(chorea)为肢体的一种快速、不规则、无目的、分歧毛病称的运动,继续时间不长,在静止时可以发生,也可因外界安慰、精神紧张而引起发作.睡眠时发作较轻或消失.面部可暗示为噘嘴、眨眼、举眉、伸舌等,四肢暗示为不定向地年夜幅度运动,如上肢快速伸屈和上举,与其继续握手过程中,可感到时松时紧.多见于儿童的脑风湿病变.6.摸空症(carphology)暗示为上肢以肘、腕、手关节为主的一种无意识摸索举措.见于脑膜炎、伤寒及败血症的高热期有意识障碍者和肝昏迷病人.7.扭转痉挛(torsion dystonia)又称“扭转性肌张力障碍”.指肢体或躯干顺纵轴呈畸形扭转的不随意举措.临床上以肌张力障碍和四肢、躯干甚至全身的剧烈而不随意的扭转为特征.扭转时肌张力增高,扭转停止时肌力正常.原发性扭转痉挛原因不明,部份为遗传性.症状性扭转痉挛,可见于流脑,一氧化碳中毒,肝豆状核变性.痉挛性斜颈可为扭转痉挛的一种症状.8.肌阵挛(myoclonus)指病人呈现个别肌肉或多组肌肉群突发的、急促而快速、不规则不自主的收缩.阵挛可呈现某一局部、或分布弥散、或面颌、舌及咽喉部.其机制可能与年夜脑皮质、齿状核、结合臂、纹状体、中央顶盖束等病变有关.见于急慢性脑炎、脑膜炎、脑血管疾病、脑瘤及肌阵挛性癫痫.正凡人入睡过程中亦可偶发,但无病理性意义.四、共济运动:任何一个简单的举措,需有主动肌、对立肌、协同肌及固定肌等四组肌肉的精确配合才华完成,其所以能够准确协调,主要依靠小脑、前庭系统、深感觉、锥体外系统的共同调节,当上述结构发生病变,举措协调发生障碍,称为共济失调(ataxia).(一)共济失调的分类根据病变部位分歧可分为:1.小脑性共济失调由小脑及其传入、传出纤维损害引起,病变位于小脑蚓部、见于肿瘤、酒精中毒等.主要暗示为躯干性共济失调,位于小脑者暗示为肢体运动性共济失调.常陪伴小脑损害的其它症状.闭眼时明显.2.前庭共济失调由前庭系统损害引起,主要暗示为行走时向一侧倾倒、前庭性眼球震颤等前庭安慰症状.睁眼减轻、闭眼加重.3.脊髓性共济失调脊髓后根、后索、脑干内侧等部位损害时,由于深感觉传导障碍,病人不能正确了解肢体简直切位置和运动方向而招致共济失调.暗示走路抬脚高,落脚重,同时有深感觉减弱.睁眼较轻,闭眼时明显加重.4.年夜脑性共济失调为额叶及颞叶损伤,由于额叶脑桥小脑束及颞叶小脑脑桥束受损发生对侧小脑半球功能障碍,常致对侧肢体运动性共济失调,同时对侧肢体肌张力增高,病理反射阳性.(二)共济失调的检查方法检查共济运动,首先可观察病人的日常举措如穿衣、进食、系扣、取物、站、行走等是否正确协调,不协调时其运动的速度、范围、方向、及力度均发生障碍.经常使用的检查方法有:1.指鼻试验(finger nose test)检查者先给病人做示范举措,手臂外展并完全伸直,然后用示指指端点触自己的鼻尖,手臂伸出的位置不竭变动,速度先慢后快.然后让病人做同样的举措,先睁眼后闭眼,并进行双侧比较.正凡人举措准确,共济失调患者指鼻举措笨拙、禁绝确、不协调、不服稳.小脑半球的病变以病侧上肢的共济失调为明显,睁眼和闭眼时变动不年夜,称为小脑性共济失调.感觉性共济失调的特点是睁眼时仅见轻微障碍,闭目时由于失去了视觉的赔偿,与睁眼时有很年夜分歧,甚至找不到自己的鼻尖.指鼻试验2.指指试验(finger- finger test)嘱被检查者伸直示指,曲肘,然后伸直前臂以示指触碰对面医师的示指,先睁眼作,后闭眼作,正凡人可准确完成.若总是偏向一侧,则提示该侧小脑或迷路有病损.指指试验3.轮替举措(alternate motion)嘱被检查者用一侧手掌和手背反复交替、快速地拍击另侧手背,或在床面或桌面上连续、快速地做拍击举措.共济失调患者举措笨拙、缓慢、节律不均.一侧快速举措障碍则提示该侧小脑半球有病变.快复轮替举措4.跟-膝-胫试验(heel-knee-tibia test)嘱被检查者仰卧,一侧下肢伸直,另一侧下肢依次做如下举措:第一,伸直抬高;第二,将足跟置于另侧膝盖上;第三,足跟沿对侧胫骨徐徐滑下.共济失调患者呈现举措不稳或失误.跟-膝-胫试验5.闭目难立(Romberg)征:嘱病人双足并拢直立,两臂向前伸平,观察有无站立不稳,并注意闭目后的改变.感觉性共济失调的病人睁眼时能坚持站立平衡,而闭眼时则有斜的暗示(闭目难立征阳性).闭目睁目皆不稳提示小脑蚓部病变.闭目难立征(正常)闭目难立征6.联合屈曲征(combined flexure sign):病人仰卧,双手交叉于胸。
德尔格-7300微粒数目和质量测试仪-操作说明书
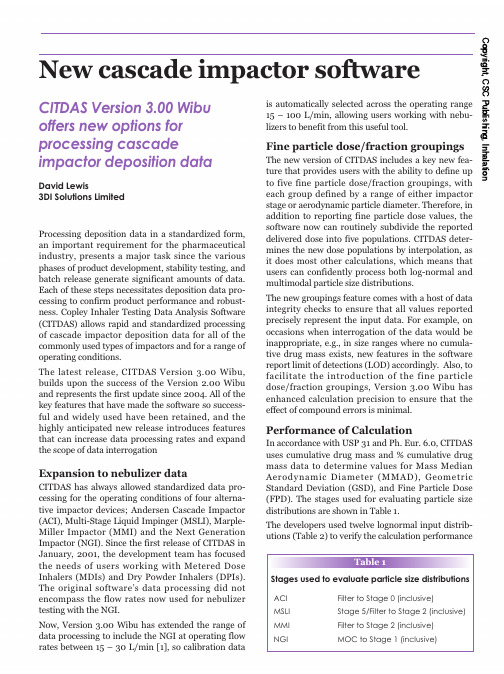
Copyright, CSC Publishing, InhalationNew cascade impactor softwareis automatically selected across the operating range 15–100L/min,allowing users working with nebu-lizers to benefit from this useful tool.Fine particle dose/fraction groupingsThe new version of CITDAS includes a key new fea-ture that provides users with the ability to define up to five fine particle dose/fraction groupings,with each group defined by a range of either impactor stage or aerodynamic particle diameter.Therefore,in addition to reporting fine particle dose values,the software now can routinely subdivide the reported delivered dose into five populations.CITDAS deter-mines the new dose populations by interpolation,as it does most other calculations,which means that users can confidently process both log-normal and multimodal particle size distributions.The new groupings feature comes with a host of data integrity checks to ensure that all values reported precisely represent the input data.For example,on occasions when interrogation of the data would be inappropriate,e.g.,in size ranges where no cumula-tive drug mass exists,new features in the software report limit of detections (LOD)accordingly.Also,to facilitate the introduction of the fine particle dose/fraction groupings,Version 3.00Wibu has enhanced calculation precision to ensure that the effect of compound errors is minimal.Performance of CalculationIn accordance with USP 31and Ph.Eur.6.0,CITDAS uses cumulative drug mass and %cumulative drug mass data to determine values for Mass Median Aerodynamic Diameter (MMAD),Geometric Standard Deviation (GSD),and Fine Particle Dose (FPD).The stages used for evaluating particle size distributions are shown in Table 1.The developers used twelve lognormal input distrib-utions (Table 2)to verify the calculation performanceDavid Lewis3DI Solutions LimitedCITDAS Version 3.00Wibu offers new options for processing cascadeimpactor deposition dataProcessing deposition data in a standardized form,an important requirement for the pharmaceutical industry,presents a major task since the various phases of product development,stability testing,and batch release generate significant amounts of data.Each of these steps necessitates deposition data pro-cessing to confirm product performance and robust-ness.Copley Inhaler Testing Data Analysis Software (CITDAS)allows rapid and standardized processing of cascade impactor deposition data for all of the commonly used types of impactors and for a range of operating conditions.The latest release,CITDAS Version 3.00Wibu,builds upon the success of the Version 2.00Wibu and represents the first update since 2004.All of the key features that have made the software so success-ful and widely used have been retained,and the highly anticipated new release introduces features that can increase data processing rates and expand the scope of data interrogationExpansion to nebulizer dataCITDAS has always allowed standardized data pro-cessing for the operating conditions of four alterna-tive impactor devices;Andersen Cascade Impactor (ACI),Multi-Stage Liquid Impinger (MSLI),Marple-Miller Impactor (MMI)and the Next Generation Impactor (NGI).Since the first release of CITDAS in January,2001,the development team has focused the needs of users working with Metered Dose Inhalers (MDIs)and Dry Powder Inhalers (DPIs).The original software’s data processing did not encompass the flow rates now used for nebulizer testing with the NGI.Now,Version 3.00Wibu has extended the range of data processing to include the NGI at operating flow rates between 15–30L/min [1],so calibration dataTable 1Stages used to evaluate particle size distributionsACI Filter to Stage 0(inclusive)MSLI Stage 5/Filter to Stage 2(inclusive)MMI Filter to Stage 2(inclusive)NGIMOC to Stage 1(inclusive)Copyright, CSC Publishing, Inhalationduring the input/output verification of CITDAS Version 3.00Wibu.Each of the “superfine,”“fine,”“medium,”and “coarse”distributions was tested at a GSD of 1.3(i.e.a very narrow distribution),1.5,and 2.5.Over the operating flow rate of each of the four impactors,CITDAS Version 3.00Wibu reported MMAD to within ±0.2%of input values and GSD to within ±0.5%(Table 3).As with the previous versions of CITDAS,the software reports GSD only for a particle size distribution if the distribution is determined to be lognormal within ±1standard deviation of the Mass Median Aerodynamic Diameter (MMAD).CITDAS calculates whether or not to report GSD by performing a linear regression upon the cumulative %undersize plot (log-Probit scale)between the Probit (+5)values 4and 6.If the R2coef-ficient for the regression exceeds the user defined value (default value is 0.95),the program reports GSD;otherwise,the value for GSD appears as “NA.”Evaluation of the reported values of FPD using the twelve distributions (Table 2)was performed for six size-ranges over the operating flow rates of the four impactors (Table 4).Accuracy in the interpolation of FPD depends on the total cumulative drug mass,where the total cumulative drug mass is calculated by summation of the drug mass collected on thestages presented in Table 1.During verification,the difference in the input and output data fell within 1.0%of total cumulative drug mass divided by the number of doses sampled for the ACI and NGI.Further testing determined values of 2.1%for the MSLI and 1.7%for the MMI (see Table 5).For calcu-lation values of FPD less than or equal to 5µm,the respective values fell to 1.0%for the MSLI and 0.4%for the ACI,NGI,and MMI.Data integrity checksWhen interrogation of the data is inappropriate,Version 3.00Wibu reports LOD (limited of detec-tion)for fine particle dose and fraction (when defined by size)if:a)Values are associated with a cumulative drug mass of less than 2%.b)Fewer than three stages have a cumulative drug mass >1%.c)Group results (when defined by size)use a specifi-cation that is captured by a)or b).In addition,Version 3.00Wibu reports “NA”(not applicable)for mass median aerodynamic diameter (MMAD)and geometric standard deviation (GSD)values when:a)>50%of the cumulative drug mass is deposited on the lowest impaction stage (filter/MOC).b)Fewer than three stages have a cumulative drug mass >1%.The introduction of these data integrity checks ensures that CITDAS output is always representative of the input data.Table 2Lognormal input distributions used to verify calculation performanceTable 3Summary of MMAD and GSD errors relative toactual valueTable 4Size ranges evaluatedTable 5Summary of FPD errorsMMAD (µm)0.51.03.05.0GSD1.31.52.51.31.52.51.31.52.51.31.52.5MMAD GSDMin MaxMinMaxACI99.8100.299.6100.5MSLI 99.9100.299.6100.2MMI 99.8100.299.7100.4NGI99.8100.299.7100.4Size range (µm)ACI0-11-22-33-44-5≤5MSLI 0-1.7 1.7-22-33-44-5≤5MMI 0-11-22-33-44-5≤5NGI0-11-22-33-44-5≤5Residual per dose relative to cumulative drug mass (%)FPD by size range FPD ≤5µm Min Max Min Max ACI-0.6+1.0-0.1+0.4MSLI -2.1+1.7-0.2+1.0MMI-0.9+1.7-0.1+0.4NGI -0.6+1.0-0.2+0.4Copyright, CSC Publishing, InhalationGroupings can be defined by aerodynamic diameter or impactor stageGroup results can be viewed onscreenImportation of Comma Separated Value/Variable(CSV)filesThe“import CSV file”function provides a powerful new feature with the potential to enable CITDAS to link up with other applications and allows files exported from CITDAS in CSV format to be modi-fied/edited and e of this function with appropriate verification of data integrity follow-ing importation introduces the potential to stream-line data input into CITDAS,potentially reducing manual data entry requirements.Other new featuresThe new version of CITDAS now has five printout types that allow the user to present data in a variety of formats,including European Pharmacopeia format, United States Pharmacopeia format,Graphical Sum-mary,the Tabulated Summary,and Group Results.In addition,the tabular summary printout now includes raw input data,allowing direct cross-checking of out-put data against raw input data on the same printout. Further user control of data appearance is provided by the ability to select the number of decimal places for seven different input/output ers can now scroll right at data entry to view new calculations that include“Mean/dose,”“SD/dose,”and“%RSD/dose.”Mean values for up to12runs can also now be printed separately.Mass balance calcu-lations on USP and Ph.Eur.print-outs have also been expanded beyond the USP/Ph.Eur.requirement of 75%-125%to include ranges of80%-120%and85%-115%to meet FDA requirements.CITDAS V3.00Wibu runs on Microsoft Windows XP home,Windows XP,and Windows VISTA operating systems.With its host of new features,this version of CITDAS provides additional versatility without changing the original’s simplicity of operation. References1.Marple V.,Roberts D.,Mitchell J.,(2004)‘A pro-posal for the use of the next generation pharmaceutical impactor(NGI)at flow rates between15and30L/min.’Respiratory Drug Delivery IX.Davis Healthcare International Publishing,River Grove,IL,701–703. David Lewis is a Consultant and Managing Direc-tor of3DI Solutions Limited,Little Acre,10 Southerwicks,Corsham,Wiltshire SN139NH. *********************。
奥瞳 火柴人智能行为识别传感器-使用说明

奥瞳火柴人智能行为识别传感器使用指南2022年3月21日目录版本历史记录6 1. 下载及安装9 1.1 简介9 1.2 安装苹果iOS APP 10 1.3 安装安卓APP 10 1.4 安装火柴人智能传感器11 1.5 免责声明,局限性和已知问题12 1.6 常见问题及解答131.6.1 已知问题131.6.2 其他常见问题141.7 技术支持152. 用户管理16 2.1注册管理员账户16 2.2 登陆18 3.房间管理203.1房间列表20 4.设备管理224.1 添加新的传感器234.1.1 添加一个传感器234.1.2 设置 WiFi 254.1.3 固件升级264.1.4 标定27背景隐私设置294.1.5 其他重要设置30 4.2传感器实时查看及设置304.2.1 传感器改名314.2.2 更新显示324.2.3 语音通话324.2.4 设置WIFI 324.2.5 传感器标定地板324.2.6感兴趣区域324.2.8固件升级364.2.9 重启传感器364.2.10 改变传感器的房间364.2.11 移除设备374.2.12 隐私模式374.2.13 倒置安装374.2.14 延时跌倒报警384.2.15 挥手求救及敏感度384.2.16 高级设置394.2.17 工厂复位394.2.18 设置夜视414.2.19 LED绿灯414.2.20 发送报警时传感器声音提示414.2.21 火柴人录像414.2.22 HDMI输出(赛普传感器)424.2.23 本地视频录像(赛普传感器)424.2.24 LED 灯颜色的含义43 5.人员管理445.1管理人群44 5.2添加人员45 5.3人员信息47 6.报警506.1 报警506.2 误报管理51 7.跌倒风险评估537.1 介绍53 7.2 莫尔斯跌倒风险评估表53 7.3 步态分析557.4.1 房间设置557.4.2 步态测试55 7.5 最终莫尔斯跌倒风险评估56 8.仪表板588.1 访客记录609. 帐户设置61 9.1个人资料61 9.2 购买订阅计划61 9.3 推送通知状态62 9.4 避免重复警报62 9.5 报警历史63 9.6 连接Alexa Together 63 9.7 邀请二级用户66 9.8 黑暗模式67 9.9 应用版本68 9.10 服务条款68 9.11 切换帐户68 9.12 登出帐户69 9.13 删除帐户699.14 提供反馈6910. 浏览器界面70 10.1 房间71 10.2 人员7210.3 报警记录73 10.4火柴人视频流74 10.5 来访记录7511. 第三方对接API 77版本历史记录日期版本2019年10月23日固件版本: 0.6.225客户端App版本: 1.4.62019年11月12日固件版本: 0.6.225客户端App版本: 1.4.6格式及微小改动2019 年11月14 日固件版本: 0.6.227客户端App版本: 1.5.02019 年11月16 日固件版本: 0.6.228客户端App版本: 1.5.02019年12月8日固件版本: 0.6.228客户端App版本: 1.5.72020年2月8日固件版本: 0.6.228客户端App版本: 1.5.7修改IOS APP下载链接,重新排列章节顺序2020 年2 月25 日固件版本: 0.7.242客户端 App 版本: 1.7.92020 年4 月5 日固件版本:US-0.7.248, CN-0.7.259, CA-0.7.262。
- 1、下载文档前请自行甄别文档内容的完整性,平台不提供额外的编辑、内容补充、找答案等附加服务。
- 2、"仅部分预览"的文档,不可在线预览部分如存在完整性等问题,可反馈申请退款(可完整预览的文档不适用该条件!)。
- 3、如文档侵犯您的权益,请联系客服反馈,我们会尽快为您处理(人工客服工作时间:9:00-18:30)。
Revision History of this documentThis section is a tabular overview of the document revisions and therevision date. You will find the most recent revision at the top of the table.Date Revision09.09.2010 V1.3 customazion version for Jiawai Thomas Barthel21.04.2010 V1.2 final version for Solarworld Christoph Mutschler21.04.2010 V1.1 customization for Solarworld Thomas Barthel08.02.2010 V1.0 initial version Thomas BarthelTable of contentsRevision History of this document (2)Table of contents (3)Program ID (4)Overview of the directory structure (5)Project data (5)Setpoint setting (6)Station Info.txt (6)Wafer_Inspection_Tolerances.ini (7)Print.ini (15)Program IDThe following table contains an overview of the wafer format and the corresponding program ID. Programnumber Wafertyp Bezeichnung Wafer format ID1 Default Basic program 150x80,5 6Dot 41234567 8 9 10 1 5 0 x 8 0 , 551525354555657585960 101 102 103 104 105 106 107 108 109 110 151 152 153 154 155 156 157 158 159 160Overview of the directory structureAll project specific data is stored in the D:\#Project directory.Project data01_programsThis directory contains all check programs (*.CHR-file): Also some sub directories with backup files of the check programs can be stored in this directory. Every check program has an explicit ID.02_reference_imagesIn this directory reference images can be stored for documentation.03_sample_imagesThis directory stores images from the automatic mode, if the parameter is set to 1 in the “Station Info.txt” 04_error_imagesThis directory stores error images from the automatic mode, if the parameter is set to 1 in the “Station Info.txt”05_backupThis directory is used to store project specific data, like NCCFG.CFG, *.pb and a backup of the system. 06_pluginsContains files for the basic NeuroCheck-Software. The file type for included files is *.dll07_camera_setupsThis directory contains the setup files (*.csux) for every installed camera. The files for the brightness regulation (*.xml and *.txt) are also stored in this directory.08_parameter_filesThis directory contains the register(Registers.xml) of the check programs. This register is used for the temporary data storage.Also the editable files for the wafer and print description (Station Info.txt,Wafer_Inspection_Tolerances.ini and Print.ini) are stored in this directory.(These files are specified in the next chapter)Setpoint settingStation Info.txtThe stationinfo.txt is structured in 4 Blocks.Block 1: StationinfoManufacturer= supplier of the systemLine= Line numberStation-Name = Name of the StationPC-Number= Number of the PC at this moduleShortinfo= The short info is used in the filename of the error images and reference images. Block 2: ModusinfoWith these parameters you are able to activate or deactivate the storage of images.e.g.SaveSampleImages = 0 store sample images is deactivatedSaveErrorImages = 1 store error images is activatedImportant!To use these settings, the file must be saved after changing!If the parameters are set to 1 the performance of the system is lower!Block 3:These offset values are only used if the mechanical conditions are asymmetrical. The standard values are 0.Block 4:These values are the exact dimensions of the measured calibration wafer (carbon wafer, test sample, etc.) You have to set these values before calibrating the systemWafer_Inspection_Tolerances.iniThis file contains all tolerances for the wafer check. Also the wafer description of the tested wafer, which describes the shape of the wafer, may be edited with these parameters.Wafer descriptionBlock 1 sets the geometry of the wafer with 3 parameters (Type, EdgeType, EdgePara).INDEX NAME DESCRIPTION DEFAULT ALLOWED VALUES0 Type Wafer basic shape 0 (rectangular) Currently only 01 Edge Type Corner type 0 (rectangular) 0= rectangular1= diagonally chamfered (45°) 2= rounded off edges2 EdgePara Measurement for corners 0 EdgeType = 0 without significance EdgeType = 1 length of chamfer EdgeType = 2 radius of roundingExample: WaferType = 0, EdgeType = 0Example:WaferType = 0,EdgeType =1Example:WaferType= 0, EdgeType=2Wafer ParametersBlock 2 is used for the set point settings and tolerances of the dimension and breakage control. WaferLenght=156.0+LenghtTol=0.3-LenghtTol=-0.3WaferWidth=156.0+WidthTol=0.3-WidthTol=-0.3ChipDepth=1.6ChipElongation=19ProtrusionDepth=1.6ProtrusionElongation=19BreakOutDepth=1.3BreakOutElongation=12.7CracksPermitted=0Wafer Print ParametersBlock 3 contains the tolerances and characteristics of the print check.The print check only uses the corresponding parameters for the front, back or back surface print. PrintToWaferOffsetX=0+TolPrintToWaferOffsetX=0.5-TolPrintToWaferOffsetX=-0.5PrintToWaferOffsetY=0+TolPrintToWaferOffsetY=0.5-TolPrintToWaferOffsetY=-0.5PrintToWaferOffsetAngle=0+TolPrintToWaferOffsetAngle=0.5-TolPrintToWaferOffsetAngle=-0.5ForeignMatterWithinFrontPrintAreaDiameter=1.5 ForeignMatterWithinFrontPrintAreaAggregate=10 ForeignMatterOutsideFrontPrintAreaDiameter=1.5ForbiddenZone=0.35BussbarWidth=1.5+TolBussbarWidth=0.5-TolBussbarWidth=-0.5BussbarLength=152.9+TolBussbarLenght=0.5-TolBussbarLenght=-0.5FingerBreaksAggregate=6.4FingerLenght=144+TolFingerLenghtAverage=0.5-TolFingerLenghtAverage=-0.5FingerWidthAverage=0.15+TolFingerWidthAverage=0.3-TolFingerWidthAverage=-0.3FingerStraightnessDeviation=3BackDotsPrintArea=70DotSizeX=7DotSizeY=9BackAluminiumPrintMissingArea=10With these parameters you can adjust the allowed variation of the print to the wafer. The measurement compares the centre of gravity of the wafer to the centre of gravity of the print. In case the value is out of the set tolerance, the wafer is detected as NIO.PrintToWaferOffsetX=0+TolPrintToWaferOffsetX=0.5-TolPrintToWaferOffsetX=0.5PrintToWaferOffsetY=0+TolPrintToWaferOffsetY=0.5-TolPrintToWaferOffsetY=0.5PrintToWaferoffsetAngle=0+TolPrintToWaferoffsetAngle=0.5- TolPrintToWaferoffsetAngle=0.5Foreign matter detects paste pollution in the print. This could happen because of contamination on the screen. This check is only used in the high resolution 11 mega pixel front print check.With these parameters you can set the allowed size of the paste pollution.ForeignMatterWithinFrontPrintAreaDiameter=1.5 ForeignMatterWithinFrontPrintAreaAggregate=10ForeignMatterOutsideFrontPrintAreaDiameter=1.5 ForbiddenZone=0.35The diameter of the biggest object does exceed the limitThe area of all objects does exceed the limitA border area which width is adjustable must be free of paste pollutionThese parameters allow to set the dimensions of the busbars and the finger print. Currently no use of the finger dimension!BusbarWidth=1.2+TolBussbarWidth=0.3-TolBussbarWidth=0.3BusbarLength=76+TolBussbarLenght=0.5-TolBussbarLenght=0.5Back Alu Print ParametersThis parameter is used to detect the allowed missing area of the aluminum print.The parameter for the dots isn’t used.BackAluminiumPrintMissingArea=10The missing area of the aluminum (inpercent) has to be lower than the setvalue.Print.iniThe Print.ini is used for the print check, the file is not used for the aluminum back side print. The file contains the description of the print layout.Example:Print_CT_Front_Busbar_id91.iniThe print description file contains common information of the print type the geometric components and a single description of the components.The number of sections in the file is depending on the configured numbers of single elements. Parameter of section [Wafer print]:INDEX NAME DESCRIPTION DEFAULTType Wafer basic shape 0 (rectangular) Currently only 0Parameter of section [Busbars]:INDEX DESCRIPTION DEFAULT ALLOWED VALUES Number Number of bars 2 0..n2 0..nColumns Number of columns, inwhich the bars arelocatedFor every in [Busbar] Number configured busbar, one description section of the busbar is applied. The section name results from “Busbar”, a space character and the consecutive number of the busbars, initiated by 1.Parameter of section [Busbar x]:INDEX DESCRIPTION ALLOWED VALUES PositionX Offset of the bar in X-direction,real formatstarted by the centre of gravity.Value in mm.real formatPositionY Offset of the bar in Y-direction,started by the centre of gravity.Value in mm.Length Length of the busbar real formatWidth Width of the busbar real format。