美国EIA页岩气报告
美国主要页岩气及致密油产区钻井生产情况报告 EIA 2014.4
Independent Statistics & AnalysisDrilling Productivity ReportThe six regions analyzed in this report accounted for 95% of domestic oil production growth and all domestic natural gas production growth during 2011-13.April 2014For key tight oil and shale gas regionsU.S. Energy Information AdministrationContentsYear-over-year summary2 Bakken3 Eagle Ford4 Haynesville5 Marcellus6 Niobrara7 Permian8 Explanatory notes9 Sources10BakkenMarcellusNiobraraHaynesvilleEagle FordPermianU. S. Energy Information Administration | Drilling Productivity Report4008001,2001,6002,0002,400BakkenEagle FordHaynesvilleMarcellusNiobraraPermianMay-2013May-2014Oil productionthousand barrels/day2,0004,0006,0008,00010,00012,00014,00016,000Bakken Eagle Ford Haynesville Marcellus Niobrara PermianMay-2013May-2014Natural gas productionmillion cubic feet/day2505007501,0001,250BakkenEagle FordHaynesvilleMarcellusNiobraraPermianMay-2013May-2014New-well oil production per rigbarrels/day1,0002,0003,0004,0005,0006,0007,000BakkenEagle Ford HaynesvilleMarcellusNiobraraPermianMay-2013May-2014New-well gas production per rigthousand cubic feet/day(700)(600) (500) (400) (300)(200) (100) 0BakkenEagle Ford HaynesvilleMarcellusNiobraraPermianMay-2013May-2014Legacy gas production changemillion cubic feet/day(125)(100) (75) (50) (25) 0BakkenEagle FordHaynesvilleMarcellusNiobraraPermianMay-2013May-2014Legacy oil production changethousand barrels/daydrilling data through March projectedproduction through MayApril 2014Drilling Productivity ReportYear-over-year summary-10010203040506070BakkenEagle FordHaynesvilleMarcellusNiobraraPermianMay-2013May-2014thousand barrels/dayIndicated monthly change in oil production (May vs. Apr)-20002004006008001,000BakkenEagle Ford HaynesvilleMarcellusNiobraraPermianMay-2013May-2014million cubic feet/dayIndicated monthly change in gas production (May vs. Apr)2U. S. Energy Information Administration | Drilling Productivity Report02004006008001,0001,20020072008200920102011201220132014Oil productionthousand barrels/day Bakken50100Apr 1,033Mbbl/dProduction from new wellsLegacy production changeNet changeMay 1,055Mbbl/dthousand barrels/dayBakken +90 -69+21Indicated change in oil production (May vs. Apr)50100Apr 1,215MMcf/d Production from new wells Legacy production changeNet changeMay 1,239MMcf/dIndicated change in natural gas production (May vs. Apr)million cubic feet/day Bakken+91 -67 +2450100150200250010020030040050060020072008200920102011201220132014new-well oil production per rig rig countNew-well oil production per rigbarrels/day BakkenRig countrigs(80)(70) (60)(50) (40) (30) (20) (10) 020072008200920102011201220132014Legacy oil production changethousand barrels/day Bakken(80)(70)(60) (50) (40) (30)(20) (10) 020072008200920102011201220132014Legacy gas production changemillion cubic feet/day Bakken01,0002,0003,0004,0005,0006,0007,00020072008200920102011201220132014BakkenNatural gas productionmillion cubic feet/day5010015020025006001,2001,8002,4003,0003,60020072008200920102011201220132014new-well gas production per rig rig countNew-well gas production per rigthousand cubic feet/day BakkenRig countrigsMonthly additions from one average rigMay barrels/dayAprilbarrels/daymonth over monthOil +7Gas thousand cubic feet/day month over month+8million cubic feet/day month over month505 Maythousand cubic feet/dayApril497499 492thousand barrels/day month over monthOil +21Gas +243U. S. Energy Information Administration | Drilling Productivity Report02004006008001,0001,2001,4001,60020072008200920102011201220132014Oil productionthousand barrels/day Eagle Ford 050100150Apr 1,351Mbbl/dProduction from new wellsLegacy production changeNet changeMay 1,382Mbbl/dthousand barrels/dayEagle Ford +135 -104+31Indicated change in oil production (May vs. Apr)50100150200250300350400Apr 6,696MMcf/d Production from new wellsLegacyproduction changeNet changeMay 6,811MMcf/dIndicated change in natural gas production (May vs. Apr)million cubic feet/dayEagle Ford+371 -256 +11550100150200250300350010020030040050060020072008200920102011201220132014new-well oil production per rig rig countNew-well oil production per rigbarrels/day Eagle FordRig countrigs(120)(100) (80)(60) (40) (20) 020072008200920102011201220132014Legacy oil production changethousand barrels/day Eagle Ford(300)(250)(200) (150) (100)(50) 020072008200920102011201220132014Legacy gas production changemillion cubic feet/day Eagle Ford01,0002,0003,0004,0005,0006,0007,00020072008200920102011201220132014Eagle FordNatural gas productionmillion cubic feet/day5010015020025030035006001,2001,8002,4003,0003,60020072008200920102011201220132014new-well gas production per rig rig countNew-well gas production per rigthousand cubic feet/day Eagle FordRig countrigsMonthly additions from one average rigMay barrels/dayAprilbarrels/daymonth over monthOil +7Gas thousand cubic feet/day month over month+6million cubic feet/day month over month1,285 Maythousand cubic feet/dayApril1,279470 463thousand barrels/day month over monthOil +31Gas +1154U. S. Energy Information Administration | Drilling Productivity Reportbarrels/day04008001,2001,6002,00020072008200920102011201220132014Oil productionthousand barrels/day Haynesville 0.01.02.03.0Apr 53Mbbl/dProduction from new wellsLegacy production changeNet changeMay 53Mbbl/dthousand barrels/dayHaynesville +1 -1+0Indicated change in oil production (May vs. Apr)-150-5050150250350Apr 6,604MMcf/d Production from new wells Legacy production changeNet changeMay 6,615MMcf/dIndicated change in natural gas production (May vs. Apr)million cubic feet/day Haynesville+284 -272+125010015020025030002004006008001,00020072008200920102011201220132014new-well oil production per rig rig countNew-well oil production per rigbarrels/day HaynesvilleRig countrigs(3) (2)(1) 020072008200920102011201220132014Legacy oil production changethousand barrels/day Haynesville(600)(500)(400) (300)(200)(100)020072008200920102011201220132014Legacy gas production changemillion cubic feet/day Haynesville02,0004,0006,0008,00010,00012,00020072008200920102011201220132014HaynesvilleNatural gas productionmillion cubic feet/day5010015020025030001,0002,0003,0004,0005,0006,00020072008200920102011201220132014new-well gas production per rig rig countNew-well gas production per rigthousand cubic feet/day HaynesvilleRig countrigsMonthly additions from one average rigMay Aprilbarrels/daymonth over monthOil 0Gas thousand cubic feet/day month over month+62million cubic feet/day month over month5,230 May thousand cubic feet/dayApril5,16823 23thousand barrels/day month over monthOil +0Gas +125U. S. Energy Information Administration | Drilling Productivity Report04008001,2001,6002,00020072008200920102011201220132014Oil productionthousand barrels/day Marcellus0.01.02.03.04.0Apr 40Mbbl/dProduction from new wells Legacy production changeNet changeMay 41Mbbl/d thousand barrels/dayMarcellus +3 -2+1Indicated change in oil production (May vs. Apr)200400600Apr 14,520MMcf/d Production from new wells Legacy production changeNet changeMay 14,773MMcf/dIndicated change in natural gas production (May vs. Apr)million cubic feet/day Marcellus+605 -352 +2532040608010012014016002004006008001,0001,20020072008200920102011201220132014new-well oil production per rig rig countNew-well oil production per rigbarrels/day MarcellusRig countrigs(3)(2)(1)20072008200920102011201220132014Legacy oil production changethousand barrels/day Marcellus(400)(360) (320) (280) (240) (200) (160) (120) (80) (40) 020072008200920102011201220132014Legacy gas production changemillion cubic feet/day Marcellus02,0004,0006,0008,00010,00012,00014,00016,00020072008200920102011201220132014MarcellusNatural gas productionmillion cubic feet/day2040608010012014016001,2002,4003,6004,8006,0007,20020072008200920102011201220132014new-well gas production per rig rig countNew-well gas production per rigthousand cubic feet/day MarcellusRig countrigsMonthly additions from one average rigMay barrels/dayAprilbarrels/daymonth over monthOil 0Gas thousand cubic feet/day month over month+46million cubic feet/daymonth over month6,501 May thousand cubic feet/dayApril6,45530 30thousand barrels/day month over monthOil +1Gas +2536U. S. Energy Information Administration | Drilling Productivity Report02004006008001,00020072008200920102011201220132014Oil productionthousand barrels/day Niobrara10203040Apr 306Mbbl/dProduction from new wells Legacy production changeNet changeMay 311Mbbl/d thousand barrels/dayNiobrara +34 -29+5Indicated change in oil production (May vs. Apr)50100150200Apr 4,144MMcf/d Production from new wells Legacy production changeNet changeMay 4,169MMcf/dIndicated change in natural gas production (May vs. Apr)million cubic feet/day Niobrara+151 -127 +2420406080100120140010020030040050060020072008200920102011201220132014new-well oil production per rig rig countNew-well oil production per rigbarrels/day NiobraraRig countrigs(35)(30) (25)(20) (15) (10)(5) 020072008200920102011201220132014Legacy oil production changethousand barrels/day Niobrara(160)(140)(120) (100) (80) (60)(40) (20) 020072008200920102011201220132014Legacy gas production changemillion cubic feet/day Niobrara01,0002,0003,0004,0005,0006,00020072008200920102011201220132014NiobraraNatural gas productionmillion cubic feet/day2040608010012014006001,2001,8002,4003,0003,60020072008200920102011201220132014new-well gas production per rig rig countNew-well gas production per rigthousand cubic feet/day NiobraraRig countrigsMonthly additions from one average rigMay barrels/dayAprilbarrels/daymonth over monthOil +8Gas thousand cubic feet/day month over month+14million cubic feet/day month over month1,554 Maythousand cubic feet/dayApril1,540352 344thousand barrels/day month over monthOil +5Gas +247U. S. Energy Information Administration | Drilling Productivity Report02004006008001,0001,2001,4001,60020072008200920102011201220132014Oil productionthousand barrels/day Permian204060Apr 1,441Mbbl/dProduction from new wells Legacy production changeNet changeMay 1,454Mbbl/d thousand barrels/dayPermian +56 -43+13Indicated change in oil production (May vs. Apr)306090120150Apr 5,347MMcf/d Production from new wells Legacy production changeNet changeMay 5,386MMcf/dIndicated change in natural gas production (May vs. Apr)million cubic feet/day Permian+140 -100 +40100200300400500600010020030040050060020072008200920102011201220132014new-well oil production per rig rig countNew-well oil production per rigbarrels/day PermianRig countrigs(50)(45) (40) (35) (30) (25) (20) (15) (10) (5) 020072008200920102011201220132014Legacy oil production changethousand barrels/day Permian(140)(120)(100) (80) (60) (40) (20) 020072008200920102011201220132014Legacy gas production changemillion cubic feet/day Permian01,0002,0003,0004,0005,0006,0007,0008,00020072008200920102011201220132014PermianNatural gas productionmillion cubic feet/day10020030040050060006001,2001,8002,4003,0003,60020072008200920102011201220132014new-well gas production per rig rig countNew-well gas production per rigthousand cubic feet/day PermianRig countrigsMonthly additions from one average rigMay barrels/dayAprilbarrels/daymonth over monthOil +1Gas thousand cubic feet/day month over month+3million cubic feet/daymonth over month276 Maythousand cubic feet/dayApril273110 109thousand barrels/day month over monthOil +13Gas +408The Drilling Productivity Report uses recent data on the total number of drilling rigs in operation along with estimates of drilling productivity and estimated changes in production from existing oil and natural gas wells to provide estimated changes in oil and natural gas production for six key fields. EIA’s approach does not distinguish between oil-directed rigs and gas-directed rigs because once a well is completed it may produce both oil and gas; more than half of the wells do that.Monthly additions from one average rigMonthly additions from one average rig represent EIA’s estimate of an average rig’s1 contribution to production of oil and natural gas from new wells.2 The estimation of new-well production per rig uses several months of recent historical data on total production from new wells for each field divided by the region's monthly rig count, lagged by two months.3 Current- and next-month values are listed on the top header. The month-over-month change is listed alongside, with +/- signs and color-coded arrows to highlight the growth or decline in oil (brown) or natural gas (blue).New-well oil/gas production per rigCharts present historical estimated monthly additions from one average rig coupled with the number of total drilling rigs as reported by Baker Hughes.Legacy oil and natural gas production changeCharts present EIA’s estimates of total oil and gas production changes from all the wells other than the new wells. The trend is dominated by the well depletion rates, but other circumstances can influence the direction of the change. For example, well freeze-offs or hurricanes can cause production to significantly decline in any given month, resulting in a production increase the next month when production simply returns to normal levels.Projected change in monthly oil/gas productionCharts present the combined effects of new-well production and changes to legacy production. Total new-well production is offset by the anticipated change in legacy production to derive the net change in production. The estimated change in production does not reflect external circumstances that can affect the actual rates, such as infrastructure constraints, bad weather, or shut-ins based on environmental or economic issues.Oil/gas productionCharts present oil and natural gas production from both new and legacy wells since 2007. This production is based on all wells reported to the state oil and gas agencies. Where state data are not immediately available, EIA estimates the production based on estimated changes in new-well oil/gas production and the corresponding legacy change.Footnotes:1. The monthly average rig count used in this report is calculated from weekly data on total oil and gas rigs reported by Baker Hughes2. A new well is defined as one that began producing for the first time in the previous month. Each well belongs to the new-well category for only one month. Reworked and recompleted wells are excluded from the calculation.3. Rig count data lag production data because EIA has observed that the best predictor of the number of new wells beginning production in a given month is the count of rigs in operation two months earlier.The data used in the preparation of this report come from the following sources. EIA is solely responsible for the analysis, calculations, and conclusions.Drilling Info () Source of production, permit, and spud data for counties associated with this report. Source of real-time rig location to estimate new wells spudded and completed throughout the United States.Baker Hughes () Source of rig and well counts by county, state, and basin. North Dakota Oil and Gas Division (https:///oilgas) Source of well production, permit, and completion data in the counties associated with this report in North DakotaRailroad Commission of Texas () Source of well production, permit, and completion data in the counties associated with this report in TexasPennsylvania Department of Environmental Protection(https:///publicreports/Modules/Welcome/Welcome.aspx) Source of well production, permit, and completion data in the counties associated with this report in PennsylvaniaWest Virginia Department of Environmental Protection (/oil-and-gas/Pages/default.aspx) Source of well production, permit, and completion data in the counties associated with this report in West VirginiaColorado Oil and Gas Conservation Commission () Source of well production, permit, and completion data in the counties associated with this report in ColoradoWyoming Oil and Conservation Commission ( ) Source of well production, permit, and completion data in the counties associated with this report in WyomingLouisiana Department of Natural Resources () Source of well production, permit, and completion data in the counties associated with this report in Louisiana。
美国页岩油气发展历程及成功因素分析精选版

(登陆获取高端报告。
)1. 页岩油气——资源丰富,美国借力页岩革命实现能源自主1.1. 页岩油气——能源结构中的重要拼图页岩油气是指从页岩中开采出来的石油和天然气,包含页岩油和页岩气。
页岩油气的形成和富集有着自身独特的特点,往往分布在盆地内厚度较大、分布广的页岩烃源岩地层中。
全球页岩油气储量十分可观,储量集中在中美俄三国。
根据美国能源信息署(EIA) 2013 年的统计,全球天然气探明可采储量为 647 万亿立方米,其中页岩气为 206 万亿立方米,占全球天然气可采储量的 32%。
而全球页岩油储量达到了 3450 亿桶,占全球石油储量的 20%。
美国率先完成页岩油气革命,页岩油气产量占比过半,2017 年成为天然气净出口国。
美国在经历多年的技术摸索后,成功完成了页岩气革命。
2017 年美国页岩气占天然气年产量的 72%,页岩油占石油年产量的比重也超过了 50%。
凭借页岩气的持续高产,根据 EIA 数据,2017 年美国天然气产量超过消费量实现能源自主,也正式实现了由天然气输入国向净出口国的转变,这也是美国自 1957 年以来首次成为天然气净出口国。
1.2. 钻完井为核心流程,水平井和水力压裂为核心技术页岩气的开采流程可以分为勘探阶段——开发阶段——采气阶段,其中开发阶段的钻井和完井是页岩油气成功开发的核心。
而水平井钻井和压裂是目前使用的核心技术。
水平井是指井眼竖着打到一定的深度以后,再向水平或者接近水平的倾斜方向继续延伸一定长度的定向井。
竖直与水平方向打井的井斜角要达到90°左右,水平段在页岩层里水平方向延伸的长度一般要大于页岩厚度的 6 倍。
水力压裂技术是水平井的关键配套技术之一,利用储层的天然或诱导裂缝系统,使用含有各种添加剂的压裂液在高压下注入地层,使储层裂缝网络扩大,并依靠支撑剂支撑裂缝,从而改善储层裂缝网络系统,达到增产目的。
2. 四大阶段复盘美国页岩气革命页岩气勘探开发始于美国,经过多年摸索,美国目前已通过页岩气革命实现了天然气全面自给自足,并成为天然气净出口国。
岩层气

页岩气的开发前景及潞安战略页岩气是从页岩层中开采出来的天然气,主体位于暗色泥页岩或高碳泥页岩中,页岩气是主体上以吸附或游离状态存在于泥岩、高碳泥岩、页岩及粉砂质岩类夹层中的天然气。
页岩气的形成和富集有着自身独特的特点,往往分布在盆地内厚度较大、分布广的页岩烃源岩地层中。
页岩气开发具有开采寿命长和生产周期长的优点,同时页岩气储集层渗透率低,开采难度较大。
页岩气的储量据美国能源信息署(EIA)发布报告称,全球页岩气可采储量为6622万亿立方英尺,其中美国为862万亿立方英尺,中国则高达1275万亿立方英尺(约合36万亿立方米),为全球第一。
据国土资源部公布的数据显示:我国陆域页岩气地质资源潜力为134.42万亿立方米,可采资源潜力为25.08万亿立方米(不含青藏区)。
其中,四川盆地、渝东鄂西地区、黔湘地区、鄂尔多斯盆地、塔里木盆地等将是未来重点勘探开发和产量增长的区域。
国内外对页岩气的开发现状目前,美国是世界上唯一实现页岩气大规模开采的国家,2010年页岩气产量达到1378亿立方米,占天然气产量的22.6%,使得美国的天然气对外依存度由2005年的16.7%迅速下降到2010年的10.8%,更令美国天然气价格在最近一年中下跌了41%。
以2010年美国天然气消费量(24.1万亿立方英尺)计算,美国的862万亿立方英尺页岩气可开采储量,可满足美国近40年的天然气消费需求。
而预计未来25年内美国天然气产量的增加部分主要是页岩气,因此页岩气对于提高美国能源自给率,摆脱对供给极不稳定的海外进口石油的依赖,意义重大。
而中国自1996年首次成为石油净进口国,2004年的石油进口量突破亿吨大关,2011年进口量为2.53亿吨。
石油对外依存度高达56%,并呈现逐年上升趋势。
BP集团首席经济学家鲁尔甚至预计,到2030年中国石油进口依存度将达到80%。
全球对页岩气的开发并不普遍,仅美国和加拿大在这方面做了大量工作。
其中,美国已进入页岩气开发的快速发展阶段,加拿大商业开采还处于起步阶段。
美国页岩气资源及开发状况解析

美国页岩气资源及开发状况解析一、美国页岩气资源储量全球页岩气资源量为456万亿m3,主要分布在北美、中亚、中国、中东、拉美、北非和原苏联等国家和地区。
美国能源信息署(EIA)《年度能源展望2011》报告预测,美国的页岩气远景储量为23.42万亿m3,远高于2010年预测的10万亿m3的数据,较“美国天然气资源委员会”(PGC)预测的18.72万亿m3也高出25%。
就可采资源而言,美国2010年已探明的天然气储量(常规与非常规)较2009年上涨11%,为1971年以来的最高水平。
2009年,美国已探明页岩气储量占天然气资源储量的14%,预计2035年这一比例将达到35%。
可以预期的是,由于页岩气的成功开发,美国在未来几十年当中将不需要从其他国家进口天然气,而目前需要从加拿大进口约11%的天然气。
二、美国页岩气开发现状美国是世界上页岩气资源勘探开发最早的国家,目前已进入页岩气开发的快速发展阶段。
美国页岩气开发有80多年的历史,有众多的企业参与勘探开发。
2000年,美国页岩气年产量为122亿m3。
2007年,美国页岩气总产量接近500亿m3,占美国天然气总量的8%以上,其中,仅NewarkEast页岩气田的年产量就达217亿m3。
而在2009年美国页岩气年产量上升至近1000亿m3(超过我国天然气总产量),2010年为1500亿m3,预计到2015年,美国页岩气的年产量将达到2800亿m3。
融合水平钻井技术、水力压裂技术的页岩气开采技术的日臻成熟和成本的降低,促进了页岩气生产的快速增长,并对能源以及相关产业产生了明显影响。
近年来,在美国发电行业,许多即将退役的燃煤发电机组因为页岩气产量的快速增长而改用天然气发电,以往一直向海外转移的一些高耗能制造业公司,也因天然气供应价格相对便宜而纷纷选择留在本土发展。
-全文完-。
页岩气开采技术
页岩气开采技术1 综述页岩气是一种以游离或吸附状态藏身于页岩层或泥岩层中的非常规天然气,是一种非常重要的天然气资源,主要成分是甲烷。
页岩气的形成和富集有其自身的特点,往往分布在盆地内厚度较大、分布广的页岩烃源岩地层中。
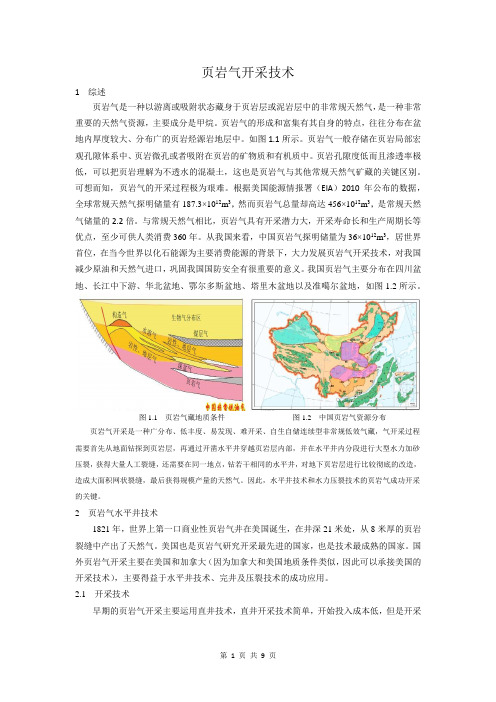
如图1.1所示。
页岩气一般存储在页岩局部宏观孔隙体系中、页岩微孔或者吸附在页岩的矿物质和有机质中。
页岩孔隙度低而且渗透率极低,可以把页岩理解为不透水的混凝土,这也是页岩气与其他常规天然气矿藏的关键区别。
可想而知,页岩气的开采过程极为艰难。
根据美国能源情报署(EIA)2010年公布的数据,全球常规天然气探明储量有187.3×10¹²m3,然而页岩气总量却高达456×1012m3,是常规天然气储量的2.2倍。
与常规天然气相比,页岩气具有开采潜力大,开采寿命长和生产周期长等优点,至少可供人类消费360年。
从我国来看,中国页岩气探明储量为36×1012m3,居世界首位,在当今世界以化石能源为主要消费能源的背景下,大力发展页岩气开采技术,对我国减少原油和天然气进口,巩固我国国防安全有很重要的意义。
我国页岩气主要分布在四川盆地、长江中下游、华北盆地、鄂尔多斯盆地、塔里木盆地以及准噶尔盆地,如图1.2所示。
图1.1页岩气藏地质条件图1.2中国页岩气资源分布页岩气开采是一种广分布、低丰度、易发现、难开采、自生自储连续型非常规低效气藏,气开采过程需要首先从地面钻探到页岩层,再通过开凿水平井穿越页岩层内部,并在水平井内分段进行大型水力加砂压裂,获得大量人工裂缝,还需要在同一地点,钻若干相同的水平井,对地下页岩层进行比较彻底的改造,造成大面积网状裂缝,最后获得规模产量的天然气。
因此,水平井技术和水力压裂技术的页岩气成功开采的关键。
2 页岩气水平井技术1821年,世界上第一口商业性页岩气井在美国诞生,在井深21米处,从8米厚的页岩裂缝中产出了天然气。
美国也是页岩气研究开采最先进的国家,也是技术最成熟的国家。
2013年页岩气行业研究报告

2013年页岩气行业研究报告2012年12月目录一、页岩气介绍 (4)1、页岩气含义 (4)2、全球页岩气储量及分布 (5)3、同常规天然气藏及其他非常规页岩气区别 (7)(1)同常规天然气藏的区别 (7)(2)同其他非常规天然气藏的区别 (9)二、页岩气在美国的发展 (11)1、美国页岩气发展历程 (11)2、美国页岩气工业迅速发展的原因 (13)3、美国页岩气储量分布 (14)4、页岩气开发对美国能源结构影响 (16)5、美国页岩气开发技术历程 (20)(1)水平钻井技术 (21)(2)水力压裂技术 (23)(3)压裂缝检测技术 (23)6、典型案例:“Barnett页岩气开发”及美国页岩气成功开采经验 (24)三、页岩气在世界其他国家的发展 (29)1、加拿大商业开采处于起步阶段 (29)2、乌克兰页岩气资源储量丰富 (30)3、欧洲页岩气勘探前景堪忧 (30)四、页岩气在中国的发展 (32)1、我国页岩气储量分布 (32)2、我国开发页岩气的必要性和可行性 (34)(1)促进改善能源结构 (34)(2)开发利用页岩气有利于减少二氧化碳排放,保护生态环境 (35)(3)北美页岩气开发技术基本成熟,为我国发展页岩气提供了借鉴 (35)(4)天然气需求旺盛,为页岩气发展提供了良好的环境 (35)(5)天然气储运设施不断完善,有利于页岩气的规模开发 (38)3、我国页岩气发展历程 (38)4、我国页岩气发展现状 (39)(1)资源调查 (40)(2)资源管理 (40)(3)勘探现状 (41)(4)对外合作 (44)(5)科技攻关 (44)5、四川页岩气开发及我国面临的开采难题 (45)(1)四川页岩气开发 (45)(2)我国页岩气开采面临的难点和问题 (46)五、页岩气开发产业链 (49)1、页岩气开发产业链及其保障 (49)2、页岩气开发特色装备 (51)3、页岩气开发成本分析 (53)六、重点企业简况 (57)1、杰瑞股份 (57)2、吉艾科技 (57)3、常宝股份 (58)4、惠博普 (59)一、页岩气介绍1、页岩气含义页岩气,是从页岩层中开采出来的天然气,赋存于富有机质泥页岩及其夹层中,以吸附或游离状态为主要存在方式的非常规天然气,成分以甲烷(CH4)为主,一般含量在85%以上,最高达到99.8%,另外还含有少量的乙烷(C2H6)、丙烷(C3H8)和丁烷(C4H10)等,是一种清洁、高效的能源资源。
关于页岩气勘探开发工作的汇报

关于页岩气勘探开发工作的汇报汇报内容页岩气勘探开发的意义国内外页岩气勘探开发现状 页岩气勘探开发关键技术 我省情况介绍结论与建议从高部位→低部位从局部圈闭→大面积改变了油气勘探开发的视野页岩气与常规油气成藏区别常规油气:生成、运移、圈闭储藏。
一、页岩气勘探开发的意义从源外→源内据国际能源机构预测,中国2030年石油需求量将从2008年的3.85亿吨增长到2030年的8.15亿吨,增长111.7%;天然气需求量将从2008年的1420亿立方米增长到2030年的2420亿立方米,增长70.4%。
12345678919802000200820152030石油需求量,亿吨年份50010001500200025003000198020002008201520252030天然气需求量,亿立方米年份中国油气需求展望(资料来源:国际能源机构《世界能源展望2009》)未来20年中国油气需求持续增长一、页岩气勘探开发的意义2562103000456常规气煤层气致密气页岩气水合物北美110中国与中亚100全球天然气资源构成页岩气资源潜力单位:万亿立方米页岩气资源潜力巨大资料来源:Roger 1997,IFP 2006,USGS 2007471页岩气开发是全球能源领域的一场革命一、页岩气勘探开发的意义一、页岩气勘探开发的意义页岩气开发是全球能源领域的一场革命应对全球对清洁能源的需求一、页岩气勘探开发的意义页岩气勘探开发对我国的意义改变我国能源结构中国、欧盟和世界的能源结构对比□中国的化石能源占总量的92.86%,而世界为87.89%;□中国化石能源的主体是煤,占70.62%,而世界为29.36%;□中国天然气的比例特别低,为3.66%,而世界为23.76%;资料来源:安东石油,2011青岛非常规会议一、页岩气勘探开发的意义页岩气勘探开发我省面临重大发展机遇国发[2012]2号文件为加快我省非常规油气开发提供了强有力的政策支撑。
美国页岩气发展现状及对我国的启示
芯方法、水平井钻完井技术(1993 年 州与地方法律约束,州际管道则受联 的热情,促进了页岩气的发展。
首次在巴尼特页岩中进行试验);页岩 气开采的地质控制因素、地层密度测
邦能源管理委员会、州、地方法律同时 约束。管道运营商对天然气供应商实
美国页岩气开发成功的启示
井 在 有 机 碳 含 量 测 定 中 的 应 用 施无歧视准入,接受联邦能源管理委
美国页岩气的成功开发,已使昔日
(1993);页岩气储层的室内和岩石物 员会的监管。天然气管道输送价格受 的天然气进口国基本上实现了自给自
17 中国石化 2011 / 9
〉〉〉〉〉〉〉〉〉〉〉〉〉〉〉〉〉〉〉〉〉〉〉〉〉〉〉 关 注
sinopec monthly
页岩气改变全球油气格局
□魏旭
期的技术积累和美国政府的政策支
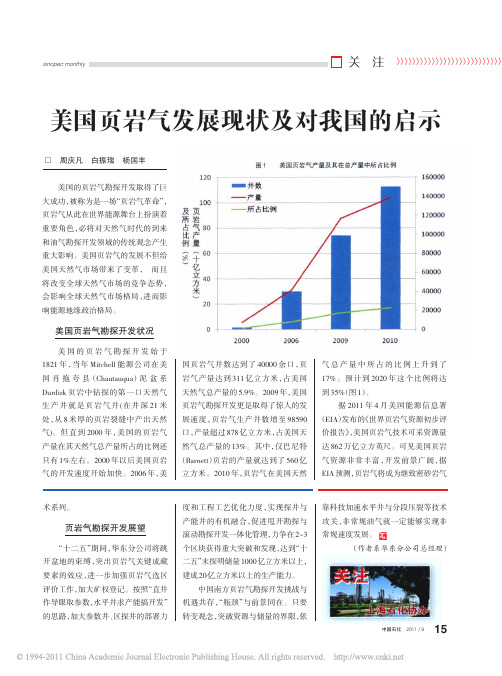
国页岩气井数达到了 40000 余口,页 岩气产量达到 311 亿立方米,占美国 天然气总产量的 5.9%。2009 年,美国 页岩气勘探开发更是取得了惊人的发 展速度,页岩气生产井数增至 98590 口,产量超过 878 亿立方米,占美国天 然气总产量的 13%。其中,仅巴尼特 (Barnett)页岩的产量就达到了 560 亿 立方米。2010 年,页岩气在美国天然
1.开发技术的突破与成熟 开发技术的创新尤其是水平井钻 井、压裂技术以及裂缝综合预测技术的 进步与广泛运用在推动页岩气藏的快 速开发中发挥了至关重要的作用。自 1981 年的第一口发现井到 1992 年,历 经 10 年,美国钻生产井仅 99 口,开发进 程缓慢。1997 年后,水力压裂取代凝 胶压裂成为页岩气主要的增产措施,巴
纳西、俄亥俄、密歇根和伊利诺伊等, 输送业务,而不能再从事天然气生产 益匪浅。此外,美国政府还对油气行
- 1、下载文档前请自行甄别文档内容的完整性,平台不提供额外的编辑、内容补充、找答案等附加服务。
- 2、"仅部分预览"的文档,不可在线预览部分如存在完整性等问题,可反馈申请退款(可完整预览的文档不适用该条件!)。
- 3、如文档侵犯您的权益,请联系客服反馈,我们会尽快为您处理(人工客服工作时间:9:00-18:30)。
Last Updated: December 5, 2012
Shale gas refers to natural gas that is trapped within shale formations. Shales are fine-grained sedimentary rocks that can be rich sources of petroleum and natural gas. Over the past decade, the combination of horizontal drilling and hydraulic fracturing has allowed access to large volumes of shale gas that were previously uneconomical to produce. The production of natural gas from shale formations has rejuvenated the natural gas industry in the United States.
How is Shale Gas Production Different from Conventional Gas Production?
Conventional gas reservoirs are created when natural gas migrates from an organic-rich source formation into permeable reservoir rock, where it is trapped by an overlying layer of impermeable rock. In contrast, shale gas resources form within the organic-rich shale source rock. The low permeability of the shale greatly inhibits the gas from migrating to more permeable reservoir rocks.
Hydraulic fracturing (commonly called "fracking" or "fracing") is a technique in which water, chemicals, and sand are pumped into the well to unlock the hydrocarbons trapped in shale formations by opening cracks (fractures) in the rock and allowing natural gas to flow from the shale into the well. When used in conjunction with horizontal drilling, hydraulic fracturing enables gas producers to extract shale gas economically. Without these techniques, natural gas does not flow to the well rapidly, and commercial quantities cannot be produced from shale.
What is shale gas and why is it important?
Page 1 of 6
/energy_in_brief/article/about_shale_gas.cfm ‹ All Energy in Brief Articles
Energy in Brief What is shale gas and why is it important?
/energy_in_brief/article/about_shale_ gas and why is it important?
Page 3 of 6
Geophysicists and geologists identify suitable well locations in areas with potential for economical gas production by using surface and subsurface geology techniques and seismic techniques to generated maps of the subsurface. See animated maps of production growth in the Barnett Shale and Marcellus Shale plays in Today in Energy articles — July 12, 2011 and May 23, 2012.
/energy_in_brief/article/about_shale_gas.cfm
1/15/2013
What is shale gas and why is it important?
Page 2 of 6
Download Figure Data
Although the prospects for shale gas production are promising, there remains considerable uncertainty regarding the size and economics of this resource. Many shale formations, particularly the Marcellus (see map below), are so large that only a limited portion of the entire formation has been extensively production-tested. Most of the shale gas wells have been drilled in the last few years, so there is considerable uncertainty regarding their long-term productivity. Another uncertainty is the future development of well drilling and completion technology that could substantially increase well productivity and reduce production costs.
The U.S. Energy Information Administration's Annual Energy Outlook 2013 Early Release projects U.S. natural gas production to increase from 23.0 trillion cubic feet in 2011 to 33.1 trillion cubic feet in 2040, a 44% increase. Almost all of this increase in domestic natural gas production is due to projected growth in shale gas production, which grows from 7.8 trillion cubic feet in 2011 to 16.7 trillion cubic feet in 2040.
Does the U.S. Have Abundant Shale Gas Resources?
Of the natural gas consumed in the United States in 2011, about 95% was produced domestically; thus, the supply of natural gas is not as dependent on foreign producers as is the supply of crude oil, and the delivery system is less subject to interruption. The availability of large quantities of shale gas should enable the United States to consume a predominantly domestic supply of gas for many years and produce more natural gas than it consumes.