汤森路透 Thomson Reuters Electronic Trading
汤森路透的资金解决方案pptSlide1

各国汇率预期
PPT文档演模板
汤森路透的资金解决方案pptSlide1
全球货币预期(人民币未来今年的预期)
PPT文档演模板
汤森路透的资金解决方案pptSlide1
3个月欧元走势预测
PPT文档演模板
汤森路透的资金解决方案pptSlide1
3000Xtra: 商品能源
PPT文档演模板
汤森路透的资金解决方案pptSlide1
3000Xtra: 全球金融新闻
PPT文档演模板
汤森路透的资金解决方案pptSlide1
路透新闻,深度分析
PPT文档演模板
汤森路透的资金解决方案pptSlide1
图形及分析工具
PPT文档演模板
汤森路透的资金解决方案pptSlide1
试算模型(交叉汇率远期计算)
PPT文档演模板
汤森路透的资金解决方案pptSlide1
What does Thomson- Reuters do
• 汤森路透集团为领导全球的财经资讯、新闻及系统解决方案供 应商,服务金融机构、媒体、企业客户,并以过人实力为全球 人士提供综合资讯内容、技术及服务。
• 投资,资金部 • 投资者关系 • 战略规划 • 其他业务部门 全球主要银行和大企业资金交易部门的首选金
奇异期权定价
PPT文档演模板
汤森路透的资金解决方案pptSlide1
Reuters Messenger
PPT文档演模板
汤森路透的资金解决方案pptSlide1
技术要求及服务
连接方式: 一台:专用ADSL宽带 或 互联网 一台以上:电信专线 培训: 每位使用者都可参加免费训练课程 – 上课地点可在贵公司办公场所或本公司
融资讯平台
Thomson Reuters Datastream搜索工具使用说明书
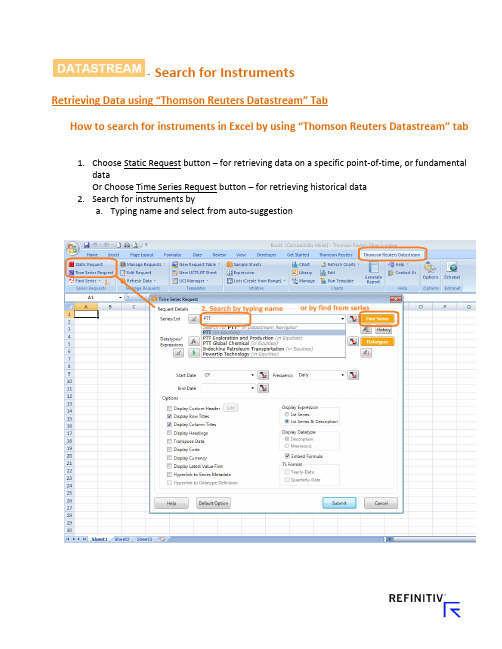
- Search for InstrumentsRetrieving Data using “Thomson Reuters Datastream” TabHow to search for instruments in Excel by using “Thomson Reuters Datastream” t ab1.Choose Static Request button – for retrieving data on a specific point-of-time, or fundamentaldataOr Choose Time Series Request button – for retrieving historical data2.Search for instruments bya.Typing name and select from auto-suggestionb.Find Series buttoni.After clicking “Find Series” button, there will be “New pop-up window”•Then, search by typing keyword•Can also add more filters by different categories on the left pane, e.g. asset classes, sources of information, etc.•Then, select wanted instruments by clicking on the code of Symbol column “@AAPL” or check the box and click “Use”•Details of instrument can be found in the space below of the searched list (source, codes, time span, definition, exchange name, etc.)•Or can search instruments by clicking on “Explore” tab with in the same window•Then select the wanted Asset class, Country, Category, Industry, and Instruments accordinglyExample: On Explore menu, select Equities → Thailand → and select first 7 industries which included 140 stocks in Thailand marketNew window will show stocks in those industries. Then check boxes for stocks in Alternative Energy sector and Krung Thai Bank and click “Use”.All selected stock codes will show up in the first window of “Time Series Request”, which included the first one, APPLE, that we selected earlier.- Data types & DisplayRetrieving Data using “Thomson Reuters Datastream” TabHow to search for data types, and select display in Excel by using “Thomson Reuters Datastream” tab Refer to “How to search for instruments in Excel by using “Thomson Reuters Datastream” tab” manual before proceeding on the following steps.1.Select Data typeThis step will be a selection of different data types: prices, fundamental, financial statement items, ratios, etc.•Select the related Asset class first – in this case is Equities•Search by typing key word and click search•Filter for more specific data on the left pane categories•Select data that would like to retrieve• 3-stars means the most related data to your key word•Description and details are available by click on the name of data type Example: Select Equities and search for Total Return of stockDescription and methodology will be shown once click on the name of data typeThen check the box in front of stars and click “Use”.Or click on the data type code “RI”.2.Select time period of historical data, and frequencyTime period – can be input as default format: Start of Week, End of Week, and etc.Also can be input as exact date: DD/MM/YYYY (28/07/2015) Frequency – should select the suitable frequency that related to data typeFor example; Economic data with Monthly or Quarterly frequencyFinancial items data with Quarterly or Yearly frequencyExample: Frequency detail of each instrument can be found on the Frequency column to avoid mismatch of frequency while retrieving data. Also, it can be filtered on the left pane to search for specific frequency data.3.Design your display options, by checking the box of each itemThe recommended items to choose for display arei.Display Row & Column titlesii.Display codeiii.Display currency (currency by default will normally be local currency of those instruments)iv.Display latest value first (this will sort value to show latest period first)v.Hyperlink to Series Metadata (this will show link to open pop-up page with description of each instrument)vi.Check “Embed Formula” box (This will allow user to edit this request again in the future)4.Result of data retrievali.Formula will be embedded on first cell that we selected before clicking “Time SeriesRequest” button (screenshot shows cell A1 with formula)ii.Formula can also be edited manually on the fx bar (same as normal Excel formula) iii.Or click “Edit Request” then edit detail from the pop-up window again- Last 12 Months Dividend YieldRetrieving Data using “Thomson Reuters Datastream” TabHow to search for data types, and select display in Excel by using “Thomson Reuters Datastream” tabRetrieving Last 12 months -Dividend Yield for an instrumentRefer to “How to search for for data types, and select display in Excel by using “Thomson Reuters Datastream” tab ” manual before proceeding on the following steps.1. Select Static Request button2. After input the instruments (Stocks),i. Press Datatypes buttonii. Search for Equities category on the drop box iii. Search for Dividend or Dividend Yield keywordiv.Select check box and click use, or click on code directly (DY)3.Select time period of static data to be Latest value or any other wanted dateIf selected back date, dividend yield will be 12 months back date from the selected date 4.Design your display options, by checking the box of each itemThe recommended items to choose for display arei.Display Row & Column titlesii.Display currency (currency by default will normally be local currency of those instruments)iii.Display latest value first (this will sort value to show latest period first)iv.Hyperlink to Series Metadata (this will show link to open pop-up page with description of each instrument)v.Check “Embed Formula” box (This will allow user to edit t his request again in the future)Dividend Yield unit is percentage- PriceRetrieving Data using “Thomson Reuters Datastream” TabHow to search for data types, and select display in Excel by using “Thomson Reuters Datastream” tab Retrieving Price for an instrument over a specific time periodRefer to “How to search for for data types, and select display in Excel by using “Thomson Reuters Datastream” tab” manual before proceeding on the following steps.We have 2 options to display Price of each stock1.Leave data types blankAfter input the instruments (Stocks), leave data types to be blank and click submitPrice (closed price) will be default data that display from this request2.Search for “Price”v.Press Datatypes buttonvi.Search for Equities category on the drop boxvii.Search for Price keywordviii.Select check box and click use, or click on code directly (P)3.Select time period of historical data, and frequencyTime period – can be input as default format: Start of Week, End of Week, and etc.Also can be input as exact date: DD/MM/YYYY (28/07/2015) Frequency – should select the suitable frequency that related to data typeFor example; Economic data with Monthly or Quarterly frequencyFinancial items data with Quarterly or Yearly frequencyStock price for any frequency4.Design your display options, by checking the box of each itemThe recommended items to choose for display arei.Display Row & Column titlesii.Display codeiii.Display currency (currency by default will normally be local currency of those instruments)iv.Display latest value first (this will sort value to show latest period first)v.Hyperlink to Series Metadata (this will show link to open pop-up page with description of each instrument)vi.Check “Embed Formula” box (This will allow user to edit this request again in the future)- Total ReturnRetrieving Data using “Thomson Reuters Datastream” TabHow to search for data types, and select display in Excel by using “Thomson Reuters Datastream” tab Retrieving Total Return for an instrument over a specific time periodRefer to “How to search for for data types, and select display in Excel by using “Thomson Reuters Datastream” tab” manual before proceeding on the following steps.Since RI (Total Return) is the Total Return from the first listed date of stock in the market.Therefore, we need to apply formula of percent change to calculate for return on specificperiod1.Apply formula on data typei.Click Edit Request to edit formulaii.Click to add Percent ChangeThis function will be able to apply Excel calculation formula on your selected data types.This will save your time instead of pulling out historical data and manually calculate by Excel Example: Average (AVG#), Percent change (PCH#), Number of decimals to be shown (DPL#)iii.Search for percent change formulaiv.Type in X(RI) in the expression boxv.Type in period D = Day, W = Week, M = Month, Q = Quarter, Y= Year vi.Formula will show up as PCH#(X(RI),1Y)Example: -13.43% is the Total Return of APPLE stock for the past 1 year from 28/07/2015 to 28/07/2016- Multiple InstrumentsRetrieving Data using “Thomson Reuters Datastream” TabHow to retrieve multiple instruments in Excel by using “Thomson Reuters Datastream” tab Refer to “How to search for instruments in Excel by using “Thomson Reuters Datastream” tab”manual before proceeding on the following steps.1.Retrieving multiple instruments in one requestThis will help to input many instruments and save time for requesting each time series data.User needs to find list of instruments first.a.Find Seriesi.Click Find Series button to search for specific instrumentse key word search or Explore button (same method as after clicking findseries button when search for instruments)iii.This example we search the same method;Explore → Equities → Thailand → select first 7 sectorsThen export all 140 stocks from 7 sectors to ExcelOr can check boxes of all wanted instrument and click use to retrieve multiple instruments in one timeb. Create Listi.After exporting the list of wanted stocks into new Excel sheet, next step is to save thislist in the systemii.Click “Lists (Create from Range)” buttoniii.Then click “C hange selection” to refer to column B (with codes of 140 stocks)iv.Input your name in the Mnemonic (L#) Box - format must be L# and follow by name Example: Name this new list as L#TEST1Check “Validate on upload”, this will validate whether your stocks have data or not.This is an option and can choose not to check “Validate” alsoYour list now will be saved as L#TEST1 nameThen, starting to get a new data set. The request step can be only input the list name that we have created.v.By search for your created list L#TEST1vi.Pop-up window will show result of list in the system and detailsvii.Double click name L#TEST1 to use and start retrieving dataviii.Retrieve L#TEST1ix.Data type P = Price, MV = Market Capital Valuex.Check box of “TS for each item in list” to show data of TS (Time Series for all 140 stocks in list TEST1) →if this box hasn’t been checked, time series of list L#TEST1 couldn’t be retrievedResult: Price and Market cap for all stocks will be shown for 2 years historical data。
影响因子基本知识

是什么?影响因子(Impact Factor,IF)是汤森路透(Thomson Reuters)出品的期刊引证报告(Journal Citation Reports,JCR)中的一项数据。
影响因子现已成为国际上通用的期刊评价指标(注意是期刊而非单篇论文),它不仅是一种测度期刊有用性和显示度的指标,而且也是测度期刊的学术水平,乃至论文质量的重要指标。
哪里来?在1998年,美国科技信息研究所所长尤金•加菲尔德(Eugene Garfield)博士在《科学家》(The Scientists)杂志中叙述了影响因子的产生过程。
说明他最初提出影响因子的目的是为《现刊目次,Current Contents》评估和挑选期刊。
人们所说的影响因子一般是指从1975年开始,《期刊引用报告》(Journal Citation Reports,JCR)每年提供上一年度世界范围期刊的引用数据,给出该数据库收录的每种期刊的影响因子。
JCR是一个世界权威性的综合数据库,它的引用数据来自世界上3000多家出版机构的7000多种期刊,专业范围包括科学、技术和社会科学。
JCR是世界上评估期刊一个综合性工具,它收集了全世界各个专业的期刊的引用数据,可以告诉人们:哪些是最有影响力的期刊,哪些是最常用的期刊,哪些是最热门的期刊,对文献计量学意义重大。
怎么算?* 2015年发表2014年的影响因子报告,一般在6、7月份;* 2014年的影响因子是看2012-2013年的期刊文章在2014年被引用的情况;举例:某刊2012-2013的文章在2014年的被引次数总计:985该刊2012-2013年的发文量总计:211该刊2014年的影响因子:4.6682 = 985÷211该数据将在2015年6、7月份发布哪里查?最官方的数据可以访问外文数据库Web of Science中的JCR(Journal Citation Reports)部分,其中JCR Science Edition用于查询自然科学类期刊,JCR Social Sciences Edition用于查询人文社会科学类期刊。
汤森路透是什么
汤森路透是什么问题一:汤森路透的介绍汤森路透(Thomson Reuters)成立于2008年4月17日,是由加拿大汤姆森公司(The Thomson Corporation)与英国路透集团(Reuters Group PLC)合并组成的商务和专业智能信息提供商。
主要为专业企业、金融机构和消费者提供财经信息服务,例如电子交易系统、企业管理系统和风险管理系统、桌面系统、新闻,以及为在法律、税务和会计、科学、医疗保健和媒体市场的专业人员提供智能信息及解决方案。
问题二:汤森路透和路透的区别通常说的路透是指路透社,业务media传媒,虽然更有名气,其实只是整个大公司下面的一个小公司,其收入占的全公司利润份额也不高汤森路透就是整个公司了,自从汤森收购了路透,现在就只有汤森路透,旗下10多个不同领域的公司和业务问题三:“路透”是什么意思?既然你已经知道路透社的由来了,那么路透的意思就是快讯呀,或者更简单点说就是最新时讯消息,片场路透就是片场快讯,直击片场最新消息问题四:汤森路透集团的公司简介汤森路透集团是全球最大的专业信息服务提供商。
我们将专业知识与创新科技相结合,为金融、法律、税务与财会、科学技术、知识产权、医疗保健和媒体等领域的专业人员和决策者提供重要的信息。
集团总部位于纽约,主要分支机构设于英国伦敦、美国明尼苏达州伊根等地。
集团在100 个国家和地区设有分支机构,共有5万多名员工。
集团股票在美国纽约证券交易所(NYSE:TRI)、加拿大多伦多股票交易所(TSX:TRI) 上市交易。
信息来源于若邻问题五:汤森路透的在中国发展路透社在中国的运营始于1871年。
目前,汤森路透在整个中国雇用了超过1500名员工,在中国大陆的雇员总人数超过900人,在北京、上海、深圳、广州、香港和台湾省均设有办事处。
2002年,汤森路透法律信息集团正式在中国设立办事机构。
汤森路透法律信息集团为来自法律、税务、会计、知识产权、合规管理等领域和 ... 部门的专业人士提供智能的、贴近实际工作的产品和专业的服务。
汤森路透数据库帮助文档

QRG-102 [RP]PASSWORDSYour password for is the same for all Thomson Reuters Investment Banking products, including Thomson Reuters Spreadsheet Link, Thomson Reuters Presentation Link, and Thomson Reuters Deal Analytics. To change your password1. Go to , and type your Username and Password.2. Select Change your password .3. If prompted, select Set Up Security Questions , and complete the security questions. Once completed, click Continue .4. Enter and confirm your new password. This action will terminate the active session and you will have to login again with the new password.5. Check the I Agree checkbox and click either Save and Return to Thomson One Login or Save . To log on when you have forgotten your password 1. On the logon page, click Forgot Your Password? 2. In the Username field, type your user name. 3. In the Characters Shown in Image field, type the characters that you see in the image. 4. Click Next .5. Type the e-mail address associated with your account.6. Click Send Email .7. When you receive an e-mail from Thomson Reuters, open the e-mail, click the link to reset your password, and follow the instructions for Change your Password .LOOKING UP AN INSTRUMENTEntity Manager has three broadcast boxes for entering a symbol, watchlist, or market. When you enter a value into a broadcast box, services that have related content populate with data on that value. Click to look up commodities, interest rates and other instrument types.1. From the security identifier drop-down, select the type of identifier (Symbol/Name, All Companies, CUSIP, SEDOL, ISIN, or PERMID) that best describes the security you are entering.2. Type a symbol or company name in the search box and click Go .3. If the company symbol is not known, click .4. To search for publicly traded companies and instruments:a. In the Qualifiers row, click the links to select an instrument or exchange/country.b. T o include results outside the primary exchange, clear the Primary Exchange Only check box. 5. To search for private or inactive companies:a. Select the Private Companies/Other check boxb. T o include Inactive Companies in your results, select the check box.6. In the Search row, select a search type from the drop-down, type the search terms in the text box, and click Search .7. Click a result to select it in the Entity Manager. 8. To add the selected item to your watchlist, click.You can set up your preferences so private companies are automatically included in a search: Go to Customize > Preferences > Identifier and Price > Company NameSearch. Click the Private Company Automatically Included check box, and click Save.SETTING AND ORGANIZING FAVORITESWhen you set up a service as a Favorite, it appears under for easy access. To add a service to your Favorites, open the page, click, and then select Add to Favorites . To organize your favorites1. Click , and select Organize Favorites .2. If you want to create and name folders, click Create Folder , and type in a name.3. Drag a favorite into any folder, or click up or down arrows to move it to a different place in the list.4. Click OK .To set any page as your Home Page• Click , and select Set as Home .To return to your home page at any time• Click .AUTOMATIC SYMBOL ENTRY OR“LISTENING”When a symbol (e.g., IBM-US) appears in the broadcast box, automatically applies this symbol(“Listens”) when you switch to a different page and populates it with related data.To turn off automatic symbol entry• Click the yellow icon in the service title bar so that it turnsgray (indicating “Not Listening” to the broadcast box).You may want to turn off automatic symbol entry when you want to freeze content on a page.MONITORING A COVERAGE LISTFlex Monitor allows you to create and save an unlimited number of symbol lists so you can easily monitor the latest quotes data. Each symbol list can include up to 1024 stocks, bonds, options, commodities, market indexes, and statistics. To create a Symbol Watchlist• Click , and give your list a name. Click OK .To add a symbol to Flex Monitor• Left-click within a Flex Monitor cell, and type a symbol. Click outside the entry field to activate. To delete a symbol from Flex MonitorSelect a symbol in your list, right-click it, and then choose Delete .To sort columns in Flex Monitor• Right-click the column head that you want to use as the sortcriterion, choose Sort and then choose Ascending or Descending . You can also work with your coverage list under Tools & Tips > My Watchlists . Select a watchlist (My Watchlists, Shared Watchlists, Market Indexes, or Industry Lists) from the View drop down and then click Go .Access Watchlist Views > Watchlist Activity to view News, Research, Deals, Events, and Filings headlines; as well as Transcripts and Briefs, Estimates Guidance, and the ability to download research on the coverage watchlist.To select a watchlist (personal or shared), an Index or an Industry Classification, go to Watchlist Views and select a watchlist from the Watchlist dropdown in the top toolbar.SETTING ALERTSYou can set alerts on Price & Volume, News, and Filings.When an alert is triggered, you have the option of viewing the alert in your inbox, receiving an e-mail, or showing a pop-up alert indicator.To set alerts1. You can access the Alert Manager by: • Clicking Alerts in Flex Monitor.• Tools & Tips > My Alerts > Alert Manager.• My Pages > Alert Inbox > Go to Alert Manager2. Select the content set and criteria for your alerts (Price & Volume, News, and/or Filings).3. Select a company or a watchlist.4. Set your delivery options.5. Click Save . To access alertsGo to one of the following: • My Pages > Alert Inbox .• Tools & Tips > My Alerts > Alert Manager- Click Go to Inbox .You can also receive e-mail notices on Events, Briefs,Transcripts and Delta Reports based on a time period you determine. Go to Tools & Tips > My Alerts > Event Alerting .USING THE DRILL DOWN CAPABILITYDrill down fields are the underlined fields in Flex Monitor that link to other windows, known as target windows. Clicking a drill down field activates the target window and retrieves a display for the symbol selected. To create/edit a drill down1. Right-click in Flex Monitor, and select Drill Downs .2. Select a field from the Fields box.3.Select a service to link to from the Available Services tolink to box.4.Click Link to create a link or Unlink to disable a link.5.Click OK.USING MY PAGESMy Pages allows you to configure and customize a set of pages of your own choosing in your workspace. It has been pre-set with the following:•My Thomson ONE – Contains useful information including the latest enhancements, hints and tips.•My News – A sample (set to A/) shows all news. Another sample (set to N/TMN) shows news on acquisitions, andmergers & takeovers. You can change these displays byentering codes for your preferred settings. These components are set to “Not Listen” to the broadcast box so they willmaintain your current settings.To set up and manage your custom pages1.Click Customize, and choose Organize Workspace.2.To add a group or page to My Pages, select My Pages, andclick Add Group or Add Page. the page, and then drag a service from the InsertOption menu. You can add multiple services to a page. 4.To change the order of a page, right-click it and chooseMove Up or Move Down.5.To move a group or page into a different group, click it,and then drag it to the target group. MODIFYING THE APPEARANCE OF A PAGEYou can change the appearance of the Market Views > Market Monitor page and the My Pages page by rearranging and resizing the service.•To move a service section, click its title bar and drag it to a new location.•To resize a service, use the cursor to drag the bottom (or top) border of the service to shrink or expand its viewing area. •To hide the title bar of a service, right-click within the service and choose Hide Titlebar.FLOATING SERVICESFloating services are services that are displayed in separate browser windows while is running, even when it is minimized. To add a new floating service•Right-click within a service in your workspace, and click Open as Floating.To view a menu of your floating services•Click .To access a floating service•Click , and then click the service.SETTING PREFERENCESYou can set navigation and user preferences for several pages including Advanced Filings, Deals, Estimates, Private Equity and Watchlist Activity.To set preferences1.Click .2.Click Preferences.COMMONLYUSED NEWS SYMBOLSCommonly Used Industry CodesEXCHANGE SPECIFIC QUOTESTo access a quote from a specific exchange, type a symbol-exchange qualifier as a suffix to a symbol(e.g., IBM-P, for IBM trading on ArcaEx).FREQUENTLY USED INDICES AmericasFREQUENTLY USED RATESUS RatesONLINE HELP & CUSTOMER SUPPORTClick to open the Help/Supportmenu:•Help Contents – Opens Help forthe currently displayed feature andother help topics.•Customer Support –Contains support e-mail address and contact phonenumbers for global customer support.Clickhttps:///kccontactus/tele phone.aspx. Select Former Thomson Financial Products and then the country to locate the correct number forsupport.。
汤森路透 全球创新报告

REUTERS“法雷奥的理想是将最具创新意义的技术融入到数亿人驾驶的车辆之中。
目录引言 (4)观察与发现....................................................................................................................................................................................5-6航空航天与国防................................. 7-12信息技术..........................................43-48汽车....................................................13-18医疗器械..........................................49-54生物技术...........................................19-24石油和天然气..................................55-60化妆品与健康..................................25-30制药...................................................61-66食品、饮料、烟草..........................31-36半导体.............................................. 67-72家电.................................................. 37-42通讯...................................................73-78颠覆性创新推动实现两位数增长在当今社会中,许多事情都需要群策群力才能完成,创新也不例外。
汤森路透数据库帮助文档
QRG-102 [RP]PASSWORDSYour password for is the same for all Thomson Reuters Investment Banking products, including Thomson Reuters Spreadsheet Link, Thomson Reuters Presentation Link, and Thomson Reuters Deal Analytics. To change your password1. Go to , and type your Username and Password.2. Select Change your password .3. If prompted, select Set Up Security Questions , and complete the security questions. Once completed, click Continue .4. Enter and confirm your new password. This action will terminate the active session and you will have to login again with the new password.5. Check the I Agree checkbox and click either Save and Return to Thomson One Login or Save . To log on when you have forgotten your password 1. On the logon page, click Forgot Your Password? 2. In the Username field, type your user name. 3. In the Characters Shown in Image field, type the characters that you see in the image. 4. Click Next .5. Type the e-mail address associated with your account.6. Click Send Email .7. When you receive an e-mail from Thomson Reuters, open the e-mail, click the link to reset your password, and follow the instructions for Change your Password .LOOKING UP AN INSTRUMENTEntity Manager has three broadcast boxes for entering a symbol, watchlist, or market. When you enter a value into a broadcast box, services that have related content populate with data on that value. Click to look up commodities, interest rates and other instrument types.1. From the security identifier drop-down, select the type of identifier (Symbol/Name, All Companies, CUSIP, SEDOL, ISIN, or PERMID) that best describes the security you are entering.2. Type a symbol or company name in the search box and click Go .3. If the company symbol is not known, click .4. To search for publicly traded companies and instruments:a. In the Qualifiers row, click the links to select an instrument or exchange/country.b. T o include results outside the primary exchange, clear the Primary Exchange Only check box. 5. To search for private or inactive companies:a. Select the Private Companies/Other check boxb. T o include Inactive Companies in your results, select the check box.6. In the Search row, select a search type from the drop-down, type the search terms in the text box, and click Search .7. Click a result to select it in the Entity Manager. 8. To add the selected item to your watchlist, click.You can set up your preferences so private companies are automatically included in a search: Go to Customize > Preferences > Identifier and Price > Company NameSearch. Click the Private Company Automatically Included check box, and click Save.SETTING AND ORGANIZING FAVORITESWhen you set up a service as a Favorite, it appears under for easy access. To add a service to your Favorites, open the page, click, and then select Add to Favorites . To organize your favorites1. Click , and select Organize Favorites .2. If you want to create and name folders, click Create Folder , and type in a name.3. Drag a favorite into any folder, or click up or down arrows to move it to a different place in the list.4. Click OK .To set any page as your Home Page• Click , and select Set as Home .To return to your home page at any time• Click .AUTOMATIC SYMBOL ENTRY OR“LISTENING”When a symbol (e.g., IBM-US) appears in the broadcast box, automatically applies this symbol(“Listens”) when you switch to a different page and populates it with related data.To turn off automatic symbol entry• Click the yellow icon in the service title bar so that it turnsgray (indicating “Not Listening” to the broadcast box).You may want to turn off automatic symbol entry when you want to freeze content on a page.MONITORING A COVERAGE LISTFlex Monitor allows you to create and save an unlimited number of symbol lists so you can easily monitor the latest quotes data. Each symbol list can include up to 1024 stocks, bonds, options, commodities, market indexes, and statistics. To create a Symbol Watchlist• Click , and give your list a name. Click OK .To add a symbol to Flex Monitor• Left-click within a Flex Monitor cell, and type a symbol. Click outside the entry field to activate. To delete a symbol from Flex MonitorSelect a symbol in your list, right-click it, and then choose Delete .To sort columns in Flex Monitor• Right-click the column head that you want to use as the sortcriterion, choose Sort and then choose Ascending or Descending . You can also work with your coverage list under Tools & Tips > My Watchlists . Select a watchlist (My Watchlists, Shared Watchlists, Market Indexes, or Industry Lists) from the View drop down and then click Go .Access Watchlist Views > Watchlist Activity to view News, Research, Deals, Events, and Filings headlines; as well as Transcripts and Briefs, Estimates Guidance, and the ability to download research on the coverage watchlist.To select a watchlist (personal or shared), an Index or an Industry Classification, go to Watchlist Views and select a watchlist from the Watchlist dropdown in the top toolbar.SETTING ALERTSYou can set alerts on Price & Volume, News, and Filings.When an alert is triggered, you have the option of viewing the alert in your inbox, receiving an e-mail, or showing a pop-up alert indicator.To set alerts1. You can access the Alert Manager by: • Clicking Alerts in Flex Monitor.• Tools & Tips > My Alerts > Alert Manager.• My Pages > Alert Inbox > Go to Alert Manager2. Select the content set and criteria for your alerts (Price & Volume, News, and/or Filings).3. Select a company or a watchlist.4. Set your delivery options.5. Click Save . To access alertsGo to one of the following: • My Pages > Alert Inbox .• Tools & Tips > My Alerts > Alert Manager- Click Go to Inbox .You can also receive e-mail notices on Events, Briefs,Transcripts and Delta Reports based on a time period you determine. Go to Tools & Tips > My Alerts > Event Alerting .USING THE DRILL DOWN CAPABILITYDrill down fields are the underlined fields in Flex Monitor that link to other windows, known as target windows. Clicking a drill down field activates the target window and retrieves a display for the symbol selected. To create/edit a drill down1. Right-click in Flex Monitor, and select Drill Downs .2. Select a field from the Fields box.3.Select a service to link to from the Available Services tolink to box.4.Click Link to create a link or Unlink to disable a link.5.Click OK.USING MY PAGESMy Pages allows you to configure and customize a set of pages of your own choosing in your workspace. It has been pre-set with the following:•My Thomson ONE – Contains useful information including the latest enhancements, hints and tips.•My News – A sample (set to A/) shows all news. Another sample (set to N/TMN) shows news on acquisitions, andmergers & takeovers. You can change these displays byentering codes for your preferred settings. These components are set to “Not Listen” to the broadcast box so they willmaintain your current settings.To set up and manage your custom pages1.Click Customize, and choose Organize Workspace.2.To add a group or page to My Pages, select My Pages, andclick Add Group or Add Page. the page, and then drag a service from the InsertOption menu. You can add multiple services to a page. 4.To change the order of a page, right-click it and chooseMove Up or Move Down.5.To move a group or page into a different group, click it,and then drag it to the target group. MODIFYING THE APPEARANCE OF A PAGEYou can change the appearance of the Market Views > Market Monitor page and the My Pages page by rearranging and resizing the service.•To move a service section, click its title bar and drag it to a new location.•To resize a service, use the cursor to drag the bottom (or top) border of the service to shrink or expand its viewing area. •To hide the title bar of a service, right-click within the service and choose Hide Titlebar.FLOATING SERVICESFloating services are services that are displayed in separate browser windows while is running, even when it is minimized. To add a new floating service•Right-click within a service in your workspace, and click Open as Floating.To view a menu of your floating services•Click .To access a floating service•Click , and then click the service.SETTING PREFERENCESYou can set navigation and user preferences for several pages including Advanced Filings, Deals, Estimates, Private Equity and Watchlist Activity.To set preferences1.Click .2.Click Preferences.COMMONLYUSED NEWS SYMBOLSCommonly Used Industry CodesEXCHANGE SPECIFIC QUOTESTo access a quote from a specific exchange, type a symbol-exchange qualifier as a suffix to a symbol(e.g., IBM-P, for IBM trading on ArcaEx).FREQUENTLY USED INDICES AmericasFREQUENTLY USED RATESUS RatesONLINE HELP & CUSTOMER SUPPORTClick to open the Help/Supportmenu:•Help Contents – Opens Help forthe currently displayed feature andother help topics.•Customer Support –Contains support e-mail address and contact phonenumbers for global customer support.Clickhttps:///kccontactus/tele phone.aspx. Select Former Thomson Financial Products and then the country to locate the correct number forsupport.。
基于ESI数据库的国内外化学研究机构分析

基于ESI数据库的国内外化学研究机构分析化学研究机构是科学研究的重要力量,对于推动化学领域的发展和创新具有重要作用。
本文将基于ESI数据库对国内外化学研究机构进行分析,探讨其研究方向、影响力和合作情况等方面的信息。
ESI数据库(Essential Science Indicators)是汤森路透公司(Thomson Reuters)开发的一个评估研究机构和学者影响力的工具,通过对全球各领域科学研究论文的引用分析,提供了一系列详细的统计数据和排名信息。
本文将以化学领域为例,分析ESI数据库中的国内外化学研究机构。
首先,我们可以通过查找ESI数据库中的“化学”领域,获取相关的信息。
从论文数量来看,国内外化学研究机构的发文数量呈现出一定的差距,国外机构在发文数量上明显领先于国内机构。
但并不代表国内机构的研究水平较低,而是反映了国外机构历史较长、资源较丰富等客观因素。
同时,国内化学研究机构在一些特定的研究领域也有较高的发表数量和影响力。
其次,我们可以通过ESI数据库中的“热点论文”来了解化学研究机构的研究方向。
热点论文是指被广泛引用的研究成果,在相应领域具有较大影响力。
通过对国内外化学研究机构热点论文的分析,可以发现不同机构在研究方向上的差异。
国外化学研究机构在有机合成、配位化学、材料化学等领域相对较为突出,而国内机构在环境化学、天然产物化学、药物化学等领域也有很好的研究表现。
此外,值得注意的是,化学研究机构的合作情况。
通过ESI数据库中的合作论文分析,可以发现不同机构在合作方面的情况。
合作关系既可以是国内外不同机构之间的合作,也可以是机构内部的不同团队之间的合作。
合作论文的数量和质量既反映了机构的合作能力,也反映了机构之间的合作积极性和合作共识。
通过对合作论文的分析,可以发现一些研究机构之间存在密切的合作关系,这种合作模式有助于资源共享、经验交流和研究成果的共同发表。
总结来说,基于ESI数据库的国内外化学研究机构分析是了解化学领域研究机构的重要手段。
- 1、下载文档前请自行甄别文档内容的完整性,平台不提供额外的编辑、内容补充、找答案等附加服务。
- 2、"仅部分预览"的文档,不可在线预览部分如存在完整性等问题,可反馈申请退款(可完整预览的文档不适用该条件!)。
- 3、如文档侵犯您的权益,请联系客服反馈,我们会尽快为您处理(人工客服工作时间:9:00-18:30)。
100 Clients are using RET on the hosted enviroment 30 Clients are using RET on deployed basis
RET-AD Client base
Aegisoft – Liquidity aggregation
What´ s next?
• Improved trade process through STP
Market Making on Reuters Trading for FX
Taker client applet Taker deal ticket
Price Maker applet
Taker deal ticket
RET - Preferred vendor solution
• Early Take-up
•
Rate Extension
• Templet Based Trading: FX Options, FRAs, CAPs&Floors
Forward/SwapsTrading – FX Option
User Interfaces
• Integration of Aegisoft Athena FX, the leading FX Aggregation Platform
Aegisoft AthenaFX Aggregation function
• FX ECNs
– Reuters, EBS
– Currenex, HotSpot, etc. • FX Banks – Barclays, Citi, Deutsche Bank – Nordea, HSBC, etc. • • Synthetic FX Crosses FX Futures in Spot Terms
•
•
RTFX – Overview
• Execute FX Trading from Xtra or Dealing Keystation • Compare streaming executable prices from multiple liquidity providers • Trade Spot, Forwards, FX Swaps and Bullion • Broad range of currency trades including Majors and Emerging Markets • Competitive RFQ, one click trading (Fast Trade) and Orders
Reuters Electronic Trading
Johann Leikert Sales Manager Sales Specialists Sales & Trading CEE
Rovinj, May 2010
RET – Automated Dealing
RET-AD
RET - Automated Dealing (RET-AD) enables banks to offer their corporate customers and branches the ability to trade directly with them.
The TRM allows traders to dynamically manipulate the system Market rate feed. • Configure Pricing Styles • Direct, Crossed or Derived
• Handle different Spreads
Additional Features
•
Liquidity in/outsourcing • Back to Back Trades Order Management • Order Access • Automated Orders Connection to Multi-bank portals • FX ALL • Currenext • 360T • RTFX
FX Week awarded Thomson Reuters Best Broker for Currency Options, Best Broker for Emerging Markets and Best Vendor for Dealing Technology accolades in November 2009.
• Rate Blending • View Current Rates
Trader Applet
Manual intervention
Filters and Modifiers
• Filters are used to route deals from clients to trader and to configure the autotrader • Modifiers can be defined per instrument, user or user group, currency, tenor or ‘Bid’ and ‘Offer’ to apply margins automatically.
• Client Applet • Proxy Applet (client advisor trades on behalf of his client) • Trader Applet • Administration Applet
Rate Monitor
Trade Rate Manager
Trading Styles
One click Trading
Trading Styles
RFQ
Supported Instruments
• FX Spot
• Roll Spot to Forward trade
• FX forward outright
• NDF
• FX Swap • Time option • Deposit and Loan • Auxiliary Trade