基于matlab的频谱分析仪设计
实验一 基于Matlab 的频谱分析
实验一 基于Matlab 的频谱分析一、实验目的1、 掌握时域抽样定理。
2、通过实验加深对FFT 的理解;3、熟悉应用FFT 对典型信号进行频谱分析的方法。
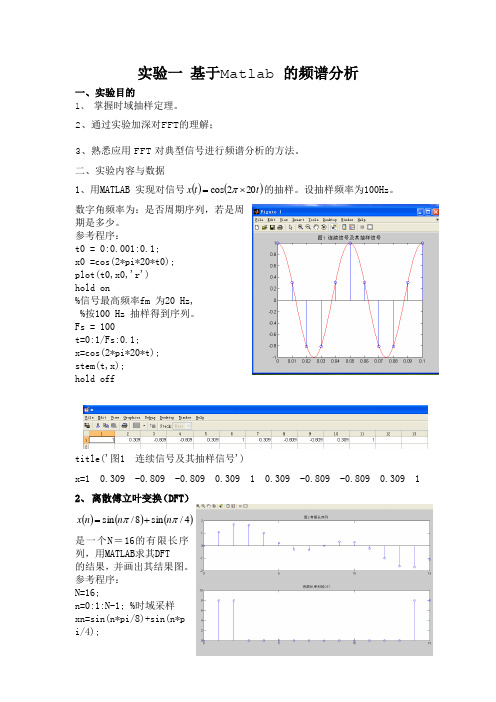
二、实验内容与数据1、用MATLAB 实现对信号()()t t x 202cos ⨯=π的抽样。
设抽样频率为100Hz 。
数字角频率为:是否周期序列,若是周期是多少。
参考程序:t0 = 0:0.001:0.1;x0 =cos(2*pi*20*t0);plot(t0,x0,'r')hold on%信号最高频率fm 为20 Hz,%按100 Hz 抽样得到序列。
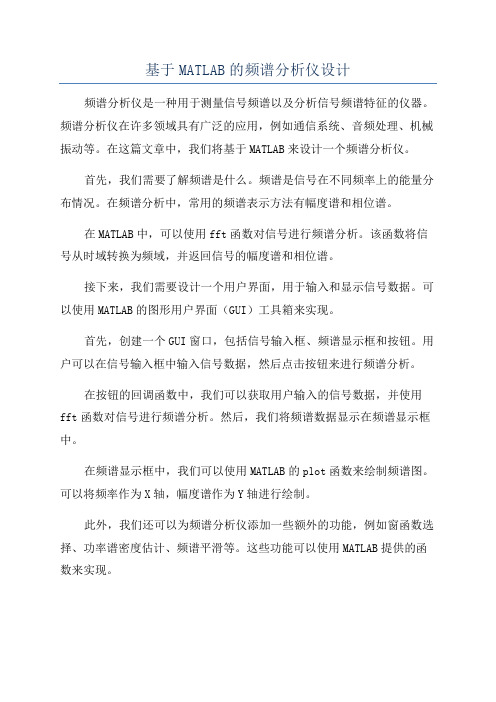
Fs = 100t=0:1/Fs:0.1;x=cos(2*pi*20*t);stem(t,x);hold offtitle('图1 连续信号及其抽样信号')x=1 0.309 -0.809 -0.809 0.309 1 0.309 -0.809 -0.809 0.309 12、 离散傅立叶变换(DFT )()()()4/sin 8/sin ππn n n x +=是一个N =16的有限长序列,用MATLAB 求其DFT的结果,并画出其结果图。
参考程序:N=16;n=0:1:N-1; %时域采样xn=sin(n*pi/8)+sin(n*pi/4);k=0:1:N-1; %频域采样WN=exp(-j*2*pi/N);nk=n'*k;WNnk=WN.^nk;Xk=xn*WNnk;subplot(2,1,1)stem(n,xn);title('图2 有限长序列')subplot(2,1,2)stem(k,abs(Xk));title('有限长序列的DFT')结果:Xk=-0 + 0i -0 - 8i -0 - 8i 0 - 0i 0 - 0i 0 - 0i 0 - 0i 0 - 0i 0 - 0i 0 - 0i0 - 0i -0 - 0i 0 - 0i 0 - 0i 0 + 8i 0 + 8i3、快速傅立叶变换(FFT)MATLAB 为计算数据的离散快速傅立叶变换,提供了一系列丰富的数学函数,主要有Fft、Ifft、Fft2 、Ifft2, Fftn、ifftn和Fftshift、Ifftshift等。
基于MATLAB的频谱分析仪设计
基于MATLAB的频谱分析仪设计
频谱分析仪是一种用于测量信号频谱以及分析信号频谱特征的仪器。
频谱分析仪在许多领域具有广泛的应用,例如通信系统、音频处理、机械振动等。
在这篇文章中,我们将基于MATLAB来设计一个频谱分析仪。
首先,我们需要了解频谱是什么。
频谱是信号在不同频率上的能量分布情况。
在频谱分析中,常用的频谱表示方法有幅度谱和相位谱。
在MATLAB中,可以使用fft函数对信号进行频谱分析。
该函数将信号从时域转换为频域,并返回信号的幅度谱和相位谱。
接下来,我们需要设计一个用户界面,用于输入和显示信号数据。
可以使用MATLAB的图形用户界面(GUI)工具箱来实现。
首先,创建一个GUI窗口,包括信号输入框、频谱显示框和按钮。
用户可以在信号输入框中输入信号数据,然后点击按钮来进行频谱分析。
在按钮的回调函数中,我们可以获取用户输入的信号数据,并使用fft函数对信号进行频谱分析。
然后,我们将频谱数据显示在频谱显示框中。
在频谱显示框中,我们可以使用MATLAB的plot函数来绘制频谱图。
可以将频率作为X轴,幅度谱作为Y轴进行绘制。
此外,我们还可以为频谱分析仪添加一些额外的功能,例如窗函数选择、功率谱密度估计、频谱平滑等。
这些功能可以使用MATLAB提供的函数来实现。
总结起来,基于MATLAB的频谱分析仪设计主要包括信号输入、频谱分析、频谱显示以及额外功能的添加。
通过MATLAB的函数和工具箱,我们可以方便地实现一个功能完善的频谱分析仪。
matlab频谱分析仪
%
%
GUOJING('CALLBACK',hObject,eventData,handles,...) calls the
local
%
function named CALLBACK in GUOJING.M with the given input
arguments.
%
%
GUOJING('Property','Value',...) creates a new GUOJING or
% --- Outputs from this function are returned to the command line. function varargout = guojing_OutputFcn(hObject, eventdata, handles) % varargout cell array for returning output args (see VARARGOUT); % hObject handle to figure % eventdata reserved - to be defined in a future version of MATLAB % handles structure with handles and user data (see GUIDATA)
% Get default command line output from handles structure varargout{1} = handles.output;
2
% --- Executes on button press in soundcard. function soundcard_Callback(hObject, eventdata, handles) % hObject handle to soundcard (see GCBO) % eventdata reserved - to be defined in a future version of MATLAB % handles structure with handles and user data (see GUIDATA)
matlab频谱分析仪
频谱分析仪摘要频谱分析仪是研究电信号频谱结构的仪器,用于信号失真度、调制度、谱纯度、频率稳定度和交调失真等信号参数的测量,是一种多用途的电子测量仪器。
随着软硬件技术的发展,仪器的智能化与虚拟化已成为未来实验室及研究机构的发展方向。
虚拟仪器技术的优势在于可由用户定义自己的专用仪器系统,且功能灵活,很容易构建,所以应用面极为广泛。
本文介绍了一种使用GUI工具箱用matlab实现的简易虚拟频谱分析仪的设计方法。
关键词matlab,频谱分析仪,时域分析,频域分析目录1概述 (3)2技术路线 (4)3实现方法 (5)3.1搭建GUI界面 (5)3.2信号输入 (6)3.2.1选择信号输入 (6)3.2.2声卡输入 (7)3.2.3读取wav文件 (7)3.2.4信号发生器输入 (7)3.3时域分析 (8)3.4频域分析 (9)3.5仿真 (10)3.5.1声卡输入 (10)3.5.2读取wav文件 (10)3.5.3信号发生器 (11)4存在的问题 (15)5致谢......................................................................................................... 错误!未定义书签。
参考文献 (15)1概述MATLAB是矩阵实验室(Matrix Laboratory)的简称,是美国MathWorks公司出品的商业数学软件。
可以进行矩阵运算、绘制函数和数据、实现算法、创建用户界面、连接其他编程语言的程序等,主要应用于工程计算、控制设计、信号处理与通讯、图像处理、信号检测、金融建模设计与分析等领域。
图形用户界面(Graphical User Interface,简称GUI,又称图形用户接口)是指采用图形方式显示的计算机操作用户界面。
与早期计算机使用的命令行界面相比,图形界面对于用户来说在视觉上更易于接受。
基于Matlab的DFT及FFT频谱分析

基于Matlab的DFT及FFT频谱分析基于Matlab的DFT及FFT频谱分析一、引言频谱分析是信号处理中的重要任务之一,它可以揭示信号的频率特性和能量分布。
离散傅里叶变换(DFT)及快速傅里叶变换(FFT)是常用的频谱分析工具,广泛应用于许多领域。
本文将介绍通过Matlab进行DFT及FFT频谱分析的方法和步骤,并以实例详细说明。
二、DFT及FFT原理DFT是一种将时域信号转换为频域信号的离散变换方法。
它将信号分解成若干个正弦和余弦函数的叠加,得到频率和幅度信息。
FFT是一种高效的计算DFT的算法,它利用信号的对称性和周期性,将计算复杂度从O(N^2)降低到O(NlogN)。
FFT通过将信号分解成不同长度的子序列,递归地进行计算,最终得到频谱信息。
三、Matlab中的DFT及FFT函数在Matlab中,DFT及FFT可以通过内置函数进行计算。
其中,DFT使用函数fft,FFT使用函数fftshift。
fft函数可直接计算信号的频谱,fftshift函数对频谱进行频移操作,将低频移到频谱中心。
四、Matlab中DFT及FFT频谱分析步骤1. 读取信号数据首先,将待分析的信号数据读入到Matlab中。
可以使用内置函数load读取文本文件中的数据,或通过自定义函数生成模拟信号数据。
2. 时域分析通过plot函数将信号数据在时域进行绘制,以观察信号的波形。
可以设置合适的坐标轴范围和标签,使图像更加清晰。
3. 信号预处理针对不同的信号特点,可以进行预处理操作,例如去除直流分量、滤波等。
这些操作可提高信号的频谱分析效果。
4. 计算DFT/FFT使用fft函数计算信号数据的DFT/FFT,并得到频谱。
将信号数据作为输入参数,设置采样频率和点数,计算得到频谱数据。
5. 频域分析通过plot函数将频谱数据在频域进行绘制,观察信号的频率特性。
可以设置合适的坐标轴范围和标签,使图像更加清晰。
6. 结果解读根据频谱图像,分析信号的频率成分、幅度分布和峰值位置。
频谱分析课程设计matlab

频谱分析课程设计matlab一、教学目标本课程的教学目标是使学生掌握频谱分析的基本原理和方法,能够运用MATLAB软件进行频谱分析。
具体目标如下:1.了解频谱分析的基本概念和原理。
2.掌握MATLAB软件的基本操作和编程方法。
3.能够运用MATLAB软件进行信号的频谱分析。
4.能够根据分析结果进行信号的调制和解调。
情感态度价值观目标:1.培养学生的创新意识和实践能力。
2.培养学生的团队合作意识和沟通能力。
二、教学内容本课程的教学内容主要包括两个部分:频谱分析的基本原理和MATLAB软件的使用。
1.频谱分析的基本原理:包括频谱的定义、频谱分析的方法和频谱分析的应用。
2.MATLAB软件的使用:包括MATLAB的基本操作、编程方法和频谱分析的MATLAB实现。
三、教学方法本课程的教学方法主要包括讲授法、案例分析法和实验法。
1.讲授法:通过讲解频谱分析的基本原理和方法,使学生掌握频谱分析的理论基础。
2.案例分析法:通过分析典型的频谱分析案例,使学生了解频谱分析的实际应用。
3.实验法:通过MATLAB软件进行频谱分析的实验,使学生掌握MATLAB软件的使用和频谱分析的方法。
四、教学资源本课程的教学资源包括教材、参考书、多媒体资料和实验设备。
1.教材:选用《信号与系统》和《MATLAB教程》作为主要教材,提供相关的理论知识和技术指导。
2.参考书:提供相关的论文和书籍,供学生进一步学习和研究。
3.多媒体资料:制作PPT和视频资料,用于辅助讲解和演示。
4.实验设备:提供计算机和MATLAB软件,用于实验和实践。
五、教学评估本课程的评估方式包括平时表现、作业和考试三个部分,以全面、客观、公正地评价学生的学习成果。
1.平时表现:通过课堂参与、提问、讨论等方式评估学生的学习态度和理解能力。
2.作业:布置相关的频谱分析练习题,评估学生对知识点的掌握和运用能力。
3.考试:期末进行闭卷考试,评估学生对频谱分析理论和MATLAB软件运用的综合能力。
基于LabVIEW和MATLAB的频谱分析仪设计
固《计量与洲斌桂术)2007牟第34卷第9期基于LabVIEW和MATLAB的频谱分析仪设计DesignontheVirtualSpectrumAnalysisInstrumentBasedonLabVIEWandMATIAB陈华丽(武汉科技大学,湖北武汉430081)摘要:介绍丁基于LaJ)VIEW和MATLAB的虚拟频藩分析仪的设计过程。
重点阐述了基于LabVIEW的前赍用户界面设计、基于MATLAB的后台信号分析算法研制两部分。
该仪器充分发挥了MATL^_B的数值运算功能、LabVIEW的动态显示和虚拟仪器特睦,以极小的成本实现了传统频谱分析仪的功能,且具有鏖好的扩展性和人机界面。
关键词:囝彤化编程;频谱分析仪;虚拟仪器1引言信号处理几乎涉及到所有的工程技术领域,面频谱分析又是信号处理中一个非常重要的分析手段。
一般的频学分析都依靠传统频谱分析仪来完成,价格昂贵,体积庞大,不便于工程技术人员的携带。
虚拟频谱分析仪改变了原有频谱分析仪的整体设计思路,用软件代替了硬件,使工程技术人员可以用一部笔记本电脑到现场就可轻松完成信号的采集、处理及频谱分析。
在工程领域中,LabVIEW和MATLAB是倍受程序开发人员青睐的两种语言,剐于一些需要做大量数据运算处理的复杂应用以及某些复杂的频谱分析算法LabVIEW显得有些力不从心。
而MATLAB不能实现端口操作和实时控制,在界面方面也稍逊一筹。
在实际工程应用中将二者结合起来取长补短,具有非常实用的价值。
本文将重点介绍基于LabVIEW和MAT—LAB的虚拟频谱分析仪的设计。
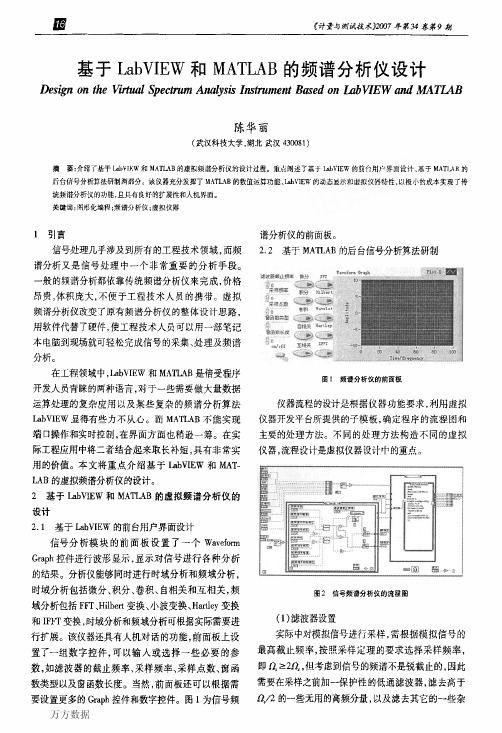
2基于LabVIEW和MATLAB的虚拟频谱分析仪的设计2.1基于LabVIEW的前台用户界面设计信号分析模块的前面板设置了一个WaveformGraph控件进行波形显示,显示对信号进行各种分析的结果。
分析仪能够同时进行时域分析和频域分析,时域分析包括微分、积分、卷积、自相关和互相关,频域分析包括F丌、Hilbert变换、小波变换、Hartley变换和IFFT变换,时域分析和频域分析可根据实际需要进行扩展。
基于.MATLAB的声音信号频谱分析仪设计说明书

1.概述随着软硬件技术的发展.仪器的智能化与虚拟化已成为未来实验室及研究机构的发展方向[1]。
虚拟仪器技术的优势在于可由用户定义自己的专用仪器系统.且功能灵活.很容易构建.所以应用面极为广泛。
基于计算机软硬件平台的虚拟仪器可代替传统的测量仪器.如示波器、逻辑分析仪、信号发生器、频谱分析仪等[2]。
从发展史看.电子测量仪器经历了由模拟仪器、智能仪器到虚拟仪器.由于计算机性能的飞速发展.已把传统仪器远远抛到后面.并给虚拟仪器生产厂家不断带来连锅端的技术更新速率。
目前已经有许多较成熟的频谱分析软件.如SpectraLAB、RSAVu、dBFA等。
声卡是多媒体计算机最基本的配置硬件之一.价格便宜.使用方便。
MATLAB是一个数据分析和处理功能十分强大的工程实用软件.他的数据采集工具箱为实现数据的输入和输出提供了十分方便的函数和命令[3]。
本文将给出基于声卡与MATLAB的声音信号频谱分析仪的设计原理与实现方法.功能包括:<1> 音频信号信号输入.从声卡输入、从WAV文件输入、从标准信号发生器输入;<2> 信号波形分析.包括幅值、频率、周期、相位的估计.以及统计量峰值、均值、均方值和方差的计算;<3> 信号频谱分析.频率、周期的估计.图形显示幅值谱、相位谱、实频谱、虚频谱和功率谱的曲线。
2.设计原理2.1波形分析原理2.1.1 信号频率、幅值和相位估计<1>频率<周期>检测对周期信号来说.可以用时域波形分析来确定信号的周期.也就是计算相邻的两个信号波峰的时间差、或过零点的时间差。
这里采用过零点<ti>的时间差T<周期>。
频率即为f = 1/T.由于能够求得多个T值<ti有多个>.故采用它们的平均值作为周期的估计值。
<2>幅值检测在一个周期内.求出信号最大值y max与最小值y min的差的一半.即A = <y max - y min>/2.同样.也会求出多个A值.但第1个A值对应的y max和y min不是在一个周期内搜索得到的.故以除第1个以外的A值的平均作为幅值的估计值。
- 1、下载文档前请自行甄别文档内容的完整性,平台不提供额外的编辑、内容补充、找答案等附加服务。
- 2、"仅部分预览"的文档,不可在线预览部分如存在完整性等问题,可反馈申请退款(可完整预览的文档不适用该条件!)。
- 3、如文档侵犯您的权益,请联系客服反馈,我们会尽快为您处理(人工客服工作时间:9:00-18:30)。
Frequency AnalyzerYangXiao M2013705103HuaZhong University of Science and TechnologySchool of Mechanical Science and Engineering Abstract: Matlab Is a numerical analysis, matrix calculation, scientific data visualization and nonlinear dynamic state system modeling and simulation, and other functions of practical software engineering.It’s easy to use the windows environment and cast off a tradition on the interactive programming language (such as C, Fortran) Edit mode In large range.In this report,The task is to design a frequency analyzer by using matlab.Keyword:frequency analyzer;Matlab;time-domainanalysis;frequency-domain analysis;1.PrefaceMATLAB is called Matrix Laboratory,which is designed by the United States MathWorks company.It’s a commercial mathematical software. Matlab can be use for Matrix operations, mapping functions and data, algorithm, creating the user interface, connect to other programming languages procedures, mainly used in engineering calculations, control design, signal processing and communications, image processing, signal detection, design and financial modeling analysis and other fields. GUI (Graphical User Interface, referred to as GUI, known Graphical User Interface) is displayed using the graphical user interface of computer operations.. Matlab has a powerful GUl tool. In this report, by using matlab GUI tool we could design a frequency analyzer.Frequency analyzer is the instrument which could be used to study the structure of the electrical signal spectrum, and used to measure the signal parameters of signal distortion, modulation, frequency stability and spectral purity.Frequency analyzer could be used to measure some parameters of amplifier and filter circuit system , and it is a kind of multipurpose electronic measuring instrument.FFT (Fast Fourier Transformation) is the fast algorithm of DFT(discrete Fourier transformtion), which is based on discrete Fourier transform.By using FFT we could get the answer faster than DFT.2.IntroduceThe frequency analyzer which is designed by using matlab have three models:record,play wav file and generator some waves .Every model could make three kinds of waveforms:the time domain figure,the frequency spectrum domain figure and the power spectrum figure.We could get the message we want from the frequency analyzer.The interface is that:2.1 Interface3. Design PrinciplesThe task is to design the frequency analyzer which can record,open wav file and play it,generator some kinds of waveforms . Each waveform could do FFT analysis and draw its frequency spectrum figure and power spectrum figure.3.1 signal input3.1.1 choose signal inputWhen we start using the frequency analyzer,we should first set the sampling frequency,sampling numbers and the model of inputting signal.The frequency analyzer has three model of inputting:it’s the record,open and play wav file,signal generator.The program is(just the record):val=get(handles.model,'Value');switch valcase 1h=findobj('Tag','recordtime');set(h,'enable','on');h=findobj('Tag','startrecord');set(h,'enable','on');h=findobj('Tag','filename');set(h,'enable','off');h=findobj('Tag','openfile');set(h,'enable','off');h=findobj('Tag','wave');set(h,'enable','off');h=findobj('Tag','amplitude');set(h,'enable','off');h=findobj('Tag','frequency');set(h,'enable','off');h=findobj('Tag','phase');set(h,'enable','off');h=findobj('Tag','add');set(h,'enable','off');h=findobj('Tag','generatorwave');set(h,'enable','off');When we choose one model ,the others couldn’t work.3.1.2 The recordWe could input the sound signal by using the microphone.Matlab provides the wavecord function,which can be used to get the signal of microphone.The program of record is :Fs=str2double(get(handles.samplefrequency,'String'));N=str2double(get(handles.recordtime,'String'))*Fs;handles.y=wavrecord(N, Fs,'double');handles.inputtype=1;guidata(hObject,handles);plot(handles.axes1,handles.y);ysize=size(handles.y);set(handles.samplenumber,'String',num2str(ysize(1)));3.1.3 Read the wav fileWe use the function of wavread to open the wav file and play it. Theprogram is:[fname,filepath]=uigetfile('*.wav','wav');set(handles.filename,'string',fname);[handles.y,Fs,bit]=wavread(fname);temp = wavread(get(findobj('Tag','filename'),'String'));handles.inputtype=2;guidata(hObject,handles);plot(handles.axes1,(1:length(handles.y))/Fs,handles.y);ysize=size(handles.y);set(handles.samplenumber,'String',num2str(ysize(1)));set(handles.samplefrequency,'string',Fs);wavplay(temp,Fs);3.1.4 Signal generatorMatlab has the general functions which can generator the general waveform directly.We judge the signals should add or not.The program is:Fs=str2double(get(handles.samplefrequency,'String'));N=str2double(get(handles.samplenumber,'String'));x=linspace(0,N/Fs,N);t=get(handles.wave,'Value');f=str2double(get(handles.frequency,'String'));a=str2double(get(handles.amplitude,'String'));p=str2double(get(handles.phase,'String')); switch tcase 1y=a*sin(2*pi*x*f+p);case 2y=a*square(sin(2*pi*x*f+p));case 3y=a*sawtooth(2*pi*x*f+p,0.5);case 4y=a*sawtooth(2*pi*x*f+p);case 5y=a*(2*rand(size(x))-1);endif get(handles.add,'Value')==0.0handles.y=y;elsehandles.y=handles.y+y;endhandles.inputtype=3;guidata(hObject,handles);plot(handles.axes1,handles.y);xlim([0 200]);3.2 Time domain analysisMatlab provides the functions of mean and std,which can easily calculate the mean and variance.The program is :Fs=str2double(get(handles.samplefrequency,'String'));N=str2double(get(handles.samplenumber,'String'));set(handles.vpp,'String',(max(handles.y)-min(handles.y)));set(handles.average,'String',mean(handles.y));set(handles.variance,'String',std(handles.y)^2);3.3 Frequency domain analysisMatlab provide the function of FFT,which can easily achieve the fast Fourier transform algorithm.The program is:Fs=str2double(get(handles.samplefrequency,'String'));N=str2double(get(handles.samplenumber,'String'));temple=handles.y;f=linspace(0,Fs/2,N/2);P=2*fft(temple,N)/N;Pyy=sqrt(P.* conj(P));plot(handles.axes2,f,Pyy(1:N/2));plot(handles.axes3,f,abs(P(1:N/2)).^2);3.4 Simulation3.4.1 The recordWe select the record ,set the record time and sampling frequency,pushthe start record button to begin recording.We can get the waveform of the sound in the graphic area axes1.If we push the time analysis button ,we could get the parameter of vpp,average variance.If we push the fft button,we could get the frequency spectrum figure and power spectrum figure in the graphic area axes2 and axes3.The result is shown:3.1 Image of record3.4.2 Read the wav fileThe result is shown:3.2 wav file amplitude-frequency characteristic3.4.3 Signal generatorWe set the waveform, amplitude, frequency, phase and other information to generate the waveform.The time domain analysis and frequency domain analysis is shown:3.3 amplitude-frequency characteristic of sin wave3.4 amplitude-frequency characteristic of square waveWe can add some waves and analysis3.5 phase frequency characteristics of Superposition signalOther waveform analysis:3.6 amplitude-frequency characteristic of noise4 .Exist problemWhen using the signal generator to generator the wave,the picture ofaxes3 (power spectrum)would change.I can’t solve this problem.And Ifail to build the window function.5.ConclusionIn the future study, I will learn MATLAB this powerful engineering software more harder and try to solve some common engineering problems.References[1] 薛山. MATLAB基础教程. [M] 北京:清华大学出版社,2011.3。