管理会计课后习题学习指导书习题答案第四章
管理会计课后习题参考答案
《管理会计》课后习题参考答案目录第一章管理会计概述 (1)1.理解资产高安全度、资产高利润率、现金流充足、资产高增值率和把握新产业 (1)2.简述基于业务优化的高质高效的财务支持 (1)3.简述管理会计的内涵是如何逐渐扩大的 (2)4.简述科学管理理论与管理会计的关系 (2)5.简述组织行为学与管理会计的关系 (2)6.简述权变理论与管理会计的关系 (3)7.简述信息经济学与管理会计的关系 (3)8.简述代理人理论与管理会计的关系 (3)9.简述知识经济理论与管理会计的关系 (3)10.简述管理会计假设的内容及意义 (3)11.简述理解管理会计目标及其与企业目标的关系 (3)12.简述管理会计信息质量特征与财务会计质量特征的区别 (4)13.简述管理会计与财务会计、财务管理、审计和内部控制的产生及结合 (4)14.简述管理会计与财务会计的区别 (4)15.简述管理会计与财务会计的耦合逻辑 (4)第二章成本性态分析 (5)1.成本性态分析在管理会计中的地位 (5)2.混合成本的分解方法 (5)3.固定成本与变动成本的特征 (5)4.边际贡献率与变动成本率的关系 (5)第三章本量利分析 (6)1.试说明本量利分析的基本假设 (6)2.什么是本量利分析的基本表达式 (6)3.什么是保本点?影响保本点的因素有哪些? (7)4.什么是保利点?影响保利点的因素有哪些? (7)5.试说明一个经营多种产品的企业如何确定保本点 (7)6.什么是安全边际率、保本点作业率和经营杠杆率? (7)7.怎样进行实现目标利润的敏感性分析? (8)第四章变动成本法 (8)1.变动成本法与全部成本法的主要区别有哪几个方面? (8)2.变动成本法与全部成本法期间损益发生差异有何规律? (8)3.试评述变动成本法的优缺点 (9)4.“只要生产量大于销售量,当期全部成本法的利润必定大于变动成本法的利润”。
这一命题是否成立?为什么? (9)第五章资金管理 (9)1.现金管理业务流程 (9)2.银行账户管理 (9)3.资金计划管理 (9)4.现金池分类与构成要素 (10)5.现金池功能定位与构建原则 (10)6.现金池运作流程 (10)7.资金集中管理模式 (10)8.银企直联系统总体运行流程 (10)9.银企直联系统主要功能 (11)第六章短期经营决策 (11)1.短期经营决策的特点有哪些? (11)2.短期经营决策中的相关成本和无关成本分别有哪些? (11)3.简述短期经营决策的主要方法及各自的优缺点 (11)4.简述在不同情况下半成品是否深加工的决策方法 (12)5.简述在完全竞争市场和非完全竞争市场条件下的定价方法? (12)6.简述短期营运决策敏感性分析的方法及应用 (13)第七章长期投资决策 (13)1.什么是独立项目和互斥项目? (13)2.什么是现金流量?投资项目的现金流量包括哪些内容? (13)3.投资项目的现金流量如何计算? (14)4.现金流量在估计中应注意哪些问题?(可删除) (14)5.投资决策评价的方法有哪些?各自的优缺点是什么? (14)第八章全面预算管理 (16)1.什么是全面预算?你怎样认识它的重要性? (16)2.全面预算有哪些预算构成? (16)3.什么是弹性预算?与固定预算相比有何优越性? (16)4.试分析比较零基预算与增减预算的主要区别? (17)5.什么是滚动预算?有何特点? (17)6.简述预算控制的方法 (17)7.简述预算调整的前提条件 (18)8.现金预算包括哪些项目?各项目之间存在怎样的勾稽关系? (18)9.会计制度设计如何与预算管理衔接? (18)10.财务会计控制如何与预算执行对接? (18)练习题 (18)第九章作业成本管理 (22)1.简述作业成本法的特点 (22)2.如何评价作业的增值性? (22)3.结合企业实际,谈读作业成车法的应用 (23)4.简述作业成本管理中降低成本的途径 (23)5.作业成本法在制造费用分配基础与分配路径上与传统成本法有何有同 (23)第十章目标成本管理 (23)1.简述目标成本法的特点 (23)2.如何应用价值工程技术进行产品设计 (23)3.结合企业实际,谈谈目标成本管理的应用 (24)4.简述目标成本法的实施原则 (25)5.简述确立目标成本的主要活动 (25)6.简述目标成本规划的五个步骤 (26)7.如何将顾客需求纳人目标成本管理? (26)8.简述价值链在目标成本管理中的贡献 (26)9.简述目标成本管理中的供应链管理 (27)10.简述目标成本管理的组织和团队 (27)11.简述目标成本管理的核心工具 (27)第十一章项目成本管理 (28)1.现代项目成本管理的发展 (28)2.项目生命周期成本管理的方法 (28)3.简述工作分解结构的作用 (28)4.以一场婚礼筹划为例,写出工作结构分解图 (28)5.简述项目资源计划的工具与方法 (29)6.简述项目成本估算的技术路线 (29)7.简述项目成本估算的方法 (29)8.简述项目成本估算和项目成本预算的区别与联系 (29)9.简述项目成本预算的调整内容有哪些 (29)10.简述项目成本控制的方法有哪些 (29)11.简述挣值法的三个基本值 (29)12.简述挣值法几个关键指标的内容与作用 (29)13.简述项目成本决算的意义和作用 (30)第十二章战略成本管理 (30)1.简述战略成本管理研究的定义和特征 (30)2.简述生命周期成本管理的内容 (30)3.简述战略成本定位分析方法 (31)4.简述企业一般竞争战略的内容 (31)5.简述战略成本动因分析的内容 (31)6简述供应链管理的主要内容、目的及基本原则 (31)7.简述供应链成本核算框架 (32)8.简述前瞻式成本管理及内容 (32)9.简述精益管理会计及其内容 (33)10.简述跨组织成本管理及其内容 (33)11.简述供应链成本管理的方法 (34)第十三章绩效管理 (34)1.简述战略绩效管理的特点与优势 (34)2.简述分权管理与责任会计 (34)3.简述责任中心的分类及其不同责任中心的绩效评价方法 (35)4.简述内部转移价格及其制定 (36)5.简述关键绩效指标法的含义及其基本流程 (36)6.简述经济增加值的价值管理体系 (36)7.简述平衡计分卡之“平衡” (37)8.简述平衡计分卡的实施程序 (37)9.简述平衡计分卡与企业战略 (38)第十四章管理会计报告 (38)1.简述会计报告体系的构成 (38)2.简述管理会计报告的主要特征 (39)3.简述按不同标志分类的管理会计报告体系 (39)4.简述管理会计报告流程 (39)5.简述基于报告对象的管理会计报告体系 (40)6.简述基于责任中心的管理会计报告体系 (40)7.基于价值链的管理会计报告体系 (41)第十五章管理会计信息化 (41)1.如何理解管理会计信息系统概念 (41)2.管理会计信息系统建设与应用原则、程序的内容 (41)3.如何理解管理会计信息系统架构 (42)4.成本管理信息化的内容包括哪些 (42)5.如何理解成本管理信息系统模式 (43)6.预算管理信息化的内容包括哪些 (44)7.如何理解预算管理信息系统 (44)8.如何理解绩效管理信息化过程 (45)9.如何理解绩效管理信息平台 (45)10.如何理解投资项目管理信息化 (45)11.如何理解投资项目管理信息化系统 (45)12.如何理解管理会计报告信息化 (46)13.如何理解ERP系统的管理会计 (46)第一章管理会计概述1.理解资产高安全度、资产高利润率、现金流充足、资产高增值率和把握新产业(1)资产高安全度是企业全面梳理资产管理流程,及时发现资产管理中的薄弱环节,切实采取有效措施加以改进,并关注资产减值迹象,合理确认资产减值损失,更好地避免下列风险:①存货积压或短缺,可能导致流动资金占用过量、存货价值贬损或生产中断;②固定资产更新改造不够、使用效能低下、维护不当、产能过剩,可能导致企业缺乏竞争力、资产价值贬损、安全事故频发或资源浪费;③无形资产缺乏核心技术、权属不清、技术落后、存在重大技术安全隐患,可能导致企业法律纠纷、缺乏可持续发展能力。
管理会计第4章习题含答案
15000
15%
19500
=2012年收入*销售百分比
应付账款
5000
5%
6500
,等于上年值
公司债券
10000
-
10000
实收资本
20000
-
20000
留存收益
10000
-
17800
=2012年收入*销售净利率*股利分配率
负债与权益合计
70000
20%
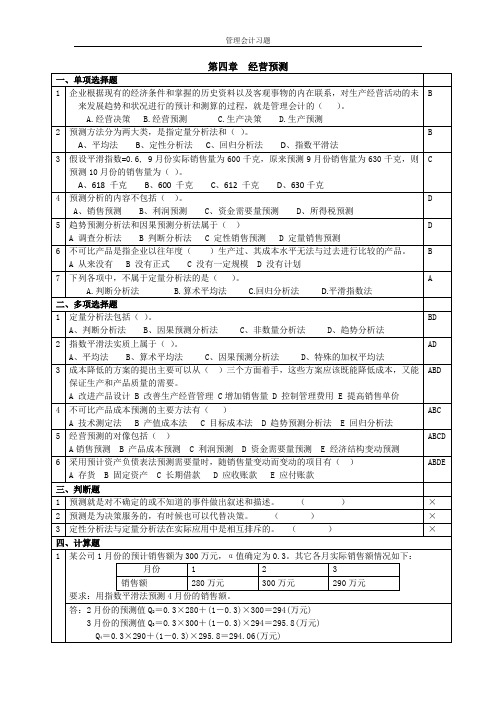
300万元
290万元
要求:用指数平滑法预测4月份的销售额。
答:2月份的预测值Q2=0.3×280+(1-0.3)×300=294(万元)
3月份的预测值Q3=O.3×300+(1-0.3)×294=295.8(万元)
Q4=0.3×290+(1-0.3)×295.8=294.06(万元)
2
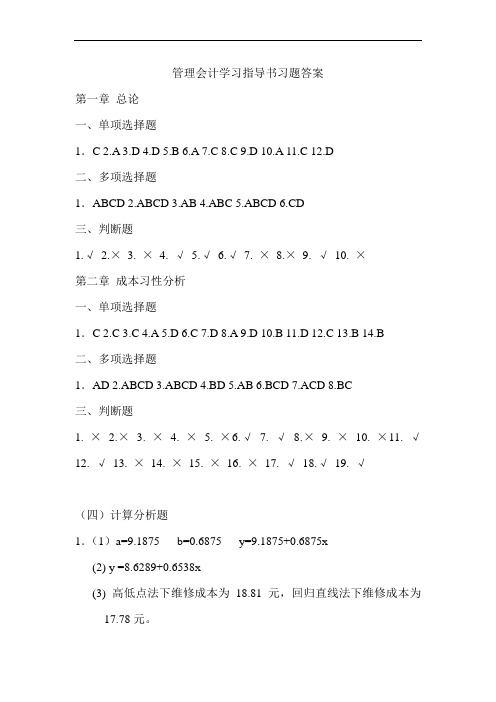
假定甲公司2011年资产负债表如下,2011年销售收入为100000万元,销售净利率为10%,股利支付率为60%,公司现有生产能力尚未饱和,增加销售无须追加固定资产投资。预测2012年该公司销售收入将提高到130000万元,企业销售净率和利润分配政策不变。
要求:预测2012年外部筹资额。
答:
资产
2011年12月31日
销售百分比
2012年12月31日
计算
库存现金
5000
5%
6500
=2012年收入*销售百分比
应收账款
15000
15%
19500
存货
30000
30%
39000
固定资产净值
20000
-
20000
非敏感项目,等于上年值
资产合计
70000
管理会计课后习题学习指导书习题答案第四章

课后练习思考题1.定性销售预测和定量销售预测的优缺点是什么其适用范围又是什么答:(1)定性销售预测又称为定性分析法或非数量分析法,它主要是依靠预测人员丰富的实践经验和知识以及主观的分析判断能力,在考虑政治经济形势、市场变化、经济政策、消费倾向等各项因素对经营影响的前提下,对事物的性质和发展趋势进行预测和推测的分析方法。
定性销售预测方法又分为判断分析法和调查分析法两大类。
定性预测的优点在于注意对当期事物发展变化的把握,在资料不足的情况下可以加快预测速度;缺点是容易受到主观因素的影响,科学依据不足,准确性、可靠性较差。
(2)定量销售预测也称数量分析法。
它主要是应用数学的方法,对与销售有关的各种经济信息进行科学的加工处理,建立相应的数学模型,充分揭示各有关变量之间的规律性联系,并做出相应预测结论。
定量预测基本上分为:趋势预测分析法、因果预测分析法、季节预测分析法和购买力指数法。
定量预测的优点是结果的客观性。
但由于经济生活的复杂性,并非所有影响因素都可以通过定量进行分析,某些因素(例如,政治经济形势的变动、消费倾向、市场前景、宏观环境的变化等)只有定性的特征,定量预测比较机械,难以预测事物性质的发展变化;再者,定量分析也存在其本身的局限性,任何数学方法都不能概括所有的复杂的经济变化情况。
如果不结合预测期间的政治、经济、市场以及政策方面的变化情况,必然会导致预测结果脱离客观实际。
所以,我们必须根据具体情况,把定量分析与定性分析方法结合起来使用,这样才能收到良好的效果。
2.某家具公司采用调查分析法进行销售预测时,应如何去做答:通过对有代表性的顾客的消费意向进行调查,了解市场需求变化趋势,了解到顾客明年的购买量,顾客的财务状况和经营成果,顾客的爱好、习惯和购买力的变化,顾客购买本公司产品占其总需要量的比重和选择供应商的标准,这对销售预测将更有帮助。
3.在不同的产品寿命周期阶段,应如何有效地进行销售预测答:某种产品从投人市场开始直到退出市场为止,一般分为投人期、成长期、成熟期和衰退期四个阶段。
管理会计第五版(英文版)课后题答案第四章

Activity-Based CostSystemsQUESTIONS4-1Conventional cost systems are likely to systematically distort product costs because they break the link between the cause for the costs and the basis for assignment of the cost to the individual products. Two factors that contribute to such cost distortions are: (1) the use of unit-related measures to allocate indirect costs and (2) differences in relative consumption ratios of indirect resources between cost objects. Unit-related measures are used to allocate support costs to products, but the demand for activities might be driven by batch-related and product-sustaining cost drivers. Also, cost distortions tend to be greater with greater differences between relative proportions of indirect resources used by cost objects because traditional cost assignments based on unit-related measures do not accurately reflect these differences.4-2Conventional costing systems allocate batch-related and product-sustaining costs in proportion to a unit-related measure. In a highly automated plant, costs of batch-related and product-sustaining activities are greater. Allocating these costs based on a unit-related measure distorts costs. Activity-based costing systems correct the distortion by employing appropriate cost drivers for different activities to assign costs to products.4-3Yes, conventional costing systems are more likely to overcost high volume products because batch-related and product-sustaining costs are assigned to products in proportion to the number of production units.–97–Atkinson, Solutions Manual t/a Management Accounting, 5E 4-4Activity cost driver is the unit of measurement for the quantity of the activity used to produce individual products or services. Activity cost drivers identifythe linkage between activities and cost objects, such as products, services, andcustomers. An activity cost driver rate is the ratio of the cost of theresources required to provide an activity to the total quantity of the cost driver(that is, the practical capacity quantity made available by those resources).4-5 The major steps to determine activity cost driver rates in a traditional activity-based cost system are:Step 1. Identify the activities performed by the organization (prepare anactivity dictionary).Step 2. Determine the cost of performing each activity.Step 3. Identify a cost driver for each activity.Step 4. Determine the number of units of the cost driver (practicalcapacity) made available by the resources committed to eachactivity.Step 5. Divide each activity cost by the relevant activity cost driver unitsto obtain each activity cost driver rate.4-6Under the framework of a conventional cost system, costs are allocated to products based on unit-related measures such as machine hours and directlabor hours. Distortion caused by the use of unit related measures to allocatecosts is corrected in activity-based costing systems because batch-relatedactivity costs are assigned to jobs on the basis of batch-related cost drivers.4-7No, this statement is not correct. Activity-based costing systems use different cost drivers to better link the activities performed to the productsmanufactured. The reason they provide more accurate product costs is thatthey take into account the demand placed on a hierarchy of activities (forexample, unit-level, batch-level, and product-level) by different products, notbecause they use more cost drivers. A system that uses many cost drivers thatdo not reflect the activity costs (such as a system that relies only on unit-related cost drivers) is also likely to distort product costs.4-8Activity-based costing systems use cost drivers that link the activities performed to the cost objects that use the activities. For example, the costobjects might be products, services, or customers.–98–Chapter 4: Activity-Based Cost Systems4-9Using the number of setups instead of setup hours is appropriate when all products require approximately the same number of setup hours per batch.4-10 Managers use the information on activity costs to identify opportunities for operational improvements and reductions in operations costs, decisions about product mix and pricing, and targeted customer segments. An example of an operational change is requiring minimum order sizes to eliminate short, unprofitable production runs. Another example is changing the facility layout to reduce moves of work in progress. Product designs can be changed in order to manufacture products with fewer parts or common parts to reduce material handling support costs. Finally, if activity-based cost analysis shows that full-pallet shipments are less costly per unit than partial-pallet shipments, customers can be encouraged to receive full-pallet shipments. Of course, customers who insist on very small order sizes or partial-pallet shipments can be charged a price high enough to cover the extra costs associated with such activities.4-11The activity cost driver rate should reflect the underlying efficiency of the process—the cost of resources to handle each production order—and this efficiency is measured better by using the capacity of the resources supplied (practical capacity) as the denominator when calculating activity cost driver rates. The numerator in an activity cost driver rate calculation represents the costs of supplying resource capacity to do work. The denominator should match the numerator by representing the quantity of work the resources can perform. Unassigned costs represent the cost of unused capacity and should be used as feedback to managers on their supply and demand decisions.4-12Immediate financial improvement may not follow even after process improvements reduce the demand for indirect and support resources. This is because the support costs are often committed. The organization must actively manage the unused capacity by increasing the volume of business or reducing the supply of unused resources.4-13The two sets of parameters that must be estimated in time-driven activity-based costing are 1) the unit cost of supplying capacity for each department or process, based on practical capacity, and 2) the consumption of capacity (unit times) for each transactional activity, including time equations as needed.–99–Atkinson, Solutions Manual t/a Management Accounting, 5E 4-14Time-driven activity-based costing has a number of advantages over traditional activity-based costing. The advantages include (1) data for thetime-driven approach are far easier to obtain, validate, and update, (2) thetime-driven model is easier to update when operating conditions changes (forexample, changes in the activities that indirect labor performs), (3) the time-driven model is easier to update when cost driver rates change (due, forexample, to salary increases or efficiency improvements), and (4) the time-driven model easily accommodates differences in time required fortransactions or production orders (using time equations).4-15Conventional product costing systems are designed primarily for external financial reporting that requires tracking of manufacturing costs to allocatebetween cost of goods sold and inventories. Selling and distribution costs arenot included in cost of goods sold or inventories. Their inclusion wouldrequire maintaining a parallel accounting system, which until the advent ofinexpensive data processing, was considered to be not cost effective. Also,selling and distribution costs used to be small relative to other manufacturingcosts and their exclusion did not have a serious impact on managerialdecisions.4-16Customer service and technological innovation have become more important in a firm’s quest for a competitive edge over its rivals. As more resources areused on these and related activities, the proportion of non-manufacturing costshas increased recently. Therefore, it has become more important to assignthese costs to products for managerial purposes.4-17Virtually all the costs for a service company are indirect and appear to be fixed. Manufacturing companies can trace important components of costs,such as direct material and direct labor costs, to individual products. Servicecompanies have few or no direct materials and many of their personnelprovide indirect, not direct, support to products and customers. Consequently,service companies do not have direct, traceable costs to serve as convenientallocation bases.Unlike physical products, services cannot be inventoried for future sales.Service companies must supply virtually all their resources in advance toprovide the capacity to perform work for customers during each period, anddemand often fluctuates. For some service industries, the increase in spendingresulting from an incremental transaction or customer is essentially zero.Therefore, service companies making decisions about products and customersbased on short-term variable costs might provide a full range of all products–100–Chapter 4: Activity-Based Cost Systems and services to customers at prices near zero, leading to little recovery of the costs of all the committed resources supplied in order to deliver services to customers.It can be difficult to identify and measure the outputs for a service organization. The variation in demand for organizational resources is much more customer-driven in service organizations than in manufacturing organizations. A service company can determine and control the efficiency of its internal activities, but customers determine the quantity of demands for these operating activities. For example, customers may vary greatly in the number of transactions and the balances in their checking accounts. Service companies must focus on customer costs and customer profitability;measuring revenues and costs at the customer level provides service companies with far more relevant and useful information than at the product level.Finally, a customer may have multiple relationships with a service company.Therefore, the cost system should provide information that supports determining profitability of the entire relationship with the customer.4-18Individuals may feel vulnerable facing uncertainty about what the activity-based cost analysis may show, or they may feel threatened by the suggestion that their work could be improved. For example, the analysis might reveal that products or customers thought to be very profitable are actually unprofitable, or that some processes are inefficient. Individuals may be concerned that they will then be judged as poor managers, even though they were making decisions that others would agree were good decisions based on the cost system in place.EXERCISES4-19Potter Corporation should switch to activity-based costing because its current system appears to be distorting product costs, resulting in prices of specialty products that are too low (hence increasing their market share) and prices of simple products that are too high (thus, lowering their market share). This, in turn, leads to lower overall profitability as Potter pushes products that, in reality, produce low profit margins or even lose money.In implementing an activity-based costing system (see the response to question 4-5), Potter will need to identify activity cost drivers in its plant such as the number of setups, purchase orders, and quality inspections, and then–101–Atkinson, Solutions Manual t/a Management Accounting, 5E allocate costs to products in the proportion of the amount of activitydemanded by each product.4-20 (a)A variety of solutions may be proposed. The solution below adds the $150,000 quality inspection costs per quarter to the “handle production runs”activity described in the chapter.The revised activity cost of $810,000 is used to derive a new activity costdriver rate for “handle production runs,” and the product costs are revised.–102–Chapter 4: Activity-Based Cost Systems–103–Atkinson, Solutions Manual t/a Management Accounting, 5E –104– (b) Indirect labor costs are now $150,000 + $840,000 = $990,000 and the indirectlabor cost per hour of work is $990,000/20,000 hours = $49.50. The computercost per hour remains $300,000/500 hours = $600. The “Run Machines” activitycost driver rate is taken from the Ericson activity-based cost analysis in thechapter.*D Q = D r i v e rQuantity andACDR = Activity Cost Driver Rate = DQ × $49.50 for indirect labor costs.For computer costs, ACDR = DQ × $600.Cost are assigned to the four flavors as follows:Chapter 4: Activity-Based Cost Systems–105–Atkinson, Solutions Manual t/a Management Accounting, 5E –106–4-21 (a) Indirect labor costs are now 110% × $840,000 = $924,000 and theindirect labor cost per hour of work is $924,000/20,000 hours = $46.20.The computer cost per hour remains $300,000/500 hours = $600. The“Run Machines” activity cost driver rate is taken from the Ericsonactivity-based cost analysis in the chapter.*Duantity andACDR = Activity Cost Driver Rate = DQ × $46.20 for indirect labor costs.For computer costs, ACDR = DQ × $600.Cost are assigned to the four flavors as follows:Based on these costs, the income statement is as follows.CHOCO- STRAW- MOCHA-VANILLA LATE BERRY ALMOND TOTAL Prod. & Sales Volume (000) 500 400 90 10 1000 Unit Selling Price $4.50 $4.50 $4.65 $4.95Sales (000) $ 2,250.00 $ 1,800.00 $ 418.50 $ 49.50 $4,518.00 Material Costs (000) $750.00 $600.00 $140.40 $16.50 $1,506.90 Direct Labor (000) $300.00 $240.00 $54.00 $6.00 $600.00 Contribution Margin $1,200.00 $960.00 $224.10 $27.00 $2,411.10$120.00 $96.00 $21.60 $2.40 $240.00$245.70 $228.15 $175.50 $52.65 $702.00$129.36 $72.07 $115.50 $52.67 $369.60$38.10 $38.10 $38.10 $38.10 $152.40$210.00 $168.00 $37.80 $4.20 $420.00 Total OH $743.16 $602.32 $388.50 $150.02 $1,884.00 Gross Margin (000) $456.84 $357.68 (164.40)(123.02)$527.10 Gross Margin (%) 20.30% 19.87% -39.28% -248.52% 11.67% MSDA Expenses (000) 900.00 Operating Profit/(Loss) (000) ($372.90)The new loss differs from the previous loss by $84,000, which is the increase inindirect labor costs.(b) As in part (a), indirect labor cost per hour of work is $924,000/20,000 hours =$46.20 and the computer cost per hour is $300,000/500 hours = $600.*DQ = Driver Quantity andACDR = Activity Cost Driver Rate = DQ × $46.20 for indirect labor costs.For computer costs, ACDR = DQ × $600.Costs are assigned to the four flavors as follows:The total activity-based cost assigned in part (b) is $1,551,600, as compared to $1,644,000 assigned in part (a). The difference is due to 2,000 fewer indirect labor hours used in part (b), and this accounts for the $92,400 difference (2,000 hours $46.20 per hour), which is the cost associated with unused indirect labor capacity. The cost of the unused capacity appears in the following income statement, which shows the same loss as in part (a). Showing the cost of unused capacity as a separate line item provides feedback to management about resource capacity that could be put to productive use, or in some cases, eliminated.CHOCO- STRAW- MOCHA-VANILLA LATE BERRY ALMOND TOTAL Prod. & Sales Volume (000) 500 400 90 10 1000Unit Selling Price $4.50 $4.50 $4.65 $4.95Sales (000) $ 2,250.00 $ 1,800.00 $ 418.50 $ 49.50 $4,518.00 Material Costs (000) $750.00 $600.00 $140.40 $16.50 $1,506.90 Direct Labor (000) $300.00 $240.00 $54.00 $6.00 $600.00 Contribution Margin $1,200.00 $960.00 $224.10 $27.00 $2,411.10$120.00 $96.00 $21.60 $2.40 $240.00$213.36 $198.12 $152.40 $45.72 $609.60$129.36 $72.07 $115.50 $52.67 $369.60$38.10 $38.10 $38.10 $38.10 $152.40$210.00 $168.00 $37.80 $4.20 $420.00 Total OH $710.82 $572.29 $365.40 $143.09 $1,791.60 Gross Margin (000) withoutunused cap cost $489.18 $387.71 (141.30)(116.09)$619.50 Gross Margin (%) 21.74% 21.54% -33.76% -234.52% 13.71% Unused capacity cost:2,000 IL hrs x $46.20 $92.40.40 Gross Margin (000) afterdeduct unused capacity cost $527.10.10 MSDA Expenses (000) 900.00 Operating Profit/(Loss) (000) ($372.90)4-22(a)Activity EstimatedCostsActivity CostDriversMonthlyPlannedCost DriverQuantityActivityRateProcessdeposits $29,630 No. of depositsprocessed 33,250 $0.89Processwithdrawals 26,080 No. of withdrawalsprocessed 22,750 1.15Answerinquiries 24,860 No. ofinquiries 45,000 0.55Sell negotiableinstruments 4,860 No. ofinstruments sold 1,100 4.42Balancedrawers 4,290 No. of drawersbalanced 1,300 3.30$89,720(b)ActivityAverageMonthly RateActivity CostDriver RateTotal SupportCostsProcess deposits 2.3 $0.89 $2.05 Process withdrawals 6.0 1.15 6.90 Answer customerinquiries 2.1 0.55 1.16 Sell negotiableinstruments 0.5 4.42 2.21$12.324-23Costpool ActivityCostsCostDriversCost DriverRateMachine setups $360,000 6,000 setup hours $60 per setup hour Material handling 100,000 50,000 pounds of materials $2 per poundElectric power 40,000 80,000 kilowatt hours $0.5 per kilowatt hourV203 G179 Direct materialcost $25,000.00 $33,000.00 Direct labor cost 14,000.00 16,000.00 Support costs:Machine setups $60 ⨯ 120 = 7,200.00 $60 ⨯ 150 = $9,000.00 Materials handling $2 ⨯ 5,000 = 10,000.00 $2 ⨯ 10,000 = 20,000.00 Electric power $0.5 ⨯ 2,000 = 1,000.00 $0.5 ⨯ 3,000 = 1,500.00 Total manufacturing costs $57,200.00 $79,500.00 Number of units produced 5,000.00 15,000.00 Unit cost $11.44 $5.304-24(a) Based on number of setups:Week 1 Week 2 Week 3 Direct labor costs $5,520.00 * $5,520.00 $5,520.00Other costs $4,000.00 ** $4,000.00 $4,000.00Total setup costs $9,520.00 $9,520.00 $9,520.00Number of setups 160 160 160Cost driver rate $59.50 $59.50 $59.50* $10 per hour ⨯ 10 workers ⨯ 40 hours ⨯ 1.38** $25 ⨯ 160 setupsBased on number of setup hours:Week 1 Week 2 Week 3 Direct labor costs $5,520.00 $5,520.00 $5,520.00Other costs $4,000.00 $4,000.00 $4,000.00Total setup costs $9,520.00 $9,520.00 $9,520.00Number of setup hours 395* 390** 400***Cost driver rate $24.10 $24.41 $23.80* (2⨯85) + (3⨯75) = 395** (2⨯90) + (3⨯70) = 390*** (2⨯80) + (3⨯80) = 400(b) If only one cost driver can be used, then it may be preferable to base thecost driver rate on the number of setup hours because the setup time isdifferent for these two products. However, both cost drivers arerequired in this case because some costs ($25 per setup) depend on thenumber of setups and some ($13.80 per setup hour) depend on setuphours.4-25(a) Number of machine hours (h) Number of square feet(b) Number of setup hours (i) Direct labor hours(c) Number of machine hours (j) Number of workersor number of kilowatt hours (k) Number of square feet(d) Number of inspections (l) Number of workers(e) Number of orders (m) Number of inquiries(f)Number of production runs (n) Number of orders processed(g)Number of square feet (o) Number of customers managed4-26 (a) Ken’s previous average capacity-related cost per meal was $3,300 ÷600 = $5.50. With the drop in demand, the average capacity-related cost is now$3,300 ÷ 550 = $6. If demand decreases further and Ken continues touse the same method to determine his costs of serving a meal, theaverage committed cost will continue to increase, and Ken will want toraise his prices even more. However, the rising prices may contribute tofurther declines in demand, leading Ken into a downward spiral.(b) Ken should use the practical capacity quantity of meals per day todetermine cost per meal in order to avoid the fluctuations described inpart (a) and to understand the cost driver rates at the point where theresources used equal the practical capacity usage. If resource usage isless than practical capacity, Ken should monitor the cost of unusedcapacity. He may be able to reduce the capacity costs or to find otherprofitable uses for the capacity. In this problem, one may assume thepractical capacity is 600 meals per day.4-27 (a) Ashton Brown Sales $430,000 $350,000Cost of goods sold $220,000 $155,000Gross margin $210,000 $195,000Marketing, distribution, and sellingexpenses @ 33% of sales $141,900 $115,500Operating profit $68,100 $79,500Operating profit/Sales 15.84% 22.71%-(b) Sales $430,000 $350,000Cost of goods sold $220,000 $155,000Gross margin $210,000 $195,000Marketing, distribution, and sellingexpensesSales representative travel $9,000 $42,000Service customers 15,000 110,000Handle customer orders 1,000 12,000Ship to customers 24,000 72,000Total activity expenses $49,000 $236,000Operating profit $161,000 –$41,000Operating profit/Sales 37.44% –11.71%(c) The activity-based costing method provides more accurate assignmentsof marketing, distribution, and selling expenses by identifyingactivities consumed by each customer and assigning costs to customersbased on their activity usage. In this example, Brown places smallerorders, orders more frequently, and requires more after-sales support(travel and service support) than Ashton does.4-28This question is designed to generate discussion on what constitutes a desirable customer. Although a credit customer who charges a large dollar volume and pays the balance in full on time each month is probably a good credit risk, the customer is not the most profitable to the credit card issuer. (However, some credit card issuers may generate indirect additional revenue from such customers by working with advertisers to selectively add advertising inserts to these customers.) All credit card purchases generate merchant fees; the credit card issuer hopes to generate additional income through interest payments and late fees.Type 6 is the least desirable type of customer because that type generates no revenue but causes the issuer to incur costs to send statements. Type 1 is preferable to Type 6, but less preferable than all the remaining types because of the short-term, low-interest arrangement. Type 3 is preferable to type 4 because of the late fees, and type 4 is preferred to type 5 because of the higher balances on which interest is paid. Type 2 is probably less preferred than types 3 and 4, and possibly type 5. The suggested complete ordering will depend on the relative dollar magnitudes assumed. A reasonable ordering, from most preferred to least preferred, is 3, 4, 2, 5, 1, 6.4-29The company faced a number of implementation barriers as it contemplated implementing activity-based costing,. Some managers either did not understand a clear business purpose (though they understood the increased accuracy of activity-based costing) or they feared the ramifications of the new cost information. Possible negative repercussions included decreasing executive compensation, eliminating the new product line, or even closing the entire Midwest plant. Consequently, there was overt resistance to implementing activity-based costing.Managers can be reassured that the new product line will be given sufficient time to prove itself. Activity-based costing can be presented as a management tool that can provide useful information as the company redesigns or improves processes, evaluates product design decisions, or seeks to better manage customer relationships. That is, there are many avenues to improving performance at the Midwest plant and ultimately, at the company. The managers can participate in choosing the specific business purpose for activity-based costing, and should be informed that the cost system will be designed to support the primary purpose of the model. For example, the cost system may be designed differently if its primary purpose is to support process improvement rather than to support strategic decision making (forexample, pricing, product mix, or customer relationships). The cost system will be only as complex as it needs to be for the chosen business purposes.PROBLEMS4-30 (a) Manufacturing support cost driver rate= + = $ , , , , $ . 1 1 5 0 0 0 0 0 1 0 0 0 0 0 3 0 0 0 0 028 7 5 p e r d i r e c t l a b o r h o u r .Costs Per UnitProduct X21 Product Y37Direct materials cost$120.00$140.00Direct labor cost2 ⨯ $(1,000,000÷100,000) 20.003 ⨯ $(4,500,000÷300,000)45.00Manufacturing support cost $28.75 ⨯ (100,000÷50,000) 57.50$28.75 ⨯ (300,000÷100,000)86.25Unit cost $197.50$271.25(b)Cost Cost Costs Allocated to Products Activity Activity Costs Driver Quantity Driver Rate X21Y37Handling $3,000,000 60,000 50 50 ⨯ 40,000 50 ⨯ 20,000Number of parts2,400,000 20,000120 120 ⨯ 12,000120 ⨯ 8,000Design changes3,300,0003,000 1,100 1,100 ⨯ 2,000 1,100 ⨯ 1,000Setups2,800,000 14,000200200 ⨯ 8,000200 ⨯ 6,000Total$11,500,000$7,240,000 $4,260,000Costs Per Unit X21 Y37Direct materials cost $120.00 $140.00Direct labor cost 20.00 45.00Manufacturing support cost$7,240,000 ÷ 50,000 144.80$4,260,000 ÷ 100,000 42.60Unit cost $284.80 $227.60(c) Activity-based costing produces more accurate estimates of job costsbecause it takes into account the cost drivers that give rise to supportcosts.(d) Cost-based Prices Product X21 Product Y37Traditional costing1.25 × unit costs in part (a) $246.88 $339.06Activity-based costing1.25 × unit costs in part (b) $356.00 $284.50If Endo plans to continue to use cost-based pricing, it should useactivity-based costs as the basis for its markups. Note X21’s currentprice is not even covering its manufacturing costs as determined usingactivity-based costing. Conversely, Y37 may be overpriced. Endoshould consider raising X21’s price and could consider lowering Y37’sprice if competitors are selling the same product for a lower price.(e)The company sells half as many X21’s as Y37’s, but X21 has twice asmany design changes and 50% more parts. These facts suggest that thecompany can explore ways to reduce the number of design changes andthe number of parts. Management accountants would be involved indeveloping and communicating the cost of design changes and partsproliferation; design engineers would be directly involved in studyingdifferent designs and trying to reduce the number of parts. In addition,sales staff who communicate with customers could make greater effortsto understand customer needs and convey this information to the designengineers.4-31 (a) Managers need accurate product cost data in a broad range of decision-making situations. Without accurate cost data, managers would find itvery difficult to set selling prices for products and services. Knowledgeof product costs is also vital in a number of special decision areas, suchas whether to add or drop product lines, whether to make or buyproduct components, whether to expand or contract operations, andwhether to accept special orders at special prices.(b) Inspection hours for the School model:(90,000 units ÷ 1,000 units per batch) × 1 hour per batch = 90,000.Inspection hours for the Hiker model:(6,000 units ÷ 100 units per batch) × 2 hours per batch = 120.CostActivity School Hiker Total Driver Activity Costs Activity Driver Model Model Activity Rate* CuttingMachines $52,000 Machine hours 9,000 1,125 10,125 $5.14 SewingMachines 163,300 Direct labor hours 45,000 4,500 49,500 3.30 Packaging—order-related 8,300 Number of orders 450 200 650 12.77Packaging—volume-related 150,000Number of itemspacked 90,000 6,000 96,000 1.57Orders 14,000 Number of orders 450 200 650 21.54 Inspections 8,400 Hours of inspections 90 120 210 40.00 Total $396,000*Cost driver rates reflect using Excel’s roundup to two decimals function.。
西财《管理会计》教学资料包 课后习题答案 第四章

第四章盈亏平衡分析答案1.什么是盈亏平衡分析?它有哪些用途?答:盈亏平衡分析是指以成本性态分析为基础,以盈利额或亏损额为零作为基点,揭示产品或劳务的销售量、成本和利润三者之间内在联系的一种经济分析方法。
借助这种分析,可以明确某种产品或劳务的销售量、成本和利润之间的特定数量关系,确认有关因素发生变动后对企业盈亏带来的影响,进而为利润预测、利润规划和利润决策等提供重要依据。
盈亏平衡分析可以与企业的经营风险分析相联系,依此分析企业经营的安全程度,促使企业努力降低经营风险,提高经营效益。
盈亏平衡分析所揭示的本量利之间的依存关系,可以为企业进行生产决策、定价决策、存货决策等提供依据。
企业还可以将其应用于弹性预算、成本控制、业绩评价等方面。
2.盈亏平衡分析有哪些假定条件?答:(1)成本性态分析假定(2)线性关系假定(3)固定成本不变假定(4)产销平衡假定(5)品种结构稳定假定3.什么是盈亏平衡点?它有几种表现形式?答:盈亏平衡点又称保本点、盈亏临界点,是指企业的总成本同总收入相等的销售量或销售额。
盈亏平衡点通常有两种表现形式:一种是用实物量表示,称为盈亏平衡销售量;另一种是用货币金额表示,称为盈亏平衡销售额。
4.与盈亏平衡分析相关的指标计算与意义?答:(1)安全边际。
它是衡量有关产品的经营活动处于何种安全程度或面临多大经营风险的重要标志之一。
(2)保本作业率。
该指标从侧面反映了企业经营安全程度的高低,该指标越低,说明用来弥补固定成本的销售量越少,可以提供边际贡献的销售量越多,企业的利润越大。
5.什么是利润敏感系数?如何计算?答:利润敏感性系数是指相关因素变动对利润变动的影响,具体为:利润变动百分比/相关因素变动百分比案例分析解:(1)盈亏平衡销售量=150 000/(100-20-20)=2 500件安全边际=10 000-2500=7 500件销售利润率=7 500/10 000×60/100=45%(2)固定成本=50 000×3+80 000+150 000=380 000元盈亏平衡销售量=380 000/(100-20-5)=5 067件(3)设满足条件的销售量为X,则(100-20-30)X-150 000=450 000解得X=12 000可知完成既定利润率需销售12 000件。
管理会计学习指导书习题答案
管理会计学习指导书习题答案第一章总论一、单项选择题1.C 2.A 3.D 4.D 5.B 6.A 7.C 8.C 9.D 10.A 11.C 12.D二、多项选择题1.ABCD 2.ABCD 3.AB 4.ABC 5.ABCD 6.CD三、判断题1.√2.×3. ×4. √5.√6.√7. ×8.×9. √10. ×第二章成本习性分析一、单项选择题1.C 2.C 3.C 4.A 5.D 6.C 7.D 8.A 9.D 10.B 11.D 12.C 13.B 14.B二、多项选择题1.AD 2.ABCD 3.ABCD 4.BD 5.AB 6.BCD 7.ACD 8.BC三、判断题1. ×2.×3. ×4. ×5. ×6.√7. √8.×9. ×10. ×11. √12. √13. ×14. ×15. ×16. ×17. √18.√19. √(四)计算分析题1.(1)a=9.1875 b=0.6875 y=9.1875+0.6875x(2) y =8.6289+0.6538x(3) 高低点法下维修成本为18.81元,回归直线法下维修成本为17.78元。
2.(1)小吴的意见正确,因为计算的相关系数为0.9966,表明成本与业务量之间高度相关,而小刘计算的相关系数为0,表明不相关。
(2)y=103.33+4.375x(3) 7月份总成本为212.705万元。
3.(1)y=60000+2x(2)元4.(1)b=(6 ×6920-48×830)/(6×448-48×48)= 4.375a= (830 -4.375×48)/6= 103.33 y=103.33+4.375 x(2)y=103.33+4.375×18=182.085.(1)根据2月份制造费用总额组成情况可确定各月固定成本为60000元,单位变动成本为1元/件,从而可确定1至6月份混合成本分别为32500元、35000元、40000元、41250元、40000元、35000元。
管理会计第二版第四章课后答案

管理会计第二版第四章课后答案1、.(年嘉兴一模考)关于会计的核算职能的说法,下列不正确的是()[单选题] *A会计的核算职能不仅仅是对经济活动进行事后反映,还要对经济活动进行事前和事中核算B事中核算的主要形式是对经济活动进行控制,使过程按计划或预期的目标进行C核算的核心是要干预经济活动(正确答案)D会计核算贯穿于经济活动的全过程2、企业在转销已经确认无法支付的应付账款时,应贷记的会计科目是()。
[单选题] *A.其他业务收入B.营业外收入(正确答案)C.盈余公积D.资本公积3、企业购入的生产设备达到预定可使用状态前,其发生的专业人员服务费用计入()科目。
[单选题] *A.“固定资产”B.“制造费用”C.“在建工程”(正确答案)D.“工程物资”4、长期借款利息及外币折算差额,均应记入()科目。
[单选题] *A.其他业务支出B.长期借款(正确答案)C.投资收益D.其他应付款5、企业用盈余公积转增资本时,转增后留存的盈余公积的数额不得少于转增前注册资本()。
[单选题] *A.20%B.15%C.25%(正确答案)D.50%6、.(年宁波二模考)下列关于会计主体的说法中,不正确的是()[单选题] *A会计主体可以是独立法人,也可以是非法人B会计主体一定是法律主体(正确答案)C会计主体可以是一个企业,也可以是企业中的一个特定组成部分D会计主体有可能是单一企业,也可能是几个企业组成的企业集团7、下列固定资产当月应计提折旧的有()。
[单选题] *A.以经营租赁方式租出的汽车(正确答案)B.当月购入并投入使用的机器C.已提足折旧的厂房D.单独计价入账的土地8、某企业本期的营业收入100万元,营业成本50万元,管理费用10万元,投资收益20万元,所得税费用18万元。
假定不考虑其他因素,该企业本期营业利润为()万元。
[单选题] *A.40B.42C.60(正确答案)D.729、.(年浙江省第二次联考)会计人员的职业道德规范不包括()[单选题] *A操守为重、不做假账(正确答案)B爱岗敬业、诚实守信C、廉洁自律、客观公正D坚持准则、提高技能10、下列项目中,不属于职工薪酬的是()。
《管理会计》第四章习题及标准答案

《管理会计》第四章习题及标准答案《管理会计》第四章习题及答案————————————————————————————————作者:————————————————————————————————日期:《管理会计》第四章习题及答案复习思考题:一、名词解释:1、贡献边际是指产品的销售收入与相应的变动成本之间的差额。
2、贡献边际率是指贡献边际占销售收入的百分比。
3、变动成本率是指变动成本占销售收入的百分比。
4、保本分析是研究当企业正好处于保本状态时本量利关系的一种定量分析方法。
5、保本点是指能使企业达到保本状态时的业务量的总称。
6、安全边际是根据实际或预计的销售业务量与保本业务量的差量确定的定量指标。
7、保本作业率保本作业率又叫危险率,是指保本点业务量占实际或预计销售业务量的百分比。
8、保利点是指在单价和成本水平确定的情况下,为确保预先确定的目标利润能够实现而达到的销售量和销售额的总称。
9、保净利点是指实现目标净利润的业务量,具体包括实现目标净利润销售量和实现目标净利润销售额。
二、单项选择题:1、生产单一品种产品企业,保本销售额=()A.保本销售量×单位利润B.固定成本总额÷贡献边际率C.固定成本总额÷(单价一单位变动成本)D.固定成本总额÷综合贡献边际率E.固定成本总额÷贡献边际2、生产多品种产品企业测算综合保本销售额=固定成本总额÷()A.单位贡献边际B.贡献边际率C.单价一单位变动成本D.综合贡献边际率3、从保本图上得知,对单一产品分析,()A.单位变动成本越大,总成本斜线率越大,保本点越高B.单位变动成本越大,总成本斜线率越小,保本点越高C.单位变动成本越小,总成本斜线率越小,保本点越高D.单位变动成本越小,总成本斜线率越大,保本点越低4、利润=(实际销售量一保本销售量)×()A.贡献边际率B.单位利润C.单位售价D.单位贡献边际5、某企业只生产一种产品,单价6元,单位变动生产成本4元,单位销售和管理变动成本0.5元,销量为500件,则其产品贡献边际为()元A.650B.750C.850D.9506、下属因素中导致保本销售量上升的是()A.销售量上升B.产品单价下降C.固定成本下降D.产品单位变动成本下降7、已知产品销售单价为24元,保本销售量为150件,销售额可达4800元,则安全边际率为()A.33.33%B.25%C.50%D.20%8、在变动成本法下,其利润表所提供的中间指标是()A.贡献边际B.营业利润C.营业毛利D.期间成本9、在下列指标中,可据以判断企业经营安全程度的指标是()A.保本量B.贡献边际C.保本作业率D.保本额10、如果产品的单价与单位变动成本上升的百分率相同,其他因素不变,则保本销售量()A.上升B.下降C.不变D.不确定11、在本量利分析中,必须假定产品成本的计算基础是()A.完全成本法B.变动成本法C.吸收成本法D.制造成本法12、保本作业率与安全边际率之间的关系是()A.两者相等B.前者一般大于后者C.后者一般大于前者D.两者之和等于113、销售量不变,保本点越高,则能实现的利润()A.越小B.不变C.越大D.不一定14、某企业只生产一种产品,月计划销售600件,单位变动成本6元,月固定成本1000元,欲实现利润1640元,则单价应为()A.16.40B.14.60C.10.60D.10.4015、销售收入为20万元,贡献边际率为60%,其变动成本总额为()万元。
- 1、下载文档前请自行甄别文档内容的完整性,平台不提供额外的编辑、内容补充、找答案等附加服务。
- 2、"仅部分预览"的文档,不可在线预览部分如存在完整性等问题,可反馈申请退款(可完整预览的文档不适用该条件!)。
- 3、如文档侵犯您的权益,请联系客服反馈,我们会尽快为您处理(人工客服工作时间:9:00-18:30)。
课后练习思考题1.定性销售预测和定量销售预测的优缺点是什么?其适用范围又是什么?答:(1)定性销售预测又称为定性分析法或非数量分析法,它主要是依靠预测人员丰富的实践经验和知识以及主观的分析判断能力,在考虑政治经济形势、市场变化、经济政策、消费倾向等各项因素对经营影响的前提下,对事物的性质和发展趋势进行预测和推测的分析方法。
定性销售预测方法又分为判断分析法和调查分析法两大类。
定性预测的优点在于注意对当期事物发展变化的把握,在资料不足的情况下可以加快预测速度;缺点是容易受到主观因素的影响,科学依据不足,准确性、可靠性较差。
(2)定量销售预测也称数量分析法。
它主要是应用数学的方法,对与销售有关的各种经济信息进行科学的加工处理,建立相应的数学模型,充分揭示各有关变量之间的规律性联系,并做出相应预测结论。
定量预测基本上分为:趋势预测分析法、因果预测分析法、季节预测分析法和购买力指数法。
定量预测的优点是结果的客观性。
但由于经济生活的复杂性,并非所有影响因素都可以通过定量进行分析,某些因素(例如,政治经济形势的变动、消费倾向、市场前景、宏观环境的变化等)只有定性的特征,定量预测比较机械,难以预测事物性质的发展变化;再者,定量分析也存在其本身的局限性,任何数学方法都不能概括所有的复杂的经济变化情况。
如果不结合预测期间的政治、经济、市场以及政策方面的变化情况,必然会导致预测结果脱离客观实际。
所以,我们必须根据具体情况,把定量分析与定性分析方法结合起来使用,这样才能收到良好的效果。
2.某家具公司采用调查分析法进行销售预测时,应如何去做?答:通过对有代表性的顾客的消费意向进行调查,了解市场需求变化趋势,了解到顾客明年的购买量,顾客的财务状况和经营成果,顾客的爱好、习惯和购买力的变化,顾客购买本公司产品占其总需要量的比重和选择供应商的标准,这对销售预测将更有帮助。
3.在不同的产品寿命周期阶段,应如何有效地进行销售预测?答:某种产品从投人市场开始直到退出市场为止,一般分为投人期、成长期、成熟期和衰退期四个阶段。
产品寿命周期不同阶段的基本区别在于各阶段销售增长率的变化不同。
在投入期,销售量增长缓慢,销售增长率较小;在成长期,销售量急剧上升,销售增长率较大;在成熟期,销售量增长趋缓,销售增长率较小;而在衰退期,销售量开始减少,销售增长率出现负数。
一般而言,0<销售增长率<0.1时,为投入期或成熟期;当销售增长率≥0.1时,为成长期;当销售增长率<0时,为衰退期。
因此,在不同的产品寿命周期阶段进行销售预测时,可以根据经验数据确定销售增长率进行销售预测,也可以采用加权平均法或指数平滑法进行趋势预测。
应用时,必须根据各阶段的特征灵活确定。
4.试述成本预测的基本步骤。
答:1)确定初选目标成本2)成本初步预测3)提出各种成本降低方案4)正式确定目标成本5.不可比产品成本预测有哪些特点?应注意哪些问题?答:不可比产品是指企业以往年度没有正式生产过的产品,其成本水平无法与过去进行比较,因而不能像可比产品那样通过采用下达成本降低指标的方法控制成本支出。
预测时主要采用的三种方法及其特点如下: (1)技术测定法是指在充分挖掘生产潜力的基础上,根据产品设计结构、生产技术条件和工艺方法,对影响人力、物力消耗的各项因素进行技术测试和分析计算,从而确定产品成本的一种方法。
该方法比较科学,但工作量较大,对品种少、技术资料比较齐全的产品可以采用。
(2)产值成本法是指按工业总产值的一定比例确定产品成本的一种方法。
产品的生产过程同时也是生产的耗费过程,在这一过程中,产品成本体现生产过程中的资金耗费,而产值则以货币形式反映生产过程中的成果。
该方法不太准确,但工作量小,比较简便、易行。
(3)目标成本法是指根据产品的价格构成来制定产品目标成本的一种方法。
采用该方法的关键在于同类市场调查、确定一个合适的销售价格和目标利润。
该方法比较简单易懂,但如果市场调查有偏差,那么预测值将会受到很大影响。
6.利用预计资产负债表法进行资金需要总量预测的理论依据是什么?答: 预计资产负债表法是通过编制预计资产负债表来预计预测期的资产、负债和留用利润,从而测算外部资金需要量的一种方法。
资产负债表是反映企业某一时点资金占用(资产)和资金来源(负债和所有者权益之和)平衡状况的会计报表。
企业增加的资产,必然是通过增加负债或所有者权益的途径予以解决的。
因此,通过预计资产的增减,可以确定需要从外部筹措的资金数额。
由于资产、负债的许多项目随销售收入的增加而增加,随其减少而减少,呈现一定的比例关系,因此,可以利用基年资产、负债各项目与销售收人的比例关系,预计预测期的资产、负债各项目的数额。
7.固定资金需要量预测需要注意哪些问题?答: 固定资金需要量预测是对未来一定时期内企业进行生产经营活动所需固定资金进行预计和测算。
要预测固定资金需要量,首先要预测固定资产的需要量。
固定资产需要量的预测,就是根据企业的生产经营方向、生产经营任务和现有的生产能力,预计和测算企业为完成生产经营任务所需要的固定资产数量。
固定资产需要量的预测既要保证生产经营的正常需要,又要尽可能地节约资金、减少占用;既要考虑企业现有的技术条件,充分利用、挖掘现有的生产经营能力,又要尽可能地采用先进的科学技术成果,不断提高企业生产经营技术的现代化水平。
由于企业的固定资产种类繁多,生产经营活动对各类固定资产需要的具体情况非常复杂,所从事的行业不同,其差别也很大。
预测时不可能逐一详细计算,而必须有重点地进行。
在工业企业全部固定资产中,生产设备是企业进行生产经营活动的主要物质技术基础,是决定生产经营的基本因素。
它品种繁多、构成复杂、数量很大、占用资金最多,因此固定资产需要量的预测应以生产设备为重点。
在正确预测生产设备需要量的基础上,其他各类固定资产可以根据生产设备配套的需要量合理地进行测算。
案例题请对本案例进行分析,并讨论:1.对该酒店2013年客房住宿收入进行预测,确定能否完成全年1300万元的收入目标。
答:即使该酒店达到呼和浩特市该地段同类酒店客房的入住率及房价,该酒店仍无法完成全年1300万元的收入目标。
2.为确保2013年1300万元客房住宿收入目标的实现,应采取哪些措施?答:(1)充分利用资源。
将棋牌室减少,增加客房数量。
(2)提高服务质量,提高顾客回头率。
(3)实行浮动房价,旺季涨价,淡季降价,从而实现淡季也有一定的入住率。
名词解释1.经营预测:是指根据历史资料和现在的信息,运用一定的科学预测方法,对未来经济活动可能产生的经济效益和发展趋势做出科学的预测和推测的过程。
2.定性销售预测:又称为定性分析法或非数量分析法,它主要是依靠预测人员丰富的时间经验和知识以及主观的分析判断能力,再考虑政治经济形势、市场变化、经济政策、消费倾向等各项因素对经营影响的前提下,对事物的性质和发展趋势进行预测和推测的分析方法。
3.调查分析法:是指通过对有代表性顾客的消费意向的调查,了解市场需求的变化趋势,进行销售预测的一种方法。
4.趋势预测分析法:是指根据企业历史的、按发生时间的先后顺序排列的一系列销售数据,应用一定的数学方法进行加工处理,按时间数列找出销售随时间而发展变化的趋势,由此推断其未来发展趋势的分析方法。
5.购买力指数:是指各地区市场上某类商品的购买力占整个市场购买力的百分比。
6.因果预测分析法:影响产品的销售的因素是多方面的,既有企业外部因素,也有企业内部因素;既有客观因素,又有主观因素。
在这些因素中,有些因素对产品销售起着决定性作用与产品销售存在某种函数关系,只要找到与产品销售相关的因素以及它们之间的函数关系,就可以利用这种函数关系进行产品的销售预测,这种销售预测方法就是因果预测方法。
7.可比产品成本:可比产品是指以往年度正常生产过的产品,其过去的成本资料比较健全和稳定,可用于比较、分析。
可比产品成本则是指可比产品的总成本和单位成本。
8.预计资产负债表法:是通过编制预计资产负债表来预计预测期的资产、负债和留用利润,从而测算外部资金需要量的一种方法。
9.周转期预测法:又称定额日数计算法,它是根据流动资金完成一次循环所需要的日数和每日平均周转额来计算流动资金需要量的基本方法。
10.资金占用比例法:是指企业根据预测期确定的相关指标,按基年流动资金实际平均占用额与相关指标的比例关系来预测流动资金需要总量的一种方法。
二、判断题(正确的划√,错误的划×)1.运用加权平均法进行销售预测的关键是按照各个观察值与预测值不同的相关程度分别规定适当的权数。
(√)2.购买力指数法是指企业按照各地区购买力指数,将其销售潜量总额分配到各地区市场的一种方法。
(√)3.定量销售预测比定性销售预测更为精确。
(×)4.当各历史期的销售量呈现增减趋势,运用加权平均法时,有必要将近期的观察值的权数规定得小一些。
(×)5.生产设备能力余缺可以通过计算设备负荷系数来确定。
(√)6.指数平滑法下,指数平滑系数的取值越大,近期实际销售量对预测结果的影响就越小。
(×)7.产品功能与成本的比值主要收决于成本和功能的结合情况。
(√)8.劳动生产率的变动,与单位产品中工资费用的变动呈反比关系,而平均工资的增长,与单位产品中工资费用的增长呈正比关系。
(√)9. 目标成本法是指根据产品的成本构成来制定产品目标成本的一种方法。
(×)10.如果指数平滑系数的取值越大,则近期实际销售量对预测结果的影响也越大;如果取值越小,则近期实际销售量对预测结果的影响也越小。
(√)11.当各历史期的销售量呈现增减趋势时,为了体现这种增减趋势,有必要将近期的观察值的权数规定得大一些,远期的观察值的权数规定得小一些,使预测值更为接近近期的观察值。
(√)12.产品成本与产品产值之间客观存在一定的比例关系,比例越大说明消耗越小,成本越低;比例越小说明消耗越大,成本越高。
(×)13.采用技术测定法对不可比产品成本进行预测,工作量较大,所以只对品种少、技术资料比较齐全的产品比较适用。
(√)14. 产品功能与成本的比值,表明每一元成本开支所获得产品功能的大小,它与产品功能呈反比,与产品成本呈正比。
(×)15.产品品种结构变化对利润的影响是由于各个不同品种的产品利润率是不同的,而预测下期利润时,是以本期各种产品的平均利润率为依据的。
(√)16.凡是顾客数量有限,调查费用不高,每位顾客意向明确又不会轻易改变的,均可以采用调查分析法进行预测。
(×)17.按照各个观察值与预测值不同的相关程度分别规定适当的权数,是运用加权平均法进行销售预测的关键。
(×)18.在受季节变动影响的情况下,手节加量或季节指数须按一定的周期取值。