智能微尘-SmartDust
集成化智能传感器课件1

•热电偶冷端温度补偿 •测量温差 •测量平均温度 •测量温度场 •液晶显示器表面温度监测
基于I2C总线的MAX6626型智能温度传感器
MAX6626将温度传感器、12位A/D转换器、可编程温 度越限报警器和I2C总线串行接口集成在同一个芯片中, 适用于温度控制系统、温度报警装置及散热风扇控制器。 MAX6626的性能特点:
•宽量程;(测量范围宽,并具有很强的过载能力)
•多功能;(能进行多参数靠性;
•高性价比;
•超小型化、微型化;
•微功耗;(有些可用叠层电池甚至纽扣电池供电) •高信噪比。
智能传感器的发展趋势
•采用新技术提高智能化程度;
•单片传感器系统;(将一个可灵活应用的系统集成在一个芯片中)
•网络传感器;(包含数字传感器、网络接口
和处理单元的新一代智能传感器)
•可靠性与安全性设计
二、单片智能温度传感器的原理及应用
温度传感器的发展方向: 单片集成化 产品分类: 1、模拟集成温度传感器: 将温度传感器集成在一个芯片上,可完成温度测量及模拟 信号输出功能的专用IC。 (典型产品:AD590、AD592、TMP17、LM135等) 2、模拟集成温度控制器: 包括温控开关、可编程温度控制器 (典型产品:LM56、AD22105、MAX6509等) 智能化 网络化 单片系统化
ADT70在电阻应变仪中的应用
温度补偿片
输出电压
测量应变片
四、单片硅压力传感器及信号调理器 的原理及应用 普通压阻式压力传感器 硅杯 应变电阻桥路
集成硅压力传感器(ISP)
传感器单元 信号调理 温度补偿 压力修正
MPX2100/4100A/5100/5700系列集成硅压力传感器 美国Motorola公司生产,适合测量管道中的绝对压力 测量范围:
[课件]智能传感器PPT
![[课件]智能传感器PPT](https://img.taocdn.com/s3/m/be9fa7f628ea81c758f5783b.png)
•数据存储和记忆功能;
•双向通信功能。(能通过RS-232,RS-485,USB,I2C等
标准总线接口,直接与微机通信。)
智能传感器原理框图
被 测 信 号
传 感 器
信 号 调 理 电 路
微 处 理 器
输 出 接 口
数 字 量 输 出
智能传感器的特点
•高精度;(例如:测压±0.05%, 测温±0.1℃)
测温范围:-55℃ ~ +125℃ 分辨力:0.0625℃ 测温误差:-40℃ ~ +80℃ ≤ ±3℃ -55℃ ~ +125℃ ≤ ±4℃ 温度/数据转换时间:~ 133ms I2C总线串行时钟频率范围:0~400kHz。利用I2C总线地址 选择端,可选择4片MAX6626。 当被测温度超过上限时,报警输出端被激活。 电源电压范围:+3.0V~+5.5V,静态工作电流:~1mA
3、智能温度传感器(数字温度传感器): 内部包含温度传感器、A/D、信号处理器、存储器 (或寄存器)和接口电路。能输出温度数据及相关的 控制量,适配各种微控制器(MCU)。它是在硬件的 基础上通过软件来实现测试功能的。 4、通用智能温度控制器 在3的基础上发展而成,适配各种微控制器构成智能 化温控系统;可脱离微控制器单独工作,自行构成一个 温控仪,可连续转换也可单次转换。 5、微机散热保护专用的智能温度控制器 专为微机散热保护而设计,可通过散热风扇来控制PC 机中CPU的温度。
监控。
SMBus串行接口能与I2C总线兼容。总线上最 多可接9片MAX6654。
MAX6654的典型应用电路
带实时日历时钟(RTC)的多功能智能温度传感器
DS1629是将智能温度传感器,实时日历时钟
(RTC)和32字节的SRAM集成在一片CMOS大 规模集成电路中,构成功能独特的智能温度传感 器。 能输出9位测温数据,测温范围:-55℃ ~ +125℃
物联网大全
1.物联网的概念物联网(The Internet of things)顾名思义是是“物与物相连的互联网”是将物品的信息通过射频识别(RFID)、红外感应器、传感器等信息采集设备与互联网连接起来,进行信息交换和通讯,以实现智能化识别、定位、跟踪、监控和管理的一种网络。
2.物联网的发展简介1995年盖茨在他的《未来之路》中提出物联网的概念,但是由于那是无线网路,硬件及传感设备发展限制,并未引起重视。
1999年MIT Auto-ID C都可以通过因特网主动进行交换。
射频识别技术、传感器技术、纳米技术、智能嵌入技术enter提出即把所有物品通过射频识别等信息传感设备与互联网连接起来,实现智能化识别和管理。
2004 年日本总务省提出u-Japan 构想,希望在2010年将日本建设成一个何时何地任何人都可以上网的构想。
2005 年11月在突尼斯举行的信息社会世界峰会(WSIS )上,国际电信联盟发布了《ITU 互联网报告2005:物联网》,提出无所不在的“物联网”通信时代即将来临,世界上所有的物体从轮胎到牙刷、从房屋到纸巾将得到更加广泛的应用。
2008年IBM公司提出“智慧的地球”的概念,从此,掀起关于物联网的科技浪潮。
2009年温家宝总理在无锡考察时,发表“感知中国”重要讲话,明确指示要早一点谋划未来,早一点攻破核心技术,并且明确要求尽快建立中国的传感信息中心。
3物联网系统结构物联网被分为三个层次:感知层,网络层,应用层(中间件)。
感知层起到识别物体,采集信息的作用,相当与人体的皮肤和五官。
主要包括二维码标签和识别器,RFID标签和读写器,传感器,终端,传感器网络等。
网络层是物联网的神经中枢和大脑,起到将感知层获取的信息传递和处理的作用。
网络层包括通信与互联网的融合网络,网络管理中心,信息中心和智能处理中心等。
应用层主要实现网络层与物联网引用服务间的接口和能力调用,与行业需求结合,实现智能化。
应用层主要包含各类应用,例如监控服务,智能电网,工业监控等。
国内外物联网发展概况、趋势及典型应用.pptx

物联网进入“十二五”规划,物联网专项资金管理暂行办法出台。
2011年
物联网概念解析
业界 官方 国脉
物联网即“物物相联之网”,指通过射频识别(RFID)、红外感应器、全球定位 系统、激光扫描器等信息传感设备,按约定的协议,把物与物,人与物进行智能 化连接,进行信息交换和通讯,以实现智能化识别、定位、跟踪、监控和管理的 一种新兴网络。物联网不是一种物理上独立存在的完整网络,而是架构在现有互 联网或下一代公网或专网基础上的联网应用(network)和通信能力,强调智能 应用。
美国物联网应用概况
技术及标准的全球领先优势
如加州大学洛杉矶分校 的嵌入式网络感知中心 实验室、网络嵌入系统 实验室等所做的努力。 另外,州立克利夫兰大 学(俄亥俄州)的移动计 算实验室在基 于IP的 移动网络和自组织网络 方面结合无线传感器网 络技术进行了研究。
人才及科研优势
10/12/2020
从企业的角度来看,各 大知 名企业也都纷纷开 展了无线传感器网络的 研究。克尔斯博公司为 国际上率先进行无线传 感器网络研究的先驱, 它为全球超过2000所高 校以及上千家大型公司 提供 无线传感器解决方 案;
均可。最后,只要能达到数据传输的目的即可。
物联网技术体系
物联网封闭空间示意
标示 感知技术
形成物的信 息生命形态
承载网络
执行机构
足够的软件 和数据空间
反馈网络
智能处理
虚拟镜像
物联网产业链
物联网相关产业链价值分布情况
物联网的产业链包括传感器和芯片、设备、网 络运营及服务、软件与应用开发和系统集成。 作为物联网“金字塔”的塔座,传感器将是整 个链条需求总量最大和最基础的环节。将整体 产业链按价值分类,硬件厂商的价值较小,占 产业价值大头的公司通常都集多种角色为一体, 以系统集成商的角色出现。l
物联网体系架构

物联网体系架构:物联网的英文名称为"The Internet of Things” 。
由该名称可见,物联网就是“物物相连的互联网”。
这有两层意思:第一,物联网的核心和基础仍然是互联网,是在互联网基础之上的延伸和扩展的一种网络;第二,扩展到了任其用户端延伸和何物品与物品之间,进行信息交换和通信。
因此,物联网的定义是通过射频识别(RFID)装置、红外感应器、全球定位系统、激光扫描器等信息传感设备,按约定的协议,把任何物品与互联网相连接,进行信息交换和通信,以实现智能化识别、定位、跟踪、监控和管理的一种网络。
物联网的整个结构可分为射频识别系统和信息网络系统两部分。
射频识别系统主要由标签和读写器组成,两者通过RFID空中接口通信。
读写器获取产品标识后,通过internet或其他通讯方式将产品标识上传至信息网络系统的中间件,然后通过ONS解析获取产品的对象名称,继而通过EPC信息服务的各种接口获得产品信息的各种相关服务。
整个信息系统的运行都会借助internet的网络系统,利用在internet基础上的发展出的通信协议和描述语言。
因此我们可以说物联网是架构在internet基础上的关于各种物理产品信息服务的总和。
从应用角度来看,物联网中三个层次值得关注,也即是说,物联网由三部分组成:一是传感网络,即以二维码、RFID、传感器为主,实现对“物”的识别。
二是传输网络,即通过现有的互联网、广电网络、通信网络等实现数据的传输与计算。
三是应用网络,即输入输出控制终端。
EPC系统是一个非常先进的、综合性的和复杂的系统。
其最终目标是为每一单品建立全球的、开放的标识标准。
它主要由全球产品电子代码(EPC)体系、射频识别系统及信息网络系统三大部分组成。
(1)EPC编码标准EPC编码是EPC系统的重要组成部分,它是对实体及实体的相关信息进行代码化,通过统一并规范化的编码建立全球通用的信息交换语言。
(2)EPC标签EPC标签是装载了产品电子代码的射频标签,通常EPC标签是安装在被识别对象上,存储被识别对象相关信息。
世界各国的物联网发展战略

世界各国的物联网发展战略物联网已成为许多国家发展的战略,2005年4月8日,在日内瓦举办的信息社会世界峰会(WSIS)上,国际电信联盟专门成立了泛在网络社会(UbiquitousNetworkSociety国际专家工作组,提供了一个在国际上讨论物联网的常设咨询机构。
根据这个工作组的报告,2005年,许多国家已经纷纷开始物联网的发展战略。
近年来,越来越多的国家开始了基于物联网的发展计划和行动,中国也并不沉默。
从2005年开始,许多国家已纷纷开始无处不在物联网的发展战略。
近年来,越来越多的国家开始了基于物联网的发展计划和行动。
随着日韩基于物联网的U社会战略、欧洲物联网行动计划以及美国智能电网、智慧地球等计划纷纷出台,还有2009年温家宝总理在无锡考察时,提出了把无锡建成感知中国中心。
各国都把物联网建设提升到国家战略来抓,通过大力加强本国物联网建设,来占领这个后IP时代制高点,从而推动和引领未来世界经济的发展。
针对物联网的国家战略以及应用发展迅速,日韩基于物联网的U社会战略、欧洲物联网行动计划以及美国智能电网、智慧地球等计划纷纷出台,物联网已经开始在军事、工业、农业、环境监测、建筑、医疗、空间和海洋探索等领域投入应用。
2009年包括Google在内的互联网厂商、IBM、思科在内的设备制造商和方案解决商以及AT&T、Veri-zon、中移动、中国电信等在内的电信运营企业纷纷加速了物联网的战略布局,以期在未来的物联网领域取得先发优势。
1 主要发达国家的物联网战略1.1 美国的物联网战略美国非常重视物联网的战略地位,在国家情报委员会(NIC)发表的《2025对美国利益潜在影响的关键技术》报告中,将物联网列为六种关键技术之一。
美国国防部在2005年将智能微尘(SMARTDUST)列为重点研发项目。
国家科学基金会的全球网络环境研究(GENI)把在下一代互联网上组建传感器子网作为其中重要一项内容。
2009年2月17日,奥巴马总统签署生效的《2009年美国恢复与再投资法案》中提出在智能电网、卫生医疗信息技术应用和教育信息技术进行大量投资,这些投资建设与物联网技术直接相关。
2020年度系统集成项目工程经理继续教育教学教程推荐课程9题库~(整合)

一、单选题。
每道题只有一个正确答案。
1、1999年MIT成立了Auto-ID Center,并且提出了______,之后与七所知名大学共同组成Auto-ID Labs,旨在通过互联网平台,构造一个实现全球物品信息实时共享的网络。
A “射频识别码”B “产品标识码”C “物品辨识码”D “产品电子码”正确答案D2、2003年11月1日,______正式接管了EPC在全球的推广应用工作,成立了电子产品代码全球推广中心(EPC Global),标志着EPC正式进入全球推广应用阶段。
A Auto-ID LabsB 国家产品标识编码协会C 国际EPC协会D 国际物品编码协会正确d、简单的说,_____是基于特定行业终端,以固定/移动通信网为接入手段,为集团客户提供机器(远程监控终端)到机器(信息处理指挥中心)的解决方案,满足客户对生产过程监控、指挥调度、远程数据采集和测量、远程诊断等方面的信息化需求。
A 物联网应用B 行业物联网C M2M业务D 行业信息化正确答案C2、2012年7月初,ITU-T第13研究组批准了新的标准,确定了物联网定义,介绍了物联网环境发展状况,描述在NGN大背景下____应用的功能要求。
A 面向人与网络的通信。
B 面向人与机器的通信。
C 面向机器与网络的通信。
D 面向机器的通信。
正确答案D3、ITU-T____介绍了物联网的概念和范畴,说明了其基本特性和上层要求,详细描述了其参考模型;此外,探讨了物联网的生态系统及其商业模式。
A Y.2059规范B Y.2060规范C Y.2061规范D Y.2062规范正确答案BETSI于2008年底成立M2M TC(在3GPP中,M2M被称为MTC,即Machine-Type Communications),致力于M2M业务及运营需求、端到端高层架构、应用、解决方案间的互操作性研究。
需求、架构、智能计量用例、eHealth用例方面的标准基本完成。
Gartner技术成熟度曲线整理2015-2014
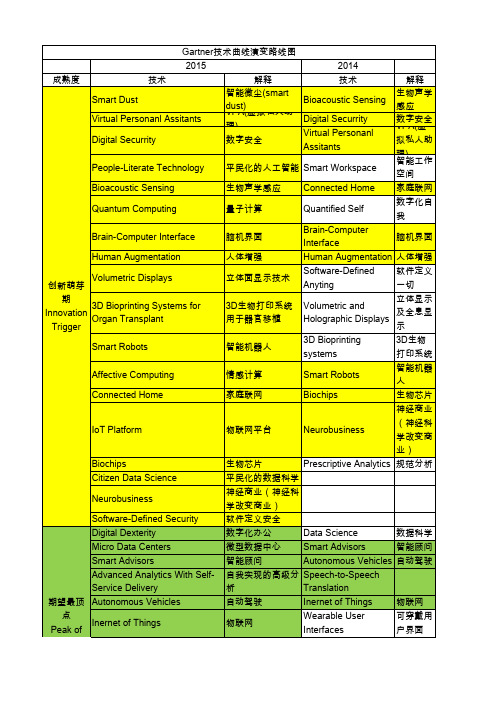
Human Augmentation 人体增强
- 1、下载文档前请自行甄别文档内容的完整性,平台不提供额外的编辑、内容补充、找答案等附加服务。
- 2、"仅部分预览"的文档,不可在线预览部分如存在完整性等问题,可反馈申请退款(可完整预览的文档不适用该条件!)。
- 3、如文档侵犯您的权益,请联系客服反馈,我们会尽快为您处理(人工客服工作时间:9:00-18:30)。
Wireless Systems for Environmental MonitoringThis application note describes how to deploy Crossbow’s MICA family of wireless mesh networking hardware, software, and sensors for environmental monitoring. The sensor nodes are easy to deploy, self-configure, and report into a database and graphical software package. Software for these applications is readily downloaded from Crossbow’s website and TinyOS distribution. All of the software components described in this application note are freely available for use with our hardware/sensors.This application note also covers the technical and performance aspects of Crossbow’s mesh networking protocol and stack known as XMesh (a.k.a. Surge Time Sync). The XMesh stack is self-healing, ad-hoc mesh network which combines two breakthrough technologies – Distributed Time Synchronization and Low-Power Listening. Networks of tens to hundreds of motes can be deployed with one year or more of battery life.This combination of software and hardware delivers a complete solution for environmental monitoring applications. Example deployments include:•Light, temperature, and soil conditions within a green house•Soil moisture and temperature in a vineyard or other high value crop•Wind speed and wind direction measurement in mountainous regions•Frost detection and warning•Measurement of localized ET (Evapo-Transpiration) for Irrigation Control•Indoor comfort monitoring, including HVAC tune-upSystem OverviewMost environmental monitoring deployments have a number of common characteristics. The Crossbow solution addresses the following characteristics:•Monitoring temperature, humidity, barometric pressure and other environmental parameters•Low sampling rates, typically slower than 2 minutes per sensor measurement.•Outdoor environments•Deployment of sensors over several acres or more•Battery operation for at least one year•Remote logging of data and remote data access.Crossbow utilizes its MICA2 and MICA2DOT programmable processor radio modules as the heart of its environmental monitoring system. The MICA2 and/or MICA2DOT are configured with the appropriate sensor and data acquisition boards and packaging. The MICA2 andMICA2DOTs are loaded with TinyOS-based firmware that performs sensor monitoring and power control on top of the XMesh protocol. These packaged sensor modules communicate with the Crossbow Stargate access point which receives sensor readings and logs them into a local database. The sensor data is then accessed, monitored, plotted, and optionally exported with the MOTE-VIEW graphical user interface from any network connected PC. Figure 1 shows the environmental monitoring system architecture and the way these various components fit together.Figure 1. Crossbow’s Wireless Environmental Monitoring System OverviewThe software components that come together to form this system are listed below and shown in Figure 2. All of these software components are available from Crossbow at no charge for use with our hardware.MICA2 / MICA2DOT -based Enviromental Sensors:•TinyOS operating system*•XMesh (Surge Time Sync)* component which handles all networking and radio communications.•XSensor sensor application* which is customized for sampling environmental sensors available from Crossbow (see Sensor section of Appnote)Stargate Base Station and Sensor Data Server / Database :•Basestation MICA2 mote running XMesh (Surge Time Sync) * for interfacing to Sensor Network•XListen* software which parses mote data packets and stores into Postgres database.•Postgres* database for local storage of data•Linux* operating system for StargatePC:•MOTE-VIEW** data visualization program for Windows based machines Notes:*Open source code in ** Free runtime executable from CrossbowFigure 2. Software Components and Architecture of Mesh NetworkSensorsCrossbow’s MICA2/MICA2DOT platforms and wireless mesh network software are easily integrated with a wide variety of sensors. Presently, Crossbow offers the following low-power sensor combinations for environmental monitoring:Packaging: •MEP410 is packaged in a water resistant plastic box with externalantenna and external battery box. The battery box canaccommodate 2 C size batteries.•MEP510 is packaged in a water resistant plastic box with externalantenna and an internal lithium 2/3 AA battery.•The MTS400/410 and MDA300 are not presently environmentallypackaged, but Customer can easily add external housingHumidity Sensor:Type:Accuracy:Long Term Stability:Min OperatingVoltage:•Sensirion SHT11•3% from 20% to 80% RH•5% from 0% to 20% RH•5% from 80% to 100% RH•<1% RH per year•2.4VTemperature Sensor:Type:Accuracy:•Internal to Humidity and Barometric Sensor•Humidity Temp: +/- 1.5°C from -100 C to+600 C•Barometric Temp: +/- 0.8° C from -100C to+60° CBarometricPressureSensor: Type: Accuracy: Long Term Stability: Min. Operating Volts: • Intersema MS5534A • +/- 1.5 mbar from 750 to 1100 mbar• -1 mbar/yr• 2.2VLight Sensor: MEP410Type: Location: Min. Operating Voltage:• Hamamatsu S1337, UV range: 190-1100 nm• Hamamatsu S1087,Visible range: 320-730 nm• One each on top and bottomof package (both lightsensors)• 2.2VAccelerometer Sensor:Type:Range: • Analog Devices ADXL202 • +/-2 g GPS:Type: • SIRF, 12-Channel Receiver The MEP410 can optionally be loaded with an internal humidity sensor along with the external humidity sensorMDA300: The MDA300 is a general purpose data acquisition board that can interface to a variety of external sensors. It also includes an internal temperature and humidity sensor. See MDA300 datasheet for complete list of data acquisition features.Commonly Used Sensors for MDA300 include: • Echo EC-20 and EC-10 Dielectric Aquameter for measuring soil moisture content. Accuracy: .03m/m (% water content) • Spectrum Soil Temperature ProbeWireless CommunicationCrossbow’s MICA2 and MICA2DOT motes have integrated radios that are designed to operate in the ISM band. Crossbow manufactures motes in several different frequency ranges to support the various ISM bands throughout the world. Users should purchase the appropriate frequency range for ISM band rules of their country. Users should also consider radio range requirements when selecting the appropriate MICA2 or MICA2DOT mote. The following table summarizes currently available options recommended for Environmental Monitoring.MPR400, MPR500 MICA2, MICA2DOT 868/900-928MHz (US, Europe) MPR410, MPR510 MICA2, MICA2DOT 432-434MHz (US, Europe)MPR420, MPR520 MICA2, MICA2DOT 315MHz (Japan only)Antenna: Crossbow recommends an external, ¼ wave whip antennae. These antennae are inexpensive and offer improved coverage. The MICA2 has an MMCX connector for easy connection to many types of external antennas. All sensors should be placed such that theantennas are oriented vertically. Horizontal placement of the antennae will result in a substantial loss of distance.Radio Range: Lower radio frequencies for example, 433 MHz, will have longer ranges in an outdoor deployment. Depending on the foliage and environmental conditions, expect ranges of 200-500 feet at 433 MHz and 100-300 feet with 916 MHz. Remember, the XMesh stack willautomatically configure the network and allow for radio range extension via message hopping across multiple deployed sensors.Placement: Units are usually placed at least 1-3 feet above the ground. Placing units at ground level will decrease communication range. Grass and other foliage will also decrease distance. Crossbow recommends the following average mesh grid density:916 MHz: 1 mote/2500 sq feet (50’ by 50’).433 MHz: 1 mote/10000 sq feet (100’ by 100’).Foliage and other RF obstacles will decrease distance. However, if the units are deployed such that motes can find other motes (parents) then the network will automatically reroute radio traffic.Figure 3. Aerial photo of Sensor Network DeploymentXMesh Networking StackCrossbow’s deployments are based on the XMesh (Surge Time Sync) networking protocol which has been optimized for low-duty cycle, environmental monitoring, applications. The XMesh network has the following features:•Low power (typically less than 350 µA average current).•Network time synchronization to +/- 1 msec.•Low power listening with an 8 time per second wake-up interval, allowing for rapid message transfer across the network.The default sampling period is 3 minutes, although many other sampling intervals are allowable. The following average currents were measured at different sampling intervals:Data Interval (minutes) Average MICA2 or MICA2DOT Current(µA)1 6773 3156 196The XMesh network has been extensively tested both at indoor and outdoor locations. In a typical indoor test, nodes were placed at every 300 sq ft. to cover a 10,000 sq ft facility. To simulate larger distance between nodes, the radio transmit power was turned down to -6dBm. In outdoor tests nodes were spread across several acres of rugged terrain with an average density of 1 mote per 10,000 sq ft and at full radio power. Statistical analysis across many deployments shows on average greater than 90% of all traffic generated at any node will be collected at the base station without the use of end-end acknowledgements.Stargate Base StationFigure 4. Stargate gateway as a base stationThe Crossbow Stargate gateway and microserver is an embedded Linux computer designed to be the primary access point for wireless sensor networks. The Stargate’s small form factor, reliability, and optional communication interfaces makes it ideal for remote, environmental monitoring. A base station mote (MICA2) is connected to the 51-pin connector on the Stargate.A resident program, XListen, takes an input stream of wireless sensor data from the base station mote and stores it in a local Postgres database.The Crossbow Stagate can be connected to a wide-area or back-haul network in one of the following ways:•Wired Ethernet connection•WiFi, using a Compact Flash card (Netgear MA701, AmbicomWL1100C-CF, etc.)•Long Range WiFi using PCMCIA card (ZComax or SMC Wireless SMC2532W-B).•Cell phone modem card (Sierra Wireless Aircard 555D) for remote cellular access.Remote administration and database replication for the sensor data logged onto the Stargate is done with a secure shell connection (ssh).Xlisten Logging Software for StargateThe Xlisten software which runs on Stargate acts as the intermediary between the sensor readings from the wireless mesh network of sensors and the Postgres database installed on Stargate. Xlisten is able to recognize and interpret packets in a standardized format. The standard packet generally includes at a minimum: node ID, parent, sensorboard ID, and voltage. Data transmitted by the motes is a raw analog or digital reading. Final conversion to engineering units (e.g., degree C) is done by Xlisten or MOTE-VIEW. The full C source code for conversion is available and provides a good reference for how to convert sensor readings for the entire line of Crossbow wireless products. Other sensor conversions are easily added. Most common conversions are in the shared xconvert.c library.Xlisten is written to be extensible so that support for new sensors and packets is straightforward to add. Each sensorboard is handled with a single source module in the boards directory. The particular board to use is decided by looking up the unique board ID field. The board file provides specific handling for printing parsed and converted packets, as well as data logging. Data Visualization Software: MOTE-VIEWMOTE-VIEW is a Windows .NET-based data visualization tool for monitoring and managing sensor networks. MOTE-VIEW connects to the remote Postgres database on the Stargate basestation through a TCP/IP link.MOTE-VIEW has a number of useful features for monitoring and understanding wireless sensor data. These features include:•Historical and Real-Time Charting•Topology Map•Data Export•PrintingExportMOTE-VIEW allows the users to export data as CSV (comma delimited text) or XML. All data is exported as raw data or converted to engineering units.VisualizationThere are three ways to visualize sensor data in MOTE-VIEW:•Data Grid – Last sensor result set received from each node.•Charts – Three charts of a sensor against time for multiple nodes.•Topology Map – Spatial view of last result from each node.Figure 5. MOTE-VIEW Charts each data point with linear extrapolation between them.Zoom and pan functionality is supported as well.Network Health MonitoringMOTE-VIEW provides diagnostics for evaluating network health that is quite effective in the field. Each node is color coded by the amount of time since the last data was received. Green signifies that data was received in the last 20 minutes and that the node is “healthy”. The node color then further erodes as the last result grows increasingly stale: light green color after 20 minutes, yellow after 40 minutes, orange after an hour, and red after a full day of no results.Figure 6. MOTE-VIEW topology map: Nodes are color coded by temperature. The possible colors are: blue (temp < 18C), green (18C < temp < 22C), yellow (22C < temp < 26C), orange(26C< temp < 30C), and red (temp > 30C)Battery LifeBattery life is a critical parameter for low power networks. The power consumption of individual motes within the network varies due to the number of radio messages that a mote hears and transmits. Most of the battery power is expended for these operations. Motes close to the base station see higher radio traffic and therefore have lower battery life. Due to this variability it has been difficult to predict and measure the actual power usage of individual motes as well as the entire network. Measuring battery life in the field is useful, but most customers want to have a good idea of battery life prior to deployment. For this reason, Crossbow has expended significant development to accurately measure and characterize the battery life and current consumption of its hardware in real-world deployments.In order to characterize this power usage, Crossbow has developed power monitoring software that runs in the motes during network testing. These diagnostic modes monitor various power states of the mote, such as:•Microprocessor on-time and sleep time power•Radio receive power for each packet•Radio transmit power time for each packetEach time the mote cycles through these states, the power consumed is computed and accumulated with the previous used power. Data is periodically transmitted to the base station for logging. Figure 7 below shows the analysis of a networking session. The left diagram shows the average current consumed for each mote in the network.Figure 7. The left diagram shows the average current consumed for each mote in the network. The right diagram shows the expected lifetime of each mote in the network using2000 mA-hr batteries.Battery Life and Average CurrentBy integrating the total current consumed, the ACM100 can accurately compute the average operational current even though the motes cycles through current consumption states that differs by up-to three orders of magnitude. Utilizing this real average, we accurately predict the battery life time. Below is a graph of a 2000 mA-hr battery based on different average currents.Figure 8. Battery Life vs. Average CurrentAchieving average operational currents below 500 µA is critical for multi-month operation on AA batteries. An average current below 250 µA is needed for one year operation. Larger batteries (C or D) can be used for extended operation. The table below estimates the battery life for different Alkaline battery sizes at different current drains:Battery Size Capacity(mA-hr)Battery Life@ 250µA (yrs)Battery Life@ 500µA (yrs)Battery Life@ 1mA (yrs)AA 2000 1 0.5 0.25C 6000 3 1.5 0.75D 12000 7 3.5 1.5。