差分输出、电流模式DAC的参数和测量方法(精)
测量差分输出电流模式DAC的线性度

Maxim > App Notes > HIGH-SPEED INTERCONNECTNov 30, 2007 Keywords: differential nonlinearity, integral nonlinearity, INL, DNL, end-point, best-fit, DAC, digital-to-analog converter,transfer function, monotonicity, current-mode, LSB, weight, compliance, MSBAPPLICATION NOTE 4159Measuring the Linearity of Differential-Output, Current-Mode Digital-to-Analog Converters (DACs)Abstract: Measuring the linearity of digital-to-analog converters (DACs) is not a trivial task. There are many potential sources of error, including thermal effects, ground loops, and instrument accuracy. Additionally, a complete linearity measurement of DACs with digital resolution in excess of 10 bits can be time consuming with bench instruments. This application note details how to perform these tests quickly with minimal errors.Note: Maxim Integrated Products manufactures many current-output DACs with various resolutions. The MAX5891 will be used for specific examples of measurements and specifications in this paper. However, the parameters and techniques can be applied to many other differential-output, current-mode DACs.Brief Discussion of Linearity ParametersTwo main specifications are used for defining the linear accuracy of data converters: integral (INL) and differential (DNL) nonlinearity. INL is the deviation of the output transfer function from an ideal straight line. DNL refers to the error in the step size at the converter output with respect to an ideal step size.INL can be specified using one of two techniques: (1) end-point INL or (2) best-fit INL. End-point INL means that the actual values measured at the end points of the DAC transfer curve are used for computing the converter's linearity. Best-fit INL, on the other hand, computes the slope of the transfer curve to minimize the peak reported INL.Figure 1a. End-point integral linearity error.Figure 1b. Best-fit integral linearity error.Figures 1a and 1b display a graphical representation of how the two methods relate to a given transfer function. Notice that the size and shape of the curve in the DAC transfer function is identical in both cases. Note also that Figure 1a, using end-point linearity, has a large, positive INL with no negative error.Applying a best-fit method, as shown in Figure 1b, reduces the reported maximum INL by moving some of the positive error to the negative side of the straight line. Notice that the total magnitude of the linearity error remains the same as the straight-line calculation.The DNL specification is less open to interpretation, though how the weight of the least-significant bit (LSB) is determined can impact the DNL. One concern with DNL in a DAC is that there are no codes with a DNL of less than -1 LSB. DNL errors below this level indicate that the device is nonmonotonic. A DAC is monotonic when the output does not decrease when the input code increases, or when the output does not increase when the input code decreases. Figure 2 illustrates positive and negative DNL errors and clarifies the concept of monotonicity.The method used for measuring linearity needs to account for the architecture of the DAC being evaluated. Converting the output of a current-mode DAC to a voltage is preferred because it enables the use of a voltmeter rather than a current meter. The typical multimeter has greater resolution when measuring voltages than currents. The configuration of the current sources determines how many codes need to be measured to get an accurate assessment of the device's performance.Figure 2. Example of DNL errors.Converting a current (I) to a voltage (V) can be accomplished in many ways but is dependent on several factors. One of the first things to consider is the multimeter that will be used for the measurements. The maximum resolution of the available equipment determines the minimum LSB weight required for an accurate measurement. The recommended ratio for LSB-weight-to-meter-resolution is 100 to 1; the meter should be able to measure 1/100th of an LSB.The output-compliance rating of the specific DAC under test also impacts how the I-to-V conversion is accomplished. Output compliance for a current-mode DAC is the ability of the device to tolerate a voltage at its output without impacting its performance. Increasing the load resistor increases the voltage swing and the LSB size, but the compliance rating limits the maximum load.An alternative to a simple resistive conversion is the use an operational amplifier in a virtual-ground configuration, as shown in Figure 3. The advantage of this configuration is the ability to increase the LSB size significantly higher than compliance limitations would otherwise allow since the voltage at the DAC output is held at zero. However, the compliance and linearity of the amplifier, along with thermal gradients, may impact the measurements. Also, two matched amplifiers would be needed to measure a differential-output device.Figure 3. Virtual-ground I-to-V conversion.Another consideration when measuring linearity is the resolution of the DAC to be evaluated. Higher resolution devices generate smaller LSB sizes. Consider the MAX5891 (16-bit), the MAX5890 (14-bit), and the MAX5889 (12-bit) devices. Each of these devices output 20mA full scale. The respective LSB sizes would be 15.25µV, 61.04µV, and 244.2µV when using a 50Ω load. The smaller the LSB size, the higher the accuracy and resolution required by the multimeter. Regarding the DAC's resolution, one should also determine how many codes are required to accurately measure the device's performance. A 16-bit device has 65,536 possible input codes, and a 12-bit device has 4,096. Because it is impractical to measure all of them manually, a common technique is to measure a subset of codes. The smaller number of codes reduces the time required to collect the data and can still provide very accurate results. Knowledge of the device's architecture is useful for selecting an optimal code set for a given device.Temperature effects can be significant when measuring the linearity of current-output devices. Power dissipated in the output load resistors causes the resistors to heat up, which in turn changes their resistance value (unless resistors are used with 0ppm temperature coefficients). One method to combat this is to switch the input codes in a way that effectively provides averaging for the power dissipated by the loads.The technique here is best suited for automated measurements since the dwell time at any given code can be minimized. Each code and its complement are measured, such as 0x4800 then 0xB7FF. By measuring each code and its complement, the average power remains constant in the load, since the most-significant bit (MSB) inputs are measured in a ramp fashion from zero scale to full scale. Because LSBs are measured at mid-scale, this technique is not applied to them, since the change in power is relatively small.Measurement DetailsThe following is the linearity measurement method that Maxim Integrated Products has used in the development of several devices. The MAX5873, MAX5875, MAX5885, MAX5888, MAX5891, MAX5895, and MAX5898 devices have all been measured using this method. Laboratory measurements were made during initial design evaluation and in the verification of production test methods. While the example that follows is specific to the MAX5891, this method can also be applied to other devices.The MAX5891 device utilizes a 5-4-3-4 segmentation architecture. Segmentation is the effective division of the single 16-bit device into four separate DACs, a 5-bit, a 4-bit, a 3-bit, and a second 4-bit device. The 5 MSBs consist of 31 (25 - 1) equal-weighted current sources, one for each possible input code for the 5 bits. The next 4 bits use 15 sources, and the next 3 use 7. The 4 LSBs are binary-weighted current sources with each lower bit equal to half the previous bit's value. The total number of current sources, 57 (31 + 15 + 7 + 4) plus full scale and zero scale, determines the minimum number of codes needed to measure the MAX5891's linearity. These 59 measurements allow one to reconstruct the complete DAC output transfer function. Once the transfer function is determined, the linearity can be computed. The downside of this technique can be a reduction in accuracy, a tradeoff for reduced test time. Table 1 lists the code set recommended for the MAX5891.10x0000210x8500410x700020x8001220x8580420x780030x8002230x8600430x800040x8004240x8680440x880050x8010250x8700450x900060x8020260x8780460x980070x8030270x0800470xA00080x8040280x1000480xA80090x8050290x1800490xB000100x8060300x2000500xB800110x8070310x2800510xC000120x8080320x3000520xC800130x8100330x3800530xD000140x8180340x3800540xD800150x8200350x4000550xE000160x8280360x4800560xE800170x8300370x5000570xF000180x8380380x5800580xF800190x8400390x6000590xFFFF200x8480400x6800The MAX5890 and other Maxim 14-bit devices use a 5-4-3-2 segmentation architecture. The code set for the 14-bit architecture is shown in T able 2. The MAX5889 and other Maxim 12-bit devices use a 5-4-3 architecture. The code set for the 12-bit architecture is shown in Table 3.10x0000290x2140390x1C0020x2001210x2160400x1E0030x2002220x2180410x200040x2004230x21A0420x220050x2008240x21C0430x240060x200C250x21E0440x260070x2010260x0200450x280080x2014270x0400460x2A0090x2018280x0600470x2C00100x201C290x0800480x2E00110x2020300x0A00490x3000120x2040310x0C00500x3200130x2060320x0E00510x3400140x2080330x1000520x3600150x20A0340x1200530x3800160x20C0350x1400540x3A00170x20E0360x1600550x3C00180x2100370x1800560x3E00190x2120380x1A00570x3FFFTable 3. 12-Bit Code Set for a 5-4-3 Architecture10x000200x860390x80020x801210x868400x88030x802220x870410x90040x803230x878420x98050x804240x080430xA0060x805250x100440xA8070x806260x180450xB0080x807270x200460xB8090x808280x280470xC00100x810290x300480xC80110x818300x380490xD00120x820310x400500xD80130x828320x480510xE00140x830330x500520xE80150x838340x580530xF00160x840350x600540xF80170x848360x680550xFFF180x850370x700190x858380x780Now that the code set has been defined, we must address how the measurements will be collected. The preferred multimeter for these measurements is the Agilent™ 3458, which provides 8.5 digits of resolution. The meter is connected between the OUTP and OUTN terminals of the MAX5891, which are terminated in 50Ω loads to ground. The resulting voltage swing at the meter input is ±1V when the DAC is set for a 20mA full-scale current.The meter range is set to a fixed 1.2V full-scale range with maximum resolution, which results in a 10nV minimum measurement. Switching meter ranges can add gain errors to the measured values; therefore, a single voltage range is used to eliminate this additional error source. A clock signal is also required for MAX5891 since the digital inputs are latched. Once the meter, clock source, supply voltage, and digital input controls are connected, we are ready to collect the linearity measurements.After all the measurement points are collected, we need to create the reconstructed DAC output transfer curve. Since each individual current source was measured, we can easily create a transfer function for all codes. For example, consider the 4 LSBs of the device. We measured codes 0x8000, 0x8001, 0x8002, 0x8004, and 0x8008. Code 0x8000, mid-scale of the DAC is the reference for the LSB calculations. The weight for the LSB is the voltage measured at 0x8001 minus the voltage measured at 0x8000.Similar equations apply for all the codes measured between 0x8001 and 0x8780. The remaining points, 0x0800 through0xF800, are the MSB current sources, and they are computed with reference to code 0x0000. Consider the code 0x4F31 as an example of how the various currents are summed.First, we need to determine which measurement points, when added together, will equal the example code. 0x4800 is the highest MSB code that is less than the target code. The remainder when subtracting 0x4800 from 0x4F31 is 0x0331. Code 0x0300 is the next highest code that can be subtracted (0x8300 - 0x8000), followed by 0x0030 (0x8030 - 0x8000), and finally 0x0001 (0x8001 - 0x8000).Therefore, the voltage for code 0x4F31 can be expressed by the equation:[V(0x4800) - V(0x0000)] + [V(0x8300) - V(0x8000)] + [V(0x8030) - V(0x8000)] + [V(0x8001) - V(0x8000)] (Eq. 1)Using similar equations, we can compute the voltage for any given input code. Tools such as MATLAB® or Excel® software can be used to easily compute the voltage for all codes and reconstruct the entire DAC transfer curve.Once we have the transfer curve, we can compute the linearity. The first step is to calculate the voltage for an LSB based on the end points of the transfer curve (end-point method).V LSB = [V(0xFFFF) - V(0x0000)]/[2N - 1](Eq. 2)whereN is the device resolution (16, 14, or 12 bits)V(0x0000) is the measured DAC zero-scale output voltageV(0xFFFF) is the measured DAC full-scale output voltageThe INL for any given code is then calculated with the equation:INL CODE(LSBs) = [V CODE - (CODE × V LSB)]/V LSB(Eq. 3)whereCODE is the digital code being calculatedV LSB is the voltage calculated in Eq. 2V CODE is the computed DAC output voltageThe following is the equation for calculating the DNL for any given code:DNL CODE(LSBs) = [V CODE - V Code-1 - V LSB]/V LSB(Eq. 4)whereCODE is the digital code being calculatedV CODE is the calculated DAC output voltage for CODEV CODE-1 is the calculated DAC output voltage for CODE - 1V LSB is the voltage calculated in Eq. 2Below are example MATLAB scripts that calculate the linearity of the MAX5889, MAX5890, and MAX5891. Each returns the codes and values for the minimum and maximum DNL and INL errors. They also generate plots showing the transfer curve, INL, and DNL for all possible codes. The user is required to enter the voltage measurements for the codes listed in the previous tables. The values must be entered in the order they are listed.MATLAB Script to Compute 16-Bit Linearityfunction Lin16(Measurements)%Calculate INL and DNL of a 16 bit device with a 5-4-3-4 segmentation architecture % DacCodes is the range of possible input data to the 16 bit DACDacCodes=[0:65535]';%VOUT for each code is calculated from the measured points%create a VOUT variable and fill it with zerosVOUT=zeros(size(DacCodes));%The first measurement is the zero-scale point, or code (0x0000)ZS=Measurements(1);VOUT(1)=ZS;%The last measurement is the full-scale point, or code (0xFFFF)FS=Measurements(length(Measurements));VOUT(65536)=FS;%Midscale is stored at position 43 of the input data arrayMS=Measurements(43);%The device has four segmentation levelsSegments=4;%The decimal values for the LSB codes are 1, 2, 4 and 8Seg1Codes=[1;2;4;8];%The voltages for the LSBs are in positions 2–5 of the input arrayfor i=1:4Seg1V(i)=Measurements(i+1)-MS;end%The second level of segmentation is controlled with input codes 16 through%112 in steps of 16. Create the code array and fill the measurements for%this segmentation levelSeg2Codes=[16:16:16*7]';for i=1:7Seg2V(i)=Measurements(i+5)-MS;end%Segmentation level 3 uses input codes 128 through 1920 in steps of 128.%Create the code array and fill the measurements array.Seg3Codes=[128:128:128*(2^4-1)]';for i=1:15Seg3V(i)=Measurements(i+12)-MS;end%Segmentation level 3 uses input codes 2048 through 63,488 in steps of 2048. %Create the code array and fill the measurements array.Seg4Codes=[2048:2048:2048*(2^5-1)]';for i=1:31Seg4V(i)=Measurements(i+27)-ZS;end%The endpoints have been defined, now fill in the voltages for the%remaining points of the DAC transfer function.for i = 2:65535targetcode=i-1;VOUT(i)=ZS;for s=31:-1:1if Seg4Codes(s)<=targetcodetargetcode=targetcode-Seg4Codes(s);VOUT(i)=VOUT(i)+Seg4V(s);s=0;endendfor s=15:-1:1if Seg3Codes(s)<=targetcodetargetcode=targetcode-Seg3Codes(s);VOUT(i)=VOUT(i)+Seg3V(s);s=0;endif targetcode==0s=0;endendfor s=7:-1:1if Seg2Codes(s)<=targetcodetargetcode=targetcode-Seg2Codes(s);VOUT(i)=VOUT(i)+Seg2V(s);s=0;endif targetcode==0s=0;endendif targetcode==0s=0;endfor s=4:-1:1if Seg1Codes(s)<=targetcodetargetcode=targetcode-Seg1Codes(s);VOUT(i)=VOUT(i)+Seg1V(s);endendend%Plot the transfer functionfigure(1)plot(DacCodes, VOUT);xlabel('DAC Input Code');ylabel('Measured Voltage');axis([0 65536 -1.1 1.1]);title('DAC Transfer Function');set(gca,'XTick',0:16384:65536)%Calculate the linearityLSB=(max(VOUT)-min(VOUT))/65535;INL(1)=0;DNL(1)=0;for i=2:65536INL(i)=(VOUT(i)-(VOUT(1)+(i-1)*LSB))/LSB; DNL(i)=(VOUT(i)-VOUT(i-1)-LSB)/LSB; end%Plot INLfigure(2)plot(DacCodes, INL);title('DAC Integral Linearity');xlabel('DAC Input Code');ylabel('INL (LSBs)');axis([0 65536 min(INL)*1.1 max(INL)*1.1]); set(gca,'XTick',0:16384:65536)%Plot DNLfigure(3)plot(DacCodes, DNL);title('DAC Differential Linearity');xlabel('DAC Input Code');ylabel('DNL (LSBs)');axis([0 65536 min(DNL)*1.1 max(DNL)*1.1]); set(gca,'XTick',0:16384:65536)txtstr=sprintf('INL MAX = %f', max(INL));disp (txtstr);txtstr=sprintf('INL MIN = %f', min(INL));disp (txtstr);txtstr=sprintf('DNL MAX = %f', max(DNL)); disp (txtstr);txtstr=sprintf('DNL MIN = %f', min(DNL));disp (txtstr);Example Plots Generated by the 16-Bit ScriptAgilent is a trademark of Agilent Technologies, Inc.MATLAB is a registered trademark of The MathWorks, Inc.Excel is a registered trademark of Microsoft Corp.Application Note 4159: /an4159More InformationFor technical questions and support: /supportFor samples: /samplesOther questions and comments: /contactKeep Me InformedPreview new application notes in your areas of interest as soon as they are published. Subscribe to EE-Mail - Application Notes for weekly updates.Related PartsMAX5889:QuickView-- Full (PDF) Data Sheet-- Free SamplesMAX5890:QuickView-- Full (PDF) Data Sheet-- Free Samples MAX5891:QuickView-- Full (PDF) Data Sheet-- Free SamplesAN4159, AN 4159, APP4159, Appnote4159, Appnote 4159 Copyright © by Maxim Integrated ProductsAdditional legal notices: /legal。
DAC的性能指标

DAC的性能指标D/A转换器的输出形式有电流型和电压型,输出极性可以是单极性,也可以是双极性。
对于电流输出型DAC,一般要外接集成运放,以将输出电流转换成输出电压,同时还可以提高负载能力。
在实际应用中,一般选用电流输出型DAC来实现电压输出。
DAC的性能指标很多,主要有以下几个。
①分辨率:是指D\C能分辨的最小输出模拟增量,取决于输人数字量的二进制位数。
分辨率通常用数字量的位数表示,一般为8位、12位、16位等。
一个n位的DAC所能分辨的最小电压增量定义为满量程值的2-n倍。
例如,满量程为10V的8位DAC芯片的分辨率为10V×2-8=39mV。
一个同样量程的16位DAC的分辨率高达lOV×2-16=153μV.②转换精度:转换精度和分辨率是两个不同的概念。
转换精度是指满量程时DAC的实际模拟输出值和理论值的接近程度。
对T型电阻网络的DAC,其转换精度和参考电压U ref 、电阻值和电子开关的误差有关。
例如,满量程时理论输出值为10V,实际输出值为9,99~10.DIV,其转换精度为±10mV。
通常DAC的转换精度为分辨率之半,即为LSB/2。
LSB是分辨率,是指最低一位数字量变化引起幅度的变化量。
③偏移量误差:是指输入数字量为零时,输出模拟量对零的偏移值。
这种误差通常可以通过DAC的外接U ref 和电位计权加以调整。
④线性度:是指DAC的实际转换特性曲线和理想直线之问的最大偏差。
通常,线性度不应超过±1/2 LSB。
⑤输入编码形式:是指DAC输人数字量的编码形式,如二进制码、BCD码等。
⑥输出电压:是指DAC的输出电压信号。
不同型号的DAC,输出电压相差很大,对于电压输出型,一般为5~10V,也有高压输出型的,为24~30V。
对于电流输出型的DAC,输出电流一般为20mA 左右,高者有的达到3A。
⑦转换时间:是指输入的数字信号转换为输出的模拟信号所需要的时间。
使用差分放大器的高端电流检测解决方案

使用差分放大器的高端电流检测解决方案最近我拒绝的一个 DI 有几个原因,其中包括一个存在实施问题的高端电流检测电路。
这让我开始思考在电压轨上实现电流感应的不同方法。
从本质上讲,大多数直流电流检测电路都是从电源线中的电阻开始的(尽管磁场检测是一个很好的替代方案,尤其是在更高电流的情况下)。
一个简单的测量电阻两端的电压降并根据需要对其进行缩放以读取电流(E = I × R(如果我不包括这个,有人会抱怨))。
如果检测电阻器位于接地端,则解决方案是一个简单的运算放大器电路。
一切都以接地为参考,您只需注意接地布局中的小电压降。
但通常,将检测电阻器放置在电源引线中是首选方法。
为什么?接地可能不可用(例如,底盘接地的汽车设备),或者您可能不希望设备接地不同于电源接地,这可能导致接地环路和其他问题。
那么,有哪些选择呢?最明显和最明确的方法是在检测电阻上放置一个差分或仪表放大器(inamp),但实际上这很少是一个好方法。
为了准确地检测电流,通常需要极高的 CMR(共模抑制),这既昂贵又容易漂移。
怎么会这样?让我们考虑一个示例设计:0-10A、12V 标称值、5mΩ检测电阻:最明显的高端电流检测解决方案,使用差分放大器。
甚至不要考虑为此使用分立电阻,除非它们是精密匹配网络的一部分(因此当然不是真正的分立)。
对于 1V 的电源电压偏移和 80dB 的差分放大器 CMRR(转换为约0.01% 的电阻匹配),您将看到相当于 20mA 的电流偏移(80dB CMRR 的 1V 变化导致 0.1 mV 偏移参考输入;除以 5mΩ检测电阻器的 5mV/A 缩放比例)。
对于 0-12V 电源,将其乘以 12:电压范围内的 240mA 偏移。
请注意,真正的三运放仪表放大器对电阻匹配的敏感度低于单运放差分放大器。
尽管如此,通常有更好的方法。
我上面提到的设计理念使用了带有分立电阻的单运算放大器差分放大器。
事实上,一个电阻器可以用一个电位器微调,我最初认为这是用于CMRR,但结果是增益调整!如果电源电压坚如磐石,这在某种意义上是可行的,但这并不是一个好主意。
DAC静态参数测试
第四章 DAC 静态电参数测试本文要点:DAC 电参数义的定DAC 规静态电参数测试计常方法及算公式DAC 测试统系的典型硬件配置DAC 数规据范(Data Sheet)样例选择输码减如何入代以少DAC 测试时间的如何提高DAC 电参数测试的精度及稳定性关键词释解调误失差Eo(Offset Error)转换线实际值与值值:特性曲的起始理想起始(零)的偏差。
误增益差E G (Gain Error)转换线实际与资:特性曲的斜率理想斜率的偏差。
(在有些料误称为满误上增益差又刻度差)线误性差Er(Linearity Error)转换线与拟线间:特性曲最佳合直的最大偏差。
(NS 公司义定)或者用:准确度E A (Accuracy 转换线与转换线):特性曲理想特性曲的最大偏差(AD 义公司定)。
线误微分性差E DL (Differential Linearity Error)值满值围内邻输:在起始到刻度的范相入数码对应拟输电压实际值与的模出之差的1LS 值简单说个理想得最大偏差。
的,就是在整转换围内范每一步距(1LSB)的最大偏差。
满围刻度范(FSR):DAC 输电压围的出范。
最小有效位(LSB):DAC 输变时输电压变入化一位,出的化量。
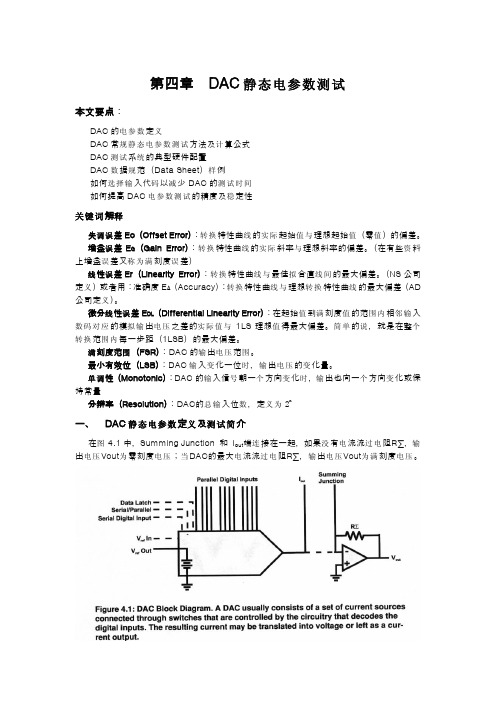
单调性(Monotonic):DAC 输号个变时输个变的入信朝一方向化,出也向一方向化或保持常量分辨率(Resolution):DAC 总的输数义为入位,定2n 一、 DAC 静态电参数义测试简定及介在图4.1中,Summing Junction 和 I out 连没电过电端接在一起,如果有流流阻R∑输,电压出Vout 为电压当零刻度;DAC 电过电的最大流流阻R∑输电压,出Vout 为满电压刻度。
来自DAC 运输电或算放大器入端的漏流以及放大器输调电压电压的入失使得零刻度偏值输电离典型。
出流(Iout 输)以及入基准(Vref 满电压误别)的偏差引起刻度的差。
特要注意的是DAC 输满电压时运调电压它误出刻度,算放大器的失以及其的零点差也在起着作样误用(同零点差(offset error 响间码输电压值说满输)也影着中代出)。
ADCDAC的一些参数
ADCDAC的⼀些参数1、LSB,Least Significant BitLSB是指最低位⼀个bit的权值,⽐喻ADC是⼀把尺⼦,那LSB则是它的最⼩刻度。
LSB=Vfs/(2^N),Vfs为full scale voltage,N为ADC的分辨率(Resolution)。
2、Offset ErrorOffset Error通常⼜被叫做Zero-Scale Error。
简单理解,对于ADC,输⼊的Analog信号,只有抵消(或叠加)Offset Error,才能正常进⾏AD 转换;⽽对于DAC,输出的Analog信号,必须抵消(或叠加)Offset Error,才能有正常的Analog输出。
多⽤LSB或者是Percent of Vfs来表⽰。
3、Gain Error即使是假设没有Offset Error,ADC/DAC输⼊或者输出的Voltage,在Measured和Ideal之间还是会有差值。
Gain Error事实上是表征actual function和ideal function斜率差值的量。
如图⼀DAC function的曲线,将实测曲线沿y轴下移并保持与原曲线平⾏,则full scale处voltage的差值便是Gain Error;ADC曲线可沿x轴平移,亦可得出Gain Error。
其单位同样是LSB或者是Percent of Vfs。
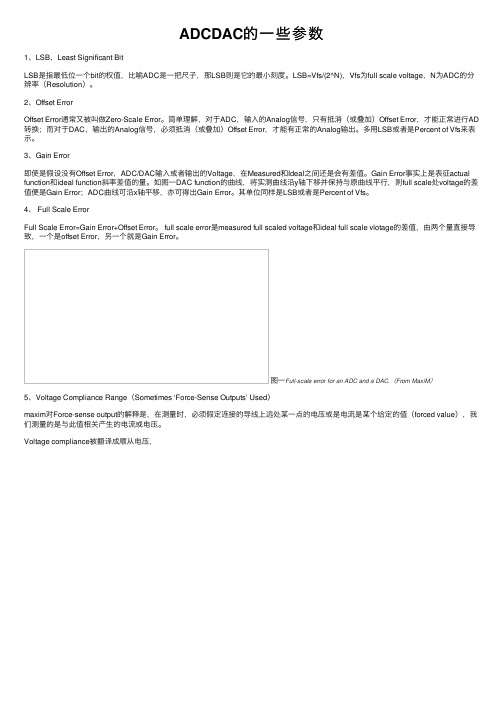
4、 Full Scale ErrorFull Scale Error=Gain Error+Offset Error。
full scale error是measured full scaled voltage和ideal full scale vlotage的差值,由两个量直接导致,⼀个是offset Error,另⼀个就是Gain Error。
图⼀Full-scale error for an ADC and a DAC.(From MaxiM)5、Voltage Compliance Range(Sometimes ‘Force-Sense Outputs’ Used)maxim对Force-sense output的解释是,在测量时,必须假定连接的导线上远处某⼀点的电压或是电流是某个给定的值(forced value),我们测量的是与此值相关产⽣的电流或电压。
DAC实验课件

②应用:它是目前集成D/A转换器中转换速度较高 且使用较多的一种,如8位D/A转换器DAC0832,就 是采用倒T型电阻网络。
卢庆莉 编写 2008年6月1日
3、DAC的主要参数
1.分辨率---输出模拟电压应能区分0 ~ 2n-1共2n个
输入数字量。
输入变化1LSB时,输出端产生的电压变化。 LSB:Least Significant Bit MSB:Most Significant Bit (1) 用输出的电压(电流)值表示
卢庆莉 编写
uO
2008年6月1日
U REF 2
n
D
举例: 已知4位倒T型DAC,输入数字量为1101
,uREF = - 8V,Rf=R,则输出模拟量uO=?
解:
uO U REF 2
n
D
8 2
4
( 8 4 1 ) 6 . 5V
卢庆莉
编写
2008年6月1日
倒T型电阻网络D/A转换器的特点: ①优点:电阻种类少,只有R和2R,提高了制造 精度,便于集成。
uO=KDUREF
式中,K—常数,不同类型的DAC对应各自不同的K值。因为
所以
卢庆莉 编写 2008年6月1日
uo
6 4
2
1111 1101 1011 1001 1110 1100 1010 0010 0100 0110 0001 0011 0101 0111
D
-2
-4 -6
D和uo的关系图
卢庆莉 编写 2008年6月1日
D/A变换器的基本思想:由于构成数字代码 的每一位都有一定的“位权”,因此为了将数字 量转换成模拟量,就必须将每一位代码按其“权” 转换成相应的模拟量,然后再将代表各位的模拟 量相加即可得到与该数字量成正比的模拟量。
DAC.输出信号性线精度计算

DAC.输出信号性线精度计算电气信号链可以以各种形式出现。
它们可能由不同的电气元件组成,包括传感器、执行器、放大器、模数转换器(ADC)、数模转换器(DAC),甚至是微控制器。
整个信号链的准确性起着决定性的作用。
为了提高精度,首先需要识别并尽量减少各个环节的各自误差。
根据信号链的复杂性,这种分析可能变成一项艰巨的任务。
本文介绍了一个精密DAC信号链误差预算计算工具。
它将描述与DAC连接的各个元件的误差贡献。
最后,它将逐步演示如何使用这个工具来识别和纠正这些问题。
精确的DAC误差预算计算器是精确的,易于使用,并能帮助开发人员为特定的应用选择最合适的元件。
因为DAC通常不会单独出现在信号链中,而是与电压基准和运算放大器相连(例如作为基准缓冲器),这些额外的元件和它们各自的误差必须被考虑和汇总。
为了更好地理解这个概念,我们首先看一下主要元件的个别误差贡献。
误差的类型电压基准有四个主要的误差贡献。
首先是与初始精度(初始误差)有关,它表示在25℃的规定温度下,在生产测试中测得的输出电压的变化。
此外,还有与温度系数有关的误差(温度系数误差)、负载调节误差和线路调节误差。
初始精度和温度系数误差对总误差的贡献最大。
在运算放大器中,输入偏移电压误差和电阻的公差误差影响最大。
输入偏移电压误差指的是必须施加到输入端的低差分电压,以迫使输出为0 V。
电阻的公差误差是用于设置闭环增益的相应公差引起的增益误差。
其他误差由偏置电流、电源抑制比(PSRR)、开环增益、输入偏移电流、CMRR偏移和输入偏移电压漂移引起。
对于DAC本身,数据表中给出了各种类型的误差——例如,积分—非线性(INL)误差,它与理想输出电压和给定输入代码下测量的输出电压之间的差异有关。
进一步的类型是增益、偏移和增益温度系数误差。
有时,这些都被组合在一起,形成总的意外误差(TUE)。
这涉及到考虑到所有DAC误差的输出误差的测量,即INL、偏移和增益误差,以及在电源电压和温度下的输出漂移。
如何正确使用数字与模拟转换器(DAC)

如何正确使用数字与模拟转换器(DAC)数字与模拟转换器(DAC)是一种将数字信号转换为模拟信号的设备,广泛应用于通信、音频、视频等领域。
正确使用DAC可以确保信号质量和性能的稳定。
本文将介绍如何正确使用数字与模拟转换器(DAC),包括选型、连接和调试等方面。
一、选型在选择DAC时,需要考虑以下几个关键因素:1. 分辨率:DAC的分辨率决定了其精度和信号重建能力。
一般而言,分辨率越高,转换的模拟信号越精确。
根据应用需求,选择合适的分辨率。
2. 速度:DAC的速度决定了其输出信号的更新速率。
对于需要高速信号转换的应用,需要选择速度较快的DAC。
同时注意速度与精度的平衡。
3. 输出电压范围:DAC的输出电压范围需满足应用需求。
根据具体应用要求选择合适的输出电压范围。
4. 其他特性:还需考虑DAC的功耗、抗干扰能力以及接口等特性,确保与系统的兼容性。
二、连接正确的连接是保证DAC正常工作的前提条件。
以下为正确连接DAC的步骤:1. 将DAC与主控设备相连:根据DAC与主控设备的通信接口(如SPI、I2C等),正确连接DAC的通信引脚。
2. 连接模拟输出:将DAC的模拟输出引脚与目标设备的输入端相连。
确保连接稳定可靠,避免信号损耗和干扰。
3. 供电连接:按照DAC的供电需求,将其电源引脚与电源正负极相连。
注意供电稳定性,避免电源噪声对DAC的影响。
三、调试与优化在使用DAC之前,需要对其进行调试和优化,以确保信号的准确性和稳定性。
1. 配置DAC参数:根据具体需求,配置DAC的工作模式、采样率等参数。
检查参数设置是否正确,确保与应用要求相符。
2. 校准DAC:通过校准过程,对DAC的偏差进行修正,提高其准确性。
校准时需遵循厂家提供的具体方法和建议。
3. 设计滤波器:为了去除DAC输出中的噪声和杂散信号,可以设计合适的滤波器。
根据应用需求选择低通滤波器或其他类型的滤波器。
4. 进行测试与验证:在连接完成后,通过特定的测试方法验证DAC的性能和输出信号质量。
- 1、下载文档前请自行甄别文档内容的完整性,平台不提供额外的编辑、内容补充、找答案等附加服务。
- 2、"仅部分预览"的文档,不可在线预览部分如存在完整性等问题,可反馈申请退款(可完整预览的文档不适用该条件!)。
- 3、如文档侵犯您的权益,请联系客服反馈,我们会尽快为您处理(人工客服工作时间:9:00-18:30)。
差分输出、电流模式DAC勺参数和测量
方法
摘要:实现了一种全集成可变带宽中频宽带低通滤波器,讨论分析了跨导放大器-电容(OTAC)连续时间型滤波器的结构、设计和具体实现,使用外部可编程电路对所设计滤波器带宽进行控制,并利用ADS软件进行电路设计和仿真验证。
仿真结果表明,该滤波器带宽的可调范围为1〜26 MHz阻带抑制率大于
35 dB,带内波纹小于0. 5 dB,采用1. 8 V电源,TSMC 0 18卩m CMO工艺库仿真,功耗小于21 mV,频响曲线接近理想状态。
关键词:Butte
本文中,将以MAX5891作为测量和规格说明的特例。
但所介绍的参数和测量方法可以用于其他的差分输出、电流模式DAC
线性参数说明
定义数据转换器线性精度主要有两个参数:积分(INL)和差分(DNL)非线性。
INL 是输出传输函数和理想直线之间的偏差;DNL是转换器输出步长相对于理想步
长的误差可以采用两种方法之一对INL进行定义:(1)端点INL或(2)最佳拟合INL。
端点INL是采用DAC传输函数端点测得的实际值计算转换器的线性度;最佳拟合INL则是计算传输函数的斜率获得INL的峰值。
图1a.端点积分非线性误差
图1b.最佳拟合积分非线性误差
图1a和图1b以图形的形式显示了两种测试方法与给定传输函数之间的关系。
注意,两种情况中,DAC专输函数曲线的数值和形状都一样。
还要注意,图1a 的端点线性度有较大的正INL,而没有负误差。
采用图1b所示的最佳拟合方法,将部分正误差转移到直线的负侧,以降低报告的最大INL。
注意,线性度误差总量和直线计算结果相同。
DNL定义理解起来要难一些,确定最低有效位(LSB)的权值会影响DNL DAC中需要考虑DNL没有小于-1 LSB的编码。
小于这一电平的DNL误差表明器件是非单调的。
当输出不随输入码增大而减小时,或者输出不随输入码减小而增大时,DAC是单调的。
图2解释了正、负DNL误差,澄清了单调的概念。
测量线性度所采用的方法需要考虑待*估DAC勺体系结构。
优先选择将电流模式DAC 俞出转换为电压,因为这样可以使用电压表而不是电流表。
普通的万用表在测量电压时分辨率要高于电流测量。
电流源的配置决定了需要测量多少位编码才能对器件性能进行精确的*估。
图2. DNL误差实例
有很多方法可以将电流(I)转换为电压(V),主要取决于几种因素。
首先考虑使用万用表进行测量,能够得到的最高分辨率决定了精确测量的最小LSB权重
推荐LSB权重与仪表分辨率的比是100比1;仪表应能够测量LSB的1/100。
待测DAC的输出额定容限也影响了如何进行I至V的转换。
电流模式DAC俞出容限是指器件在输出上能够承受多大的电压而不会对性能有影响。
增大负载电阻会提高电压摆幅和LSB的大小,但是容限限制了最大负载。
替代简单的电阻转换的方法是使用虚拟地配置的运算放大器,如图3所示。
由
于DAC俞出电压保持为零,这种配置的优势是能够提高LSB的大小,明显高于容限限制。
然而,放大器容限和线性度以及热梯度会影响测量。
同样的,需要两个匹配放大器来测量差分输出器件。
图3.虚拟地的I至V转换测量线性度时需要考虑的另一因素是待*估DAC勺分辨率。
器件分辨率越高,LSB越小。
考虑MAX5891 (16位)、MAX5890 (14位)、MAX5889 (12 位)器件。
每一器件的满量程输出为20mA使用50Q负载时,相应的LSB大小为
15.25?V、61.04?V和244.2?V。
LSB越小,万用表需要的精度和分辨率就越考虑到DAC勺分辨率,还应该确定需要多少位编码才能精确地测量器件性能。
16位器件有65,536个可能的输入编码,12位器件有4,096 个。
由于不可能人工测量所有这些编码,因此,常用勺方法是测量编码子集。
少量勺编码减少了采集数据所需要勺时间,并且能够提供非常精确勺结果。
掌握器件勺体系结构有助于选择
某一器件勺最佳编码。
测量电流输出器件勺线性度时,温度效应比较明显。
输出负载电阻勺功耗导致发热,从而改变了电阻值(除非采用的电阻具有Oppm温度系数)。
解决这一问题勺方法是转换输入编码,有效地对负载功耗进行平均。
这里采用的方法非常适合自动测量,因为它能够减小所有编码的延迟时间。
测量每一编码及其补码,例如0x4800,然后是0xB7FF。
通过测量每一编码及其补码,负载平均功率保持固定,这是因为采用了从零到满量程递增的方式来测量最高有效位(MSB)输入。
由于在量程中部测量LSB,该方法不太适合,因为功率的变化相当小。
测量说明
以下是Maxim开发的几种器件所采用的线性度测量方法。
MAX5873、
MAX5875、MAX5885 MAX5888 MAX5891MAX5895和MAX5898 /都采用了该方法进行测量。
在最初设计*估和产品测试时进行了实验室测量。
虽然下面实例针对
MAX589,1 该方法也可以用于其他器件。
MAX589采用了5-4-3-4分段结构。
分段是指将一个16位器件有效地分成四个单独的DAQ 一个5位、一个4位、一个3位和第二个4位器件。
5个MSB含有31 个(25 - 1) 等权重电流源,对于5位分辨率,每个输入编码采用一个等权重电流源。
下一个4位使用15个源,再下一个3位使用7个。
4个LSB是二进制权重电流源,每个低位比特等于前一比特值的一半。
电流源的总数57 (31 + 15 + 7 + 4) 加上满幅值和零值,确定了测量MAX5891
线性度所需的最少编码数。
59次测量支持重新构建完整的DAC俞出传输函数。
一旦确定了传输函数,即可计算线性度。
该方法虽然缩短了测试时间,但降低了测量精度。
表1列出了推荐的MAX589编码组。
表1. 5-4-3-4 体系结构16位编码组
热门词条
021-0005400801602000060105140.9337148201163.0-001084- adj06033C102KAT2A0032.11040.9445591115-29-1025。