Petrel2015建模培训2
petrel RE详细培训资料
纵向上zone分区-基于储量 可以选择怎么分
分区-基于PVT、相渗 计算同上,
纵向上zone分区-基于储量
纵向分区-基于PVT、相渗
平面分区-基于PVT、相渗
多边形多个分区
例如做3个分区
名字要唯一
怎么设置显示井的方式(井很长,显示不一样)
怎么设置显示井的方式(井很长,显示不一样)
打开文件夹,找到主文件 (data)
去文件目录下找到这个文件, 并进行修改
就是这个 文件
编写椭圆里的信息,可调用这个文件,并 且要把mult这个文件拷到主文件夹下。
以上做完之后,可重新define一个case, 然后运行模拟,去比较结果。
三、如何修改断层传导系数
可以对每个断层的传导系数进行修改,0.5 是半封闭,1是不封闭,0是完全封闭
2、导入EV文件
匹配好井名
2、导入EV文件
对时间的设置一 定要改成一致
2、导入EV文件
上下都要勾上才 能显示
3、自动方式设计完井
里导入射孔文件
这个时间是创建井的时间
套管
创建一个简 单完井事件
五、如何导入井的历史数据
五、如何导入井的历史数据
五、如何导入井的历史数据 名字要匹配
五、如何导入井的历史数据
网格的趋势线方向 ,一般参考主断层 的方向
第一步:平面网格的粗化
粗化到的模型,现 在只有平面的网格
第二步:纵向网格的粗化
输出的粗化模型 原始模型
可以把zone减少,比方说3个搞成 2个,但是注意zone1的底深和 zone2的顶深要一致
第二步:纵向网格的粗化
layering也可以粗化
第二步:纵向网格的粗化
一、粗化地质模型(respect,grid,edit); 二、高压物性、相渗(props); 三、初始化(solution); 四、分区(regions); 五、输出控制(summary); 六、观测数据(schedule)。
Petrel入门培训-断层建模Pillar网格化
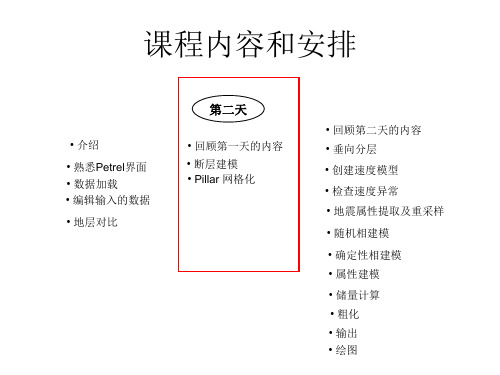
• 介绍
• 熟悉Petrel界面 • 数据加载 • 编辑输入的数据
• 地层对比
第二天
• 回顾第一天的内容 • 断层建模 • Pillar 网格化
• 回顾第二天的内容 • 垂向分层 • 创建速度模型 • 检查速度异常 • 地震属性提取及重采样
• 随机相建模 • 确定性相建模 • 属性建模 • 储量计算 • 粗化 • 输出 • 绘图
• 从上边的讨论可以看出:在Petrel里断层模型是输入的原始断层数据 的近似,但是永远不使用原始断层数据来创建模型。 事实上, 是使
用Key Pillars (原始数据的近似)在最终的3D网格中创建断层面。只 要Key Pillars能够表示原始数据的实际形状,这样做就基本上没有
什么问题。 这样做的好处是,当同一个断层有两套原始数据,而且 这两套数据又互相矛盾时,这些矛盾不会反映到最终的断层模型中去。
在每一个网格角处都会创建一个Pillar 。
Pillar Gridding
边界: 多边形Polygon, 边界段或者 边界的一部分。
趋势Trends: 指导网格化,并用作segment divider段块的分界线。
断层和方向: 指导网格化,可以设为没有断层 ,没有边界。
段块SegБайду номын сангаасents: 被断层或趋势线所封闭的区域
选择一个 形状点 shape point
选择整个 Key Pillar
在末端增加新Key Pillar 在两个Pillar之间增加新
key pillar
Fault Modeling
连接两个断层 断开两个断层
断层连接
Fault Modeling
调整形状点 shape points
Petrel三维地质建模ppt课件
C B 2 5 B -1 C B 2 5A -7 C B 2 5 A -5
C B 2 5 D -5
C B 2 5 B - C6 B 2 5 B - 3 C B 2 5 A - 8 C B 2 5 D - 1
C B 2 5 B -2 C B 2 5 A -9
C B 2 5 D -2
C B 1 1F -5
依照对断裂系统的认识及目的
层段的深度,过滤组合得到目的层
位的断片系统,并可将其还原为断层
解释数据。
精选PPT课件
15
解释结果验证
断层自动解释技术
埕岛油田馆上(1+2)3小层平面图
油水界面 -1253
油水界面 -1275
通过对蚂蚁追踪流程的改进,有效的验证了低级序断层的
存在,对原有的假设进行了验证,理顺了油水关系,在实际
埕岛油田Nm底构造图
精选PPT课件
27
构造精细建模技术
砂体空间归位技术 断层自动解释技术 三维空间精细调整技术 地震层面精细修正技术 小层层面修正技术
C B 25 1 B -4
C B 2 5 1 A -1
C B 25 1 B -2
C B 2 5 1 B -3
Ng5 457 C B 2 5 1 C -4
C B 2 5 1 C -3
不同 井组
456
403
384
367
7
砂体空间归位技术
CB271A、27A井组轨迹正视图 埕岛油田Ng(1+2)3小层平面图
精选PPT课件
10
断层自动解释技术
问题2:传统的手工断层解释限于地震分辨率在低级序断层的解释上 效果不好?
路 传 统 思
方差体
PETREL软件简介

3/12/2015
9
PETREL 软件介绍之一 界面介绍
第一部分 界面介绍
Petrel的启动界面如下图所示:
3/12/2015
10
PETREL 软件介绍之一 界面介绍
第一部分 界面介绍
Petrel 用户界面工具栏介绍 Title bar (标题栏)- 文件名(工区名)和所在路径显示于标题栏。 通过按住和托拽标题栏来在桌面上移动Petrel窗口。 Menu bar (菜单栏) – (顶部)点击菜单栏上任何一个标题都展开 一个对话框、弹出菜单、命令和特征的列表。 Toolbar (工具栏)- (顶部)常用命令工具。这些工具是非常有用 的项目的链接,用户也可以在菜单栏里面找到。 Function bar (功能栏) - (右侧)流程特定功能。这些工具会因 为选择了不同的流程单元而改变。注意一共有两个功能栏,一个在右 手边,一个实在显示窗口的下边。 Petrel Explorer (Petrel浏览器) – (左侧)用于优化各种模型 关联数据的文件管理器。包括四个栏目,Input(输入,输入数据管 理)、Models(模型,创建的模型)、Results(结果,一些例如体 积计算等的结果)和Templates(模版,用于显示数据的颜色、标尺 等)。
建模基本流程
Structural Modeling
Define Model 给你要建的模型一个名字。. Fault Modeling 此模块是让用户构造化和几何学化创建正确断层表述。断层通过Key Pillar创建。Key Pillar就是通过一个或者五个称为定型点(Shape Points)确定的一个垂直、直线、折线或者曲线型的线。两个定型点可 以确定垂直线或者直线,三个可以确定折线,五个确定曲线。若干Key Pillar通过定型点的连线确定一个断层面。 Pillar Gridding 创建构造模型的步骤叫做Pillar Gridding。Pillar Gridding是 Petrel里面的独特概念,用于把断层模型中的断层作为基础产生一个三 维网格。一些选项用于定制三维网格适应于地质建模或者流体模拟需要。
petrel软件详细教程ppt课件

单井纵向排列,保存为一个文件,文件名为 well top . prn
精品课件
23
其它数据
断点深度 2334 2116.2 2699.4 1342.5 1394.8 1553.1 2155.4 1865.4
Fault point
属性 horizon horizon horizon horizon horizon horizon horizon horizon
Petrel 基本操作讲解
山东省油气勘探开发工程技术研究中心
精品课件
1
提纲
一、Petrel软件介绍及基本功能 二、前期数据整理介绍
三、建模基本操作流程
精品课件
2
软件介绍及基本功能
精品课件
3
软件介绍及基本功能
▪ 强大的 3D 可视化工具 ▪ 地层对比 ▪ 地震解释 ▪ 2D网格化 ▪ 高级断层建模 ▪ 创建3D断层网格 ▪ 3D岩相和岩石物理属性建模 ▪ 3D井位设计 ▪ 数据分析,体积计算,绘图和生成报告 ▪ 断层属性分析和流体界面模拟 ▪ 模拟数据的后期处理
数据格式
精品课件
30
格
式
Ok
对
应
Ok for all
精品课件
31
点击显示
精品课件
32导入分层文件夹来自精品课件33ok
选择文件
格式(默认)
精品课件
34
格式选取
Ok for all
精品课件
35
点击显示
精品课件
36
ok 导入断点文件
选择文件 格式(默认)
精品课件
与分层数据导入 方法格式一样
37
精品课件
4
连井剖面地层对比
Petrel2015建模培训1
2.Select Add new object and select Index track. 3.Specify the depth scale measurement.
3
Note: To edit the current Depth scale panel, go to the Style tab of the Well section template settings and specify here.
2. Use from an existing template
1. 数据显示及模板
1.1 井显示----添加井方式之二
Go to the Window drop-down menu and insert a New well section window. You can choose from::
1
2
1. 数据显示及模板
1.2 测井曲线显示
1. 数据显示及模板
1.3 地质分层显示
1. 数据显示及模板
1.4 连井剖面显示设置
1. Define the well position synchronization: • No synchronization • Scroll relative- synchronizing all wells • Flatten on different reference points
2. 相解释
2.1 沉积相交互解释 2.2 岩相交互解释 2.3 岩相计算(截止值方法)
2.4 岩相计算(神经网络方法)
1. 数据显示及模板
1.1 井显示----添加井方式之一
StratigraphyX-section editing
Petrel培训教材(经典)
Petrel软件实例操作流程目录第一章Petrel简介一、安装并启动Petrel (01)二、界面介绍 (02)第二章Petrel处理流程介绍一、数据准备 (07)二、断层建模 (14)三、Pillar Gridding (22)四、Make H orizon (27)五、深度转换(可选步骤) (32)六、Layer ing (34)七、建立几何建模 (35)八、数据分析 (36)九、相建模 (42)十、属性建模 (51)十一、体积计算 (60)十二、绘图 (64)十三、井轨迹设计 (66)十四、油藏数值模拟的数据输入和输出 (69)第一章Petrel简介一、安装并启动Petrel把安装盘放入光驱,运行Setup.exe程序,根据提示就可以顺利完成安装,在安装的过程中同时安装DONGLE的驱动程序,安装的过程中不要把DONGLE插入USB插槽,安装完毕,再插入DONGLE,如果LICENSE过期,请和我们技术支持联系。
然后按下面的顺序打开软件。
1. 双击桌面上的Petrel图标启动Petrel。
2. 如果是第一次运行Petrel,在执行Petrel运行前会出现一个Petrel的介绍窗口。
3. 打开Gullfaks_Demo项目。
点击文件>打开项目,从项目目录中选择Gullfaks_2002SE.pet。
二、界面介绍(一)、菜单条/ 工具条与大多数PC软件一样,Petrel软件菜单条有标准的“文件”、“编辑”、“视图”、View等下拉菜单,以及一些用于打开、保存project的标准工具,在菜单条下面的工具条里还有更多工具。
在Petrel里,工具条还包含显示工具。
此外在第二个工具条里还有位于Petrel 项目窗口的右端的按钮,它具有附加的Petrel相关的功能。
后面的工具条称为功能条,这些工具是否有效取决于选择进程表中的哪个进程。
操作步骤1.点击上面工具条中的每一项看会出现什么。
你可以实践一些更感兴趣的选项。
《Petrel培训》PPT课件

19
2021/6/10
用z值标识分层数据
20
创建分层模式
• Zone改名
Es2-1
es2
Es2-2
Es2-3-1
Es2-3
Es2-3-2
Es2-3-3
2021/6/10
21
剖面对比
• 建立连井剖面图 • 充填\设置比例\层拉平 • 创建和编辑分层 • 测井曲线合并道 • 新建曲线
2021/6/10
57
提取属性数据
2021/6/10
58
2021/6/10
59
2021/6/10
60
2021/6/10
61
2021/6/10
62
2021/6/10
63
2021/6/10
64
2021/6/10
65
2021/6/10
66
地层与断层的解释
2021/6/10
67
速度
2021/6/10
68
X47-44
F_east
X79
F_east
Horizon
2045 2258.8 2199.4
2036 2036 2082.2
Horizon 2538.4
2699.2 2702.5
2121 2128 2134
2158 2177 2225
Horizon Horizon Horizon Horizon Horizon Horizon
31
设置该曲线的顶底深度
2021/6/10
32
对该曲线重采样
2021/6/10
33
打开计算器
2021/6/10
34
计算新曲线
- 1、下载文档前请自行甄别文档内容的完整性,平台不提供额外的编辑、内容补充、找答案等附加服务。
- 2、"仅部分预览"的文档,不可在线预览部分如存在完整性等问题,可反馈申请退款(可完整预览的文档不适用该条件!)。
- 3、如文档侵犯您的权益,请联系客服反馈,我们会尽快为您处理(人工客服工作时间:9:00-18:30)。
1.基本概念
测井曲线分布概率与粗化平均方法选择
孔隙度:Arithmetic
岩相:Most of
渗透率:Hormonic Geometry
1.基本概念
Biasing to a Discrete Log
Upscaled facies Raw facies Raw porosity Upscaled porosity
Demo & Exercise
4.Structural Gridding
From Structural Framework to a fully populated property model at any grid cell resolution in just a few clicks!
Fully stair-stepped grid matching the Structural Framework faults and horizons
Cells exist along the well path.
Values assigned to cells based on well log values along the well path.
Upscaled logs used to fill in the 3D grid.
NOTE: An upscaled property will have a [U] following its name in the Property folder in the Models pane.
Input
Output
Structural framework grid
Fault Model
Pillar Gridding
Make Horizons
五、测井曲线粗化
1.基本概念 2.测井曲线粗化过程 3.测井曲线粗化质量控制
1.基本概念
Overview
The Scale up well logs process averages the values to the cells in the 3D grid that are penetrated by the wells. Each cell gets one value per upscaled log. These cells are later used as a starting point for Property modeling.
Structural Gridding
4. Structural Gridding ---- Process
Optional AOI: enables grid creation on a sub-set of the Structural Framework Grid geometry settings
Lognormal Distribution
12 10
Frequency
1,00 0,80 0,60 0,40 0,20 0,00 5 7 9 11 13 15 17 19 21 23 25 27 More Classes LNV
Geometric mean
8 6 4 2 0
Gamma Distribution
地层划分与对比 合成地震记录
构造 解释
N 岩相解释
地层格架垂向网格化
测井曲线粗化
Y 数据分析
储量计算 模型粗化 油藏数模模型 历史拟合 储量吻合 Y Y 井历史生 产数据吻合 N
Y Y
预测模拟
经济评价
输出断层模型到角点网格模型
This process alows the user to create a geocellular grid which can be later populated with properties
1.基本概念
测井曲线分布概率与粗化平均方法选择
Normal Distribution (bimodal)
10
Frequency
1,00 0,80 0,60 0,40 0,20 0,00 5 6 7 8 9 10 11 12 13 14 15 16 More Classes NV
8 6 4 2 0
Arithmetic mean Sandstone porosity is typically normal distributed
Geometric mean Median RMS (Root Mean Squared)
Minimun/Maximum Samples the min/max value of the well log for the cell. Mid Point Pick Random Pick Will pick the log value where the well is halfway through the cell. Picks a log point at random from anywhere within the cell.
14 12 10 8 6 4 2 0 5 10 15 20 25 30 35 40 45 50 55 60 More Classes Gam m a
Frequency
1,00 0,80 0,60 0,40 0,20 0,00
Harmonic mean Shale permeability is typically gamma distributed
3.1 输入层面、地质分层、定义地层接触关系
3. The framework fault model is stored under the active model in the Models pane. 4. Run the Horizon modeling process located under the Processes pane > Structural framework.
Excellent geometry even along the faults Allows more complex modeling Modeling or reservoir engineering view- flexibility &deeper integration
Structural Framework
5. Drop in number of rows equal to the amount of horizon input. Use, e.g., surfaces stored in the Input pane as input. Set horizon types and click OK. Results are stored under the Horizons folder under the active model.
2. Fault framework modeling
2.1 添加断层到断层格架模型
2. Fault framework modeling
2.2 确定断层间关系
2. Fault framework modeling
2.3 断层参数设置
Demo & Exercise
3. Horizon modeling
1.基本概念
AveragiLeabharlann g Methods for Continuous Logs
Averaging method Description
Arithmetic mean Harmonic mean
Typically used for additive properties such as porosity, saturation and net/gross. Gives the effective vertical permeability if the reservoir is layered with constant permeability in each layer. It works well with log normal distributions. It is sensitive to lower values. Normally a good estimate for permeability if it has no spatial correlation and is log normally distributed. It is sensitive to lower values. Will sort the input values and select the center value. Will provide a strong bias towards high values.
3. Horizon modeling
3.2 断层过滤参数设置
3. Horizon modeling
3.3 应用地质规则并生成Zone
QC the Horizons in the display window, if satisfied, continue building the zones through the Horizon modeling process.
Minimun/Maximum
Mid Point Pick Random Pick
Samples the min/max value of the well log for the cell.
Will pick the log value where the well is halfway through the cell. Picks a log point at random from anywhere within the cell.
Sand
Shale
1.基本概念 Treat Log as lines or points
Treat log