English-by-the-Numbers
Unit4+教案 牛津上海版八年级英语上册

牛津上海版英语八年级第一学期unit4教案Material: Oxford English 8A Unit 4 NumbersLesson type:Reading: Numbers: Everyone’s language (1)Class: Class 1 and Class 2, Grade 8Teaching objectives:By the end of the class, the students are expected to1. 通过文本阅读,理解部分核心词汇的含义及用法,知道部分拓展词汇的含义;能够使用恰当的词汇来描述数字这一国际语言;2. 通过阅读活动,获取有关数字的基本信息并归纳文章主旨大意。
Focus on learning:通过文本阅读,理解部分核心词汇的含义及用法,知道部分拓展词汇的含义;能够使用恰当的词汇来描述数字这一国际语言;Potential difficulties in learning:通过阅读活动,获取有关数字的基本信息并归纳文章主旨大意。
Stages Learning activities PurposesLead in 1. What do we call them?2. Think about what these numbers stand for.To set up a situation and predictwhat to read.Pre-reading 1. Read and answer the questions.What is the title?What can we know from the title?What will the write probably talk about in the text?While- reading 1. Read through the subheadings, pictures and thelast paragraph. Answer the questions.What is the passage about?How many parts are there in the passage?2. Read “ancient numbers”. Tell the meanings ofthe pictures.3. Read “zero”. Find the answers to thesequestions.What does this part tell about zero?What is the system of numbers most peopleuse today?Who played an important role in creating the1-9 system?4. Read “calculating machines”. List thecalculating machines and their advantages.5. Read “brain against computer”. Complete thetable.To help students read for thegeneral idea and detailedinformation.Post- reading 1. Read the following questions and think.Which has been answered in the article?Which hasn’t been answered?To help students furtherunderstand the text.Which can be inferred from the article?Are all the answers questions closely related to the title “numbers: everyone’s language’? Explain your reason.AssignmentsCopy the new words and phrases you learnedin today's lesson. Then read them aloud after therecording.Think and answer the second question inTask 3 on your worksheet.Complete Exercises C (CI, C2, C3) and D(DI, D2) on pages 58 and 59, Student's Book.Read the passage aloud after the recordingthree times.To consolidate what is learnt inclass.Material: Oxford English 8A Unit 4 NumbersLesson type:Reading: Numbers: Everyone’s language (2)Class: Class 1 and Class 2, Grade 8Teaching objectives:By the end of the class, the students are expected to1. 通过阅读,了解说明文的文体特征,判断文章说明对象,辨别作者所使用的说明方法;2. 在阅读中,识别段落主题句,判断作者使用的细节支撑类型; 进一步探讨各段落与标题的匹配度,完善主题信息。
1到65的英语单词
1到65的英语单词In this article, we will explore the English words associated with the numbers 1 to 65. By examining this rangeof vocabulary, we can gain insights into the diversity of the English language and its various uses. Let's proceed step-by-step:1. One - a simple word that often stands alone, representing singularity or uniqueness. It also serves as an adjective, as in "one apple" or "one book."2. Two - a word that indicates a pair or a binary relationship. E.g., "two hands" or "two sides."3. Three - a word that highlights the trinity or thetrio. E.g., "three musketeers" or "three little pigs."4. Four - a word that can connote stability (e.g., four legs on a table) or even bad luck in some cultures.5. Five - a digit that, when combined with a cent,yields a nickel in US currency. It also appears in the phrase "high five" to celebrate a successful effort or achievement.6. Six - a number that indicates halfway to a dozen, but also is used in references to devilish or sinister things.7. Seven - a number that's often considered lucky, with many cultural references in fairy tales, myths, and religions.E.g., seven dwarfs, seven deadly sins, seven wonders of the world.8. Eight - a number that represents symmetry or infinity when reflected horizontally. It's also commonly associatedwith a sound or musical octave.9. Nine - a digit that starts to transition from singleto double digits, often appearing in countdowns or other sequences. It's also a homophone for "nein," the German word for "no."10. Ten - a convenient round number that serves as a basis for metric and counting systems. It's also a base number used in the decimal system.11. Eleven - a compound word made of "ten" and "one," indicating that it's just one more than ten.12. Twelve - similar to eleven but can be expressed as 2*6 or 3*4, making it useful in various applications, such as telling time or measurements.13. Thirteen - a compound word of "three" and "ten" that has carried superstition and folklore since ancient times.14. Fourteen - a straightforward compound word of "four" and "ten."15. Fifteen - a word that's rather simple and easy to spell, commonly associated with age restrictions or driver's permits in many states.16. Sixteen - a number that has connections to sweet sixteen celebrations, youthful rites of passage.17. Seventeen - a number that denotes the last of the teen years and is often celebrated as a crucial stage of development.18. Eighteen - a legal threshold for adulthood in many countries, marking the end of teenage years and the beginning of responsibilities.19. Nineteen - the last number of the teen digits, symbolizing the dawn of maturity and independence.20. Twenty - a rounded and straightforward number that refers to the gamut of possibilities or a scorecard in some gaming systems.21. Twenty-one - another compound word, indicating something that's just one more than twenty.22. Twenty-two - a number with symmetry and balance with the same digit repeated twice.23. Twenty-three - famous for its mention in the movie "The Number 23," starring Jim Carrey.24. Twenty-four - again, two of the same digit, usually expressed as a product of 2*12, 3*8, or 4*6.25. Twenty-five - a quarter of a century and half of fifty, representing milestones in time and age.26. Twenty-six - marking several sporting numbers, such as the number of letters in the English alphabet or the number of miles in a marathon.27. Twenty-seven - used in references to a trio of nine or a product of 3*3*3.28. Twenty-eight - a product of 4*7 or two 14s, used in various mathematical equations or visual arts.29. Twenty-nine - often referenced in suspense or thrillers, such as the 29th floor of a building or 29th birthday celebrations.30. Thirty - marking the end of the twenties, it represents a new stage of life and the midpoint between one's youth and old age.31. Thirty-one - one more than thirty, often appearing in countdowns or astrology symbols.32. Thirty-two - written as 4*8 or eight squared, it has special significance in some cultures.33. Thirty-three - considered a master number in numerology or sacred geometry, representing creativity and spiritual awakening.34. Thirty-four - a simple combination of 30 and 4,without any special cultural or symbolic significance.35. Thirty-five - associated with grace or agility in sporting events, such as diving or gymnastics.36. Thirty-six - has various properties and multiples, such as a product of 2*2*3*3 or expressed as 6 squared, reflecting symmetry and geometric principles.37. Thirty-seven - a prime number with no factors except for itself and one, often showing up in obscure math problems or puzzles.38. Thirty-eight - marking the end of the thirties and representing new opportunities in life.39. Thirty-nine - often appears in literature or films, such as the book "The Thirty-Nine Steps" or the movie "39 Steps."40. Forty - a significant number in many cultures, representing completeness or duration, such as the forty days of Lent or the forty years of wandering in the Bible.41. Forty-one - simply one more than forty, often used in countdowns or sporting events.42. Forty-two - celebrated in science fiction or popular culture as the answer to the question of life, the universe, and everything in Douglas Adams' "The Hitchhiker's Guide to the Galaxy."43. Forty-three - has no special symbolic or cultural significance, but is a prime number.44. Forty-four - a symmetrical combination of two 22s, reflecting balance and harmony.45. Forty-five - a composite number created by multiplying 5 and 9, which often appears in age milestones or references to presidential administrations.46. Forty-six - nothing much stands out about thisnumber, except that it follows forty-five and precedes forty-seven.47. Forty-seven - a prime number with no factors besides itself and the number one, often appearing in numerical puzzles.48. Forty-eight - a product of 2*2*2*2*3, used in various calculations or visual arts.49. Forty-nine - celebrated in the poem "In the Bleak Midwinter" and commonly associated with the highest number in lottery systems.50. Fifty - marking a half-century of time or age, often considered a turning point or state of reflection.51. Fifty-one - indicating one more than fifty, often used in counting sequences or in administrative districts.52. Fifty-two - often celebrated in playing cards or license plates, representing the complete number of weeks ina year.53. Fifty-three - a prime number that often shows up in mathematical equations or numerical patterns.54. Fifty-four - expressed as a product of 2*3*3*3, representing symmetry and versatility.55. Fifty-five - often celebrated as a milestone age or anniversary, reflecting a halfway point or a turning point in life.56. Fifty-six - a number with no particular cultural or symbolic significance, but used in various applications such as numbering systems or coordinates.57. Fifty-seven - considered a lucky number in some cultures, representing spiritual awakening or mastery.58. Fifty-eight - marking a transition between thefifties and the sixties, symbolizing growth, renewal, andprogress.59. Fifty-nine - the last number before sixty, representing the end of one era and the beginning of another.60. Sixty - a significant number in measuring time, often used to indicate a complete round of something or a milestone in life.61. Sixty-one - just one more than sixty, often appearing in countdowns or as a street address.62. Sixty-two - a straightforward number without any particular cultural or symbolic significance, often used in recordings or counting systems.63. Sixty-three - a product of 3*3*7, representing balance and spiritual alignment.64. Sixty-four - often associated with computer or bit systems, reflecting a binary code of 2*2*2*2*2 or 2 to the power of six.65. Sixty-five - symbolizing a quarter of a century, often appearing in anniversary celebrations or career milestones.In conclusion, the range of English words associated with the numbers 1 to 65 are diverse, ranging from simple digits to more complex compound words. While some numbers carry cultural or symbolic significance, others are more straightforward and have practical uses in various applications. By exploring this range of vocabulary, we can appreciate the richness and versatility of the English language and how numbers play an important role in our everyday lives.。
韦博国际英语课程说明
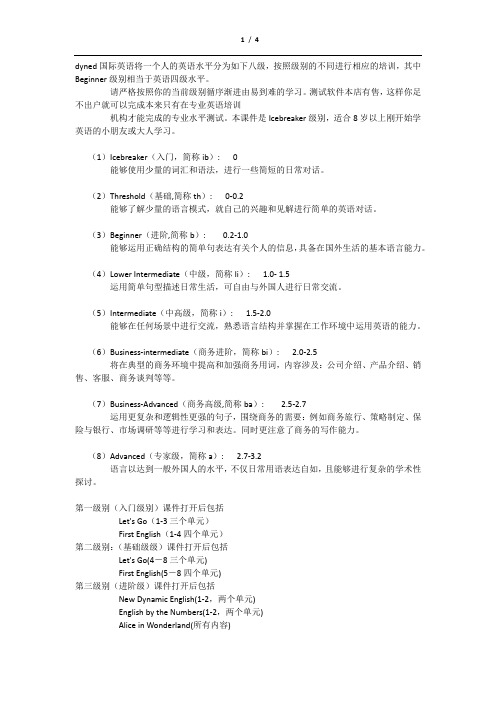
dyned国际英语将一个人的英语水平分为如下八级,按照级别的不同进行相应的培训,其中Beginner级别相当于英语四级水平。
请严格按照你的当前级别循序渐进由易到难的学习。
测试软件本店有售,这样你足不出户就可以完成本来只有在专业英语培训机构才能完成的专业水平测试。
本课件是Icebreaker级别,适合8岁以上刚开始学英语的小朋友或大人学习。
(1)Icebreaker(入门,简称ib): 0能够使用少量的词汇和语法,进行一些简短的日常对话。
(2)Threshold(基础,简称th): 0-0.2能够了解少量的语言模式,就自己的兴趣和见解进行简单的英语对话。
(3)Beginner(进阶,简称b): 0.2-1.0能够运用正确结构的简单句表达有关个人的信息,具备在国外生活的基本语言能力。
(4)Lower Intermediate(中级,简称li): 1.0- 1.5运用简单句型描述日常生活,可自由与外国人进行日常交流。
(5)Intermediate(中高级,简称i): 1.5-2.0能够在任何场景中进行交流,熟悉语言结构并掌握在工作环境中运用英语的能力。
(6)Business-intermediate(商务进阶,简称bi): 2.0-2.5将在典型的商务环境中提高和加强商务用词,内容涉及:公司介绍、产品介绍、销售、客服、商务谈判等等。
(7)Business-Advanced(商务高级,简称ba): 2.5-2.7运用更复杂和逻辑性更强的句子,围绕商务的需要:例如商务旅行、策略制定、保险与银行、市场调研等等进行学习和表达。
同时更注意了商务的写作能力。
(8)Advanced(专家级,简称a): 2.7-3.2语言以达到一般外国人的水平,不仅日常用语表达自如,且能够进行复杂的学术性探讨。
第一级别(入门级别)课件打开后包括Let's Go(1-3三个单元)First English(1-4四个单元)第二级别:(基础级级)课件打开后包括Let's Go(4-8三个单元)First English(5-8四个单元)第三级别(进阶级)课件打开后包括New Dynamic English(1-2,两个单元)English by the Numbers(1-2,两个单元)Alice in Wonderland(所有内容)Clear Speech Works(所有内容)The Lost Secret(1,两个单元)第四级别(中级级别)课件打开后包括New Dynamic English(3-4,两个单元)English by the Numbers(1-3,三个单元)Clear Speech Works(所有内容)Round the world in 80 Days(所有单元)The Lost Secret(1-2,两个单元)第五级别(中高级级别)课件打开后包括New Dynamic English(Module 5&6)English by the Numbers(Unit 1-3)Clear Speech Works(all)Robin Hood(all)The Lost Secret(all)第六级别(商务进阶级别)课件打开后包括Dynamic Business English(Disc 1-4)Functioning in Business(Disc 1&2)English by the Numbers(Unit 1-3)Clear Speech Works(all)第七级别(商务高级)课件打开后包括Dynamic Business English(Disc 5&6) Functioning in Business(Disc 3&4)English by the Numbers(all)Clear Speech Works(all)Test Mountain第八级别(专家级)课件打开后包括New Dynamic English(Module 7&8)English by the Numbers(all)Advancde Listening(all)Clear Speech Works(all)Hospitality English(all)A Christmas Carol(all)Test MountainIceBreaker:入门Let’s Go(Level 1-3)First English(Unit 1-4)Threshold:基础Let’s Go(Level 4-6)First English(Unit 5-8)Beginner:进阶New Dynamic English(Module 1&2)English by the Numbers(Unit 1&2)Alice in Wonderland(all)Clear Speech Works(all)The Lost Secret(Disc 1)Lower Intermediate:中级New Dynamic English(Module 3&4)English by the Numbers(Unit 1-3)Clear Speech Works(all)Round the world in 80 Days(all)The Lost Secret(Disc 1&2)Intermediate:中高级New Dynamic English(Module 5&6)English by the Numbers(Unit 1-3)Clear Speech Works(all)Robin Hood(all)The Lost Secret(all)Business Intermediate:商务进阶Dynamic Business English(Disc 1-4)Functioning in Business(Disc 1&2)English by the Numbers(Unit 1-3)Clear Speech Works(all)Business Advancde:商务高级Dynamic Business English(Disc 5&6)Functioning in Business(Disc 3&4)English by the Numbers(all)Clear Speech Works(all)Test MountainAdvanced:专家级New Dynamic English(Module 7&8)English by the Numbers(all)Advancde Listening(all)Clear Speech Works(all)Test Mountain(all)A Christmas Carol(all) 免费赠送的课程Hospitality English(all) 免费赠送的课程English for success(all) 免费赠送的课程Ice Breaker(入门),Threshold(基础),Beginner(进阶),Lower Intermediate (中级),Intermediate (中高级),Business Intermediate (商务进阶),Advanced (专家级)第一级别(入门级别)课件打开后包括Let's Go(1-3三个单元)First English(1-4四个单元)第二级别:(基础级级)课件打开后包括Let's Go(4-8三个单元)First English(5-8四个单元)第三级别(进阶级)课件打开后包括New Dynamic English(1-2,两个单元)English by the Numbers(1-2,两个单元)Alice in Wonderland(所有内容)Clear Speech Works(所有内容)The Lost Secret(1,两个单元)第四级别(中级级别)课件打开后包括New Dynamic English(3-4,两个单元)English by the Numbers(1-3,三个单元)Clear Speech Works(所有内容)Round the world in 80 Days(所有单元)The Lost Secret(1-2,两个单元)第五级别(中高级级别)课件打开后包括New Dynamic English(Module 5&6)English by the Numbers(Unit 1-3)Clear Speech Works(all)Robin Hood(all)The Lost Secret(all)第六级别(商务进阶级别)课件打开后包括Dynamic Business English(Disc 1-4)Functioning in Business(Disc 1&2)English by the Numbers(Unit 1-3)Clear Speech Works(all)第七级别(商务高级)课件打开后包括Dynamic Business English(Disc 5&6) Functioning in Business(Disc 3&4)English by the Numbers(all)Clear Speech Works(all)Test Mountain第八级别(专家级)课件打开后包括New Dynamic English(Module 7&8)English by the Numbers(all)Advancde Listening(all)Clear Speech Works(all)Hospitality English(all)A Christmas Carol(all)Test Mountain。
数字一到12的英文单词
数字一到12的英文单词One: The number one is represented by the word "one" in English. It is the smallest positive integer and the only natural number that is neither prime nor composite. One is often used to represent the beginning or the first in a series.Two: The number two is represented by the word "two" in English. It is the smallest prime number and the only even prime number. Two is often used to represent a pair or a couple.Three: The number three is represented by the word "three" in English. It is the smallest odd prime number. Three is often used to represent a group or a set of three.Four: The number four is represented by the word "four" in English. It is the second smallest composite number and the first square number. Four is often used to represent a group or a set of four.Five: The number five is represented by the word "five" in English. It is the smallest prime number that is greater than three. Five is often used to represent a group or a set of five.Six: The number six is represented by the word "six" in English. It is the first perfect number and the smallest composite number that is the sum of two prime numbers. Six is often used to represent a group or a set of six.Seven: The number seven is represented by the word "seven" in English. It is the smallest prime number that is greater than five. Seven is often used to represent a group or a set of seven.Eight: The number eight is represented by the word "eight" in English. It is the smallest composite numberthat is the sum of three prime numbers. Eight is often used to represent a group or a set of eight.Nine: The number nine is represented by the word "nine"in English. It is the largest single-digit number. Nine is often used to represent a group or a set of nine.Ten: The number ten is represented by the word "ten" in English. It is the smallest composite number that is the sum of four prime numbers. Ten is often used to represent a group or a set of ten.Eleven: The number eleven is represented by the word "eleven" in English. It is the smallest prime number thatis greater than nine. Eleven is often used to represent a group or a set of eleven.Twelve: The number twelve is represented by the word "twelve" in English. It is the smallest composite number that is the sum of five prime numbers. Twelve is often used to represent a group or a set of twelve.。
1到10的英语教案
1到10的英语教案Title: Teaching English Numbers 1-10Level: BeginnerObjective: By the end of the lesson, students will be able to recognize, say and write numbers 1-10 in English.Introduction (15 minutes)1. Warm-up activity: Greet the students and engage them in a conversation about numbers. Ask questions like: "What is your favorite number?" "Can you count from 1 to 10?" "Why do we need to know numbers?" Encourage students to respond and share their thoughts.2. Display flashcards of numbers 1-10 on the board or use a PowerPoint presentation. Ask students to identify each number and practice saying them together as a class.Presentation (20 minutes)1. Introduce each number individually, starting with number 1. Use visuals such as pictures or flashcards to help students associate the written number with its pronunciation.- Ask students to practice saying the number 1 and the word "apple" in unison.- Repeat the process for numbers 2-10, using different visuals for each number (e.g., two bananas, three balls, etc.).1. Hand out worksheets with various activities to practice numbers 1-10. Some suggested activities are:- Fill in the missing numbers on a number line or grid.- Match the number with the correct number of objects (e.g., draw a line connecting the number 3 to three pictures of dogs).- Count and write the number of objects shown.- Circle the correct number word to match the given number.2. Monitor the students' progress and provide assistance when needed. Encourage peer collaboration and offer praise for their efforts.Extra Activities (15 minutes)1. Sing a counting song: Teach students a popular counting song like "Ten Little Indians" or "One, Two, Buckle My Shoe." Sing the song together as a class and encourage students to count along with the song.2. Play a game of "Guess the Number": Write a number on the board without showing it to the class. Give students clues about the number, such as "It is an odd number" or "It is bigger than 5." Students raise their hands and try to guess the number. The student who guesses correctly gets a chance to give clues for the next round.1. Review the numbers 1-10 with a quick quiz or a group discussion. Ask questions like "What is the number after 4?" or "What is double the number 6?". Give positive feedback and acknowledge students' progress throughout the lesson.Note: Adjust the lesson duration and activities as needed based on the students' abilities and attention span. Provide extra support for struggling learners and challenge more advanced students with additional activities or higher-level questions.。
1一30积数英文缩写

1一30积数英文缩写The world of numbers is a vast and fascinating realm, encompassing a wide range of concepts, symbols, and applications. From the simplest of single-digit numbers to the intricate patterns of larger numerical values, each numeral holds its own unique significance and representation. In the English language, the numerical values from 1 to 30 have their own distinct abbreviations, each serving as a concise and efficient way to convey these fundamental quantities.Beginning with the number 1, the English abbreviation is simply "1". This straightforward representation reflects the singular and primary nature of this foundational numeral. Moving on, the number 2 is abbreviated as "2", maintaining the same direct and uncomplicated approach. The number 3, on the other hand, is represented by the abbreviation "3", preserving the original numerical form.Progressing to the next set of numbers, the abbreviation for 4 is "4", while 5 is denoted as "5". These simple and recognizable abbreviations make it easy to quickly identify and communicate these common numerical values. The number 6 is abbreviated as "6",keeping the same visual structure as the original numeral.Reaching the single-digit range, the number 7 is represented by the abbreviation "7", and 8 is denoted as "8". The number 9 is abbreviated as "9", retaining the familiar shape and structure of the original digit. These concise abbreviations not only save time and space but also ensure clear and unambiguous communication of these essential numerical values.Transitioning to the double-digit numbers, the abbreviation for 10 is "10", maintaining the two-digit structure of the original numeral. The number 11 is represented by the abbreviation "11", while 12 is denoted as "12". These straightforward abbreviations seamlessly translate the numerical values into their shortened forms.Continuing the progression, the number 13 is abbreviated as "13", and 14 is represented by the abbreviation "14". The number 15 is denoted as "15", preserving the familiar numerical structure. The abbreviation for 16 is "16", keeping the two-digit format intact.Reaching the midpoint of the range, the number 17 is represented by the abbreviation "17", and 18 is denoted as "18". The number 19 is abbreviated as "19", maintaining the consistent approach to abbreviating these numerical values.Moving into the twenties, the abbreviation for 20 is "20", mirroring the original two-digit structure. The number 21 is represented by the abbreviation "21", while 22 is denoted as "22". The abbreviation for 23 is "23", and 24 is represented by the shortened form "24".Approaching the final set of numbers, the abbreviation for 25 is "25", and 26 is denoted as "26". The number 27 is represented by the abbreviation "27", while 28 is abbreviated as "28". The number 29 is denoted as "29", completing the range of double-digit numerical abbreviations.Finally, the number 30 is represented by the abbreviation "30", bringing us to the culmination of this numerical journey from 1 to 30. These concise and consistent abbreviations not only serve as efficient tools for communication but also reflect the inherent structure and patterns within the numerical system.The use of these English abbreviations for the numbers 1 to 30 extends far beyond the realm of simple numerical representation. They find application in a wide range of contexts, from academic and professional settings to everyday life. In the academic world, these abbreviations are commonly used in research papers, scientific publications, and mathematical equations, where precision and clarity are paramount. In the professional domain, they are employed in various industries, such as finance, logistics, and data management,where the need for accurate and streamlined communication is crucial.Moreover, these numerical abbreviations are deeply embedded in our daily lives, from filling out forms and completing paperwork to navigating digital interfaces and communicating in written correspondence. They have become an integral part of our linguistic and numerical landscape, facilitating efficient and unambiguous communication across diverse contexts.In conclusion, the English abbreviations for the numbers 1 to 30 represent a remarkable example of the power and versatility of language. These concise representations not only convey numerical values but also reflect the underlying structure and patterns that underpin our understanding of the quantitative world. As we continue to navigate the complexities of modern life, the mastery and application of these numerical abbreviations will remain an essential skill, enabling us to communicate, collaborate, and problem-solve with greater efficiency and precision.。
2021秋牛津深圳版英语八上Unit2《Numbers》word单元教案
2021秋牛津深圳版英语八上Unit2《Numbers》word单元教案-- 基础教案一、Key words:1.number n.数字Choose a number between ten and one hundred.v. 给...编号Number the pages from one to ten.【辨析】常考短语:a number of & the number ofa number of “若干”或“许多”,a small/large number of少量;大量There are a number of ants on the ground.The number of “...的数量”,The number of the apples is 40.注意:尽管两个短语后面都接复数名词,然而a number of.. 作主语时,谓语动词要用复数 e.g. A number of students are playing.the number of... 作主语时,谓语动词要用单数 e.g. The number of the students is 50.2.check v.检查,核实Please check your answers after finish doing homework.有用短语:check in :在旅社登记住宿;报到;签到Have you checked in at the hotel yet?你在旅社登记住宿了吗?The friends we had invited did not check in until Saturday.我们邀请的朋友直到星期六才到达。
check out:结帐离开Guests must check out before noon, or they will be charged for the day.客人必须在中午前结帐离开,否则将付全日费用。
英语数字表达方式大全
英语数字表达方式大全English numbers can be expressed in a variety of ways, each with its own unique rules and nuances. From cardinal numbers to ordinal numbers, fractions to decimals, there are many different ways to convey numerical information in the English language. Understanding the various forms of number expression is essential for effective communication in both spoken and written English. Whether you are learning English as a second language or simply looking to expand your knowledge of number expressions, it is important to familiarize yourself with the different ways numbers can be represented in English.One of the most basic forms of number expression in English is the use of cardinal numbers. Cardinal numbers are used to denote quantity or count, and they are the most straightforward way of expressing numerical information. For example, "one," "two," "three," and so on are all examples of cardinal numbers. These numbers are used in a wide range of contexts, from counting objects to statingquantities in mathematical equations. Cardinal numbers are essential for basic communication in English, and they provide the foundation for more complex forms of number expression.In addition to cardinal numbers, English also utilizes ordinal numbers to indicate the order or position of items in a sequence. Ordinal numbers are formed by adding the suffix "-th" to the cardinal number, such as "first," "second," "third," and so on. These numbers are commonly used when discussing rankings, dates, and other sequential information. For example, "My birthday is on the twentieth of June" or "She finished in third place in the race." Understanding how to use ordinal numbers is crucial for accurately conveying the order of items or events in English.Another important aspect of number expression in English is the representation of fractions. Fractions are used to express parts of a whole, and they consist of a numerator (the top number) and a denominator (the bottom number) separated by a horizontal line. For example, "1/2"represents one half, "3/4" represents three quarters, and so on. Fractions are commonly used in measurements, cooking recipes, and mathematical equations. It is important to understand how to read and write fractions in English to effectively communicate numerical information in these contexts.Decimals are another common form of number expressionin English, and they are used to represent parts of a whole in a different format. Decimals consist of a whole number part followed by a decimal point and a fractional part. For example, "3.14" represents the number pi, and "2.5" represents two and a half. Decimals are frequently used in mathematical calculations, scientific measurements, and financial figures. Being able to understand and work with decimals is essential for anyone dealing with numerical data in English.When it comes to large numbers, English has specific conventions for expressing them in both spoken and written form. For example, the number 1,000 is read as "one thousand," and 1,000,000 is read as "one million."Understanding how to read and write large numbers is important for accurately conveying numerical information, especially in contexts such as finance, population statistics, and scientific notation. In addition, it is important to be familiar with the use of commas and periods in large numbers, as these punctuation marks play a crucial role in determining the magnitude of the number.In addition to the basic forms of number expression mentioned above, English also has specific conventions for expressing dates, times, and measurements. Dates are typically written in a month-day-year format in American English, such as "January 1, 2023," while they are written in a day-month-year format in British English, such as "1 January 2023." Understanding how to express dates correctly is essential for clear and accurate communication in English, especially in formal or professional contexts. Similarly, expressing time in English requires knowledge of the 12-hour and 24-hour clock systems, as well as the use of terms like "a.m." and "p.m." to indicate morning and afternoon/evening times.Measurements in English can be expressed using a variety of units, such as inches, feet, pounds, gallons, and more. It is important to understand the appropriate units for different types of measurements, as well as how to convert between different units when necessary. For example, understanding that there are 12 inches in a foot or 16 ounces in a pound is essential for accurate measurement and conversion in English. Additionally, it is important to be aware of the use of singular and plural forms for different units of measurement, such as "1 foot" versus "2 feet."In conclusion, the various forms of number expression in English are essential for effective communication in a wide range of contexts. From cardinal and ordinal numbers to fractions, decimals, and large numbers, understanding how to express numerical information accurately is crucial for both native and non-native English speakers. By familiarizing yourself with the different ways numbers can be represented in English, you can improve your ability to communicate clearly and confidently in both spoken and written form. Whether you are learning English as a secondlanguage or seeking to enhance your proficiency in numerical expression, mastering the various forms of number representation is an important aspect of language acquisition and communication.。
- 1、下载文档前请自行甄别文档内容的完整性,平台不提供额外的编辑、内容补充、找答案等附加服务。
- 2、"仅部分预览"的文档,不可在线预览部分如存在完整性等问题,可反馈申请退款(可完整预览的文档不适用该条件!)。
- 3、如文档侵犯您的权益,请联系客服反馈,我们会尽快为您处理(人工客服工作时间:9:00-18:30)。
English by the Numbers ~ Unit 11. Numbers, Decimals andFractionsHundredsThousandsFractions & DecimalsQuizThis Unit prepares students to understand and clearly express small and large numbers, as well as fractions, decimals and percents.Sample Languagenumbersfive hundred and eighteen (518), sixty-three thousand four hundred and twelve (63,412), seven hundred and seventy thousand (770,000)decimalsfive one-thousandths (.005), one point zero five (1.05), point eight five percent (.85%)fractionsone-fifth (1/5), twelve and an eighth (12 1/8), three-fiftieths (3/50)Key Sentences & ExamplesThese numbers are all greater than one hundred and less than one thousand.Be careful not to confuse 'teen' numbers such as thirteen with 'ty' numbers such as thirty.Five hundred eighteen. Three hundred eighty.These numbers are all greater than one thousand and less than one million.Nine thousand seven hundred forty-three. Ninety-seven thousand four hundred thirty-six. Nine hundred seventy-four thousand, three hundred and sixty-one. Sometimes the number nine thousand seven hundred forty-three is read as ninety-seven hundred and forty-three.Here are some fractions. One-half, one-third, one-fourth. One-fiftieth, one-hundredth, one-thousandth.Here are some decimal fractions and percents. Point five. One point zero five. Zero point one percent.For very small numbers, such as 0.00001, you can read it as one point zero times ten to the minus fifth.English by the Numbers ~ Unit 22. Numerical Operations andRelationsNumerical OperationsNumerical RelationsQuizThis Unit prepares students to understand and clearly express small and large numbers, as well as fractions, decimals and percents.Sample Languagenumerical operationsa plusb equals c, a divided by b, the nth root of x, x squared, twice the sum of a and b, fifty percent more than fournumerical relationsthe second largest number, the third smallest number, the difference between the two largest numbers, half the sum of the smallest and largest numbersKey Sentences & ExamplesThe sum of a and b is c; or a plus b equals c. The difference of c and b is a; or c minus b is equal to a. Here we have a times b equals x; or a multiplied by b is x. In this example, we have the sum of a and b multiplied by c. In this example, a is divided by b; or a over b. This is the nth root of x. For example, the square root of four is the second root of four, which is two. Here we have the cube root of eight, or the third root of eight, which is two. This is x to the nth. For n equal to two, we say x squared. For n equal to three, we say x cubed, or x to the third.Take the sum of two plus six and divide it by two. Multiply the sum of a plus b by fifteen and divide the result by a times b. What number is the sum of eighty-five and five? What is two to the fourth? What is twenty percent more than ten? If x is fifty percent more than four, what is x? Which of these five numbers is the smallest? Which numbers are the two largest numbers? Which number is ten percent of the largest number? Which number is equal to the difference between the largest and smallest numbers?English by the Numbers ~ Unit 33. Related Changes Part 1Home BuyersSample Graphs Sample LanguageGraphsremained fairly constant, didn’t change, rise, increased, went up, made steady gains, gets weaker, decreases, went down, declined, droppedrelated changesX remained fairly constant, but y increased significantly. As the price of an average house increased, the percentage of U.S. families able to buy a new house decreased.Part 2Speed & DistanceLanguage LearningBlood PressureQuizThis Unit prepares students to describe how one quantity correlates to another. Sometimes there is no relationship. Sometimes a change in one quantity causes a change or in another.Key Sentences and ExamplesThis graph shows the percentage of US families able to buy an average-priced new home. As the price of an average house increased, the percentage of U.S. families able to buy a new house decreased. Between 1970 and 1976, the average price of a new house rose from $23,400 to $44,200. As a result, fewer U.S. families were able to buy new houses. In this graph, both X and Y are increasing. In this graph, X is increasing while Y is decreasing. Here we are looking at changes in X and Y during the ten-year period from 1978 to 1988. During that period, whenever Y increased, X decreased, and whenever Y went down, X went up. In this case, as exports, X, went up, unemployment, Y, declined. While X stayed about the same, Y increased. X remained fairly constant, but Y increased significantly. X increased rapidly at first, but then it fell even though Y continued to climb. As the dollar gets weaker, the number of American workers employed by Japanese firms continues to climb. An increase in the value of the Japanese yen is generally followed by an increase in Japanese productivity.Goals:To be able to ask and answer questions about how one factor relates to another.To be able to express an opinion about one quantity is related to another.English by the Numbers ~ Unit 44. Line GraphsPart 1Auto salesForeign Share of Steel MarketUnemployment RateHome BuyersAverage Family Size Sample Language & Learning Pointsline graphssales declined to a low of around 300,000, sales increased steadily, sales were around 900,000 units, sales at Union Motors surpassed sales at Federal Motors, the number of potential first-time home buyers peaked, the largest share of the market, changes in the unemployment ratepresent perfect (have + V(n))sales have stopped their decline, have remained fairly steady, the number of potential first time buyers has changed, the number has been dropping…Part 2City Government ApprovalPopulation GrowthWorld Energy Consumption Passenger Car Exports Traffic Fatalities Key Sentences and Examples:This first example shows how auto sales at Union Motors have changed since 1960. In 1960, sales were about 500,000 units. From 1960, sales declined to a low of around 300,000 in 1965. From 1965, sales increased steadily until they reached a high of around 900,000 in 1974. Then, because of increasing imports, sales began a long decline, to a low of around 500,000 units. Since 1980, sales have stopped their decline and have remained fairly steady.This graph shows how the foreign share of total US steel sales changed during the period from 1965 through 1985. Between 1970 and 1980, the lowest foreign share of the market was about 12%. The largest share of the market before 1970 was about 17%, in '68.This graph shows how the number of potential first time home buyers has changed. The number of potential first-time home buyers peaked at around 45 million at the end of the '80s. Since the beginning of 1990, the number has been dropping.This graph shows the decrease in average family size in the US. US families in 1989 averaged only 3.16 people, the smallest size since 1940. This drop is primarily the result of lower birthrates and continued increases in the number of single-parent families. This graph indicates that the average family has been getting smaller.Part 2This line graph shows how the voter approval rating for a city government has changed during the past 12 months. Note that the approval rating was at its highest during the first 3 months and at its lowest in month 8. It reached its lowest point in month 8. During month 8, 60% of the voters disapproved of the government's performance. This graphs shows the rate of population growth in several countries. It also shows the literacy rate in each of the countries. The adult literacy rate is the percentage of adults who can read and write. The axis on the left gives the percentage growth rate, and the axis on theQuizThis Unit prepares students to present data from a line graph, especially changes over time. Goals:To be able to use the present perfect (have+V(n)) to express change.right gives the literacy rate. For example, the percentage annual growth rate of Brazil is about1.4%. Its literacy rate is 0.83 or 83%. For these countries, the graph suggests that countries with a higher literacy rate have a lower rate of population growth.This graph shows how the world's consumption of energy is increasing. The scale on the left is in units of quadrillion BTUs or British Thermal Units. In 1983, the world's energy consumption was 283 quadrillion BTUs. The world's energy consumption in 1990 was 347 quadrillion BTUs.This graph shows how passenger car exports changed in the 5 year period ending in 2003 It shows the value of exports in billions of dollars for seven exporting countries.This graph gives the causes of traffic fatalities based on 4000 separate accidents. Each bar shows the number of fatalities for each cause. The axis on the right gives the percentage. For example, about 1200 deaths were due to speed. The line graph above the bar graph shows the cumulative percentage of fatalities due to each cause. It shows that 72.3 percent of the traffic fatalities were due to two causes, lane changes and unsafe speed.Sample Questions:When did the approval rating reach 50%?When did the approval rating reach its lowest point? What has happened to the approval rating during the past 4 months?(a) It has stayed flat. (b) It has improved. (c) It has gotten worse.What percent of voters disapproved of the government's performance during month 8?What conclusion can be drawn from this graph? Which country has a negative growth rate?Which country has the highest growth rate?Of these countries, which country has the lowest rate of literacy?About what is Vietnam's literacy rate?What was the world's energy consumption in 1990? What was the increase in energy consumption from 2000 to 2005?In which 5-year period did energy consumption increase the most?Which country was the leading exporter of passenger cars for the entire 5-year period?Which country saw a decline in its exports of passenger cars from 1999 to 2003?Which country made the largest gain?What was the value of France's passenger car exports in 2003?Which country made the largest percentage gain in sales? During which year did Germany make its largest gain? About what percentage of traffic fatalities were caused by people who were distracted in some way?Which two causes are responsible for 72.3 percent of traffic fatalities?What caused a little more than 500 of the fatalities? What was the 2nd most common cause of the traffic fatalities?What was the leading cause of traffic fatalities?Lane changes caused what percentage of the fatalities?English by the Numbers ~ Unit 55. Bar GraphsPart 1Math Scores & SpendingBirth RatesIncome DistributionTax RatesDefense Spending Sample Language & Learning Pointsbar graphsThis graph compares the tax rates at various income levels. Students from Japan scored 65%. West Germany spent almost 3% of its GNP for defense in 1979. ComparisonsIn the US, there is a higher ratio of spending for higher education than for basic educatio n. Britain’s tax rate for the working poor is the highest, at more than 20%.Key Sentences and Examples:This first example compares math scores for five countries: Japan, France, the UK, the US, and Sweden. Each bar indicates the mean percent of items answered correctly on a mathematics test of 8th grade students. Students from Japan scored 65%, which is the highest. French students didn't do as well as the Japanese, but they scored over 50%, which was second best.Now let's compare the amount of money which is spent on education in each of these countries.In the US, for example, there is a higher ratio of spending for higher education than for basic education. Even though Sweden and the U.S. spend the most on education, their test scores are the lowest.This graph compares how income is distributed among the richest and poorest segments of each country. The income ratio here means the top 20% of households divided by the bottom 20%. In Brazil, for example, the top 20% of households receive 66.6% of the nation's income, compared to the bottom 20%, which receive just 2.0%. This works out to an income ratio of 33. This graph suggests that one factor in economic growth might be how income is distributed throughout a country.This graph compares the tax rates at various income levels in Japan, the U.S., and the U.K. for the year 1987. Britain's tax rate for the working poor is the highest, at more than 20%. The U.S. has the lowest tax rate for the rich.This graph compares the defense spending of six countries. Japan spent about 1% of its GNP for defense in both 1979 and 1984. The U.S. spent just over 5% of its GNP for defense in 1979. By 1984 it had increasedits defense spending to 6.4%.Part2This graph gives life expectancy information. Without exception, it shows that women live longer than men. On the far left, we see that the life expectancy throughout the world is about 64 years. Men live about 62 years and women live about 66 years. In France and Brazil, women live considerably longer than men. In bothPart 2Life ExpectancyMedian AgesCigarette SmokingBlood Pressure & ObesityCO2 EmissionsSources of EnergyElectricity ProductionQuizThis Unit prepares students to participate in a decision-making situation where they have to express alternatives or give reasons for deciding on one course of action over another.In the Unit, the Sales Manager at Federal Motors, Sonia Scott, needs to decide whether to send Bob or Ed to Australia to open a new branch office.Goals:To be able to understand and express different degrees of certainty in linking ideas and events. To develop oral fluency and confidence to express more complex ideas.countries, the difference is more than 5 years. Theoverall life expectancy in Australia is the highest, at 80 years.This graph gives the median age in several countries. The left bar shows that the median world age is 27.6 years. France has the highest median age of these countries. That means you would expect to see fewer young people in France. Their population is aging. In contrast, Egypt and Malaysia have a median age of less than 24. In these two countries, you would expect to see many young people.This graph shows how cigarette smoking has declined in a region of England. The bars on the left give the smoking data from 1978 and the bars on the right give the data in 1998. It shows that smoking has declined rather dramatically. The percentage of ex-smokers increased from 35% to 55%, and the percentage of heavy smokers dropped to less than 5%.This graph compares the rates of smoking among men and women in several countries. It also gives the percentage of people who are diabetic. The country which has the highest rate of men smokers is China. The country which has the highest rate of smokers among women is France. The country which has the lowest rate of smokers among men is Singapore. Among women, only about 3 percent of women smoke in China, India, Singapore and Vietnam. The percentage of diabetics is less than 10% in all of the countries except for Singapore. According to the data, about 11% of the population of Singapore have diabetes. According to this graph, the percentage of women smokers in New Zealand is a bit higher than the percentage of men smokers. This study looks at blood pressure, obesity, and the number of manual workers. It shows the changes over a 20 year period in a region of England, and with no significant change in the population. Note that blood pressure rose significantly. In 1978, 28.1% of the population had high blood pressure, meaning their systolic pressure was 160 or higher. By 1998 the rate had more than doubled, to just over 60%. The rate of obesity also increased significantly, from 20% in 1978 to 34.3% in 1998. The number engaged in manual work also declined, from 59.1% to just over 50%. Looking at the data, which is a reasonable conclusion? There may be a connection between obesity and blood pressure. Studies indicate that being overweight is one cause of high blood pressure. BMI means body mass index. It correlates with body fat. Adults with a BMI over 27 are considered overweight or obese. People with a BMI below 18.5 are underweight, depending on gender and age.This graph compares carbon dioxide emissions from several countries in 2005. CO2 emissions are important because they contribute to global warming. The scale on the left gives metric tons per capita per year. Per capita means per person. From the graph it's clear that CO2 emissions from the US are much too high relative to other countries.This graph shows how the world gets its energy. The scale on the left is in quadrillion btu's, or British Thermal Units. The front row of bars gives the breakdown in 1970 and the back row gives the breakdown in 2001. Note that the world's energy consumption increased dramatically, from 212 to 365 quadrillion btu's. Oil consumption increased about 50%, as did natural gas consumption. The world continues to increase its use of fossil fuels. Renewable sources of energy are still quite limited.This graph shows how electricity is produced in several countries. This data is for the year 2005. On the left, we see that Brazil used hydroelectric power to generate almost 90% of its electricity. In contrast, Ireland relied almost entirely on fossil fuels. In France, the main source of electricity came from nuclear power. What was the main source of electricity for Germany? Germany's main source of electricity was fossil fuels. What percentage of US electricity came from nuclear power? About 20% of US electricity came from nuclear power. What percentage of French electricity came from fossil fuels? About 10% of French electricity came from fossil fuels. Which country used no nuclear power to generate electricity? None of Ireland's electricity production came from nuclear power. What was India's second most important source of electricity? After fossil fuels, hydroelectric power was the most important source of electricity production for India.This graph compares the annual rate of population growth in several countries. The bar graph on the left gives the rate of population growth for the entire world. Of these countries, Malaysia has the highest rate of growth, 1.8% per year. Which of these countries has the lowest rate of population growth? Which of these countries has the highest rate of population growth? Of these countries, France has the lowest rate of population growth.English by the Numbers ~ Unit 66. Pie GraphsPart 1:Daily ActivitiesHow Satisfied Are You With Your Job? Job Satisfaction FactorsDrinkers 1978-80 & 1998-20002001 & 1970 Energy Sources Sample Language & Learning Points introducing pie graphsThis pie graph shows; this graph gives the estimated…Other factors shown in this graph includeAs you can see… Taken together, these factors….This graph is based on… It gives a breakdown of…Putting the two graphs together, we can see that…In the period 1998-2000…passivesis divided up, might be improved, is used for, could be reduced, could be improved, this survey was conducted, is based on, was being used, were caused by… According to the graph, how much of the day is spent sleeping?Part 2:2000 & 1970 Oil Usage In the USChina Imports & Exports 2004Causes of Death by Unintentional InjuryAnnual Deaths by Selected CausesAircraft Sales 1995 & Now Key Sentences and Examples:Pie Graphs are a useful way to show how various partscontribute to the whole. For example, we can quickly seehow people divide up their day.QuizThis Unit prepares students to understand and give oral presentations that refer to pie graphs.A wide variety of useful vocabulary is also included.Goals:To develop oral fluency and the ability to make a well-organized oral presentation around data presented as pie graphs.To.be able to ask and answer questions about the relative importance of various factors as presented in pie graphs.Daily ActivitiesThis pie graph shows how a typical day is divided up for a hardworking software engineer. Assuming the person sleeps an average of 6 hours per day, we see that 25% of the day is spent sleeping. If the person works 8 hours per day, that's 33% of the day. Other factors shown in this graph include meals, commute time, entertainment, and homework or hobby. We can easily see how this person's day is divided up, and how the quality of life might be improved. The graph shows that 12.5% of the day is used for commuting. If commute time could be reduced, the quality of life could be improved.How Satisfied Are You With Your Job?This pie graph shows the responses to the question: "How satisfied are you with your job?" As you can see, more than 60% of the respondents were satisfied or very satisfied with their jobs. Ten percent were not satisfied. These people may be looking for a new job. The remaining group, the group who answered "so so" was neither satisfied nor dissatisfied. For these people, other things may be more important in their lives than work.Which conclusion most accurately summarizes this graph? What percent of respondents were not satisfied with their job? Etc.Job SatisfactionThis next graph shows how factors contributing to job satisfaction compare in importance. This survey was conducted with 92 workers between 20 and 25 years old. As you might expect, salary is the most important factor. However, the survey also shows that several other factors are also very important. Taken together, training and career path are even more important than salary. In other words, workers think it's important that their present job leads to a better future. Work environment and co-workersare also important factors. These two factors relate to the quality of time spent at work each day. Another important factor is challenge. Therefore, if you are their manager, you want to give them work that meets this need. What we might conclude from this graph is that a combination of factors leads to job satisfaction.1970 Oil Usage in the United StatesThis graph shows how oil was being used in the United States in 1970. 58 percent of the oil used was for transportation, which includes automobiles, trucks and airplanes. 7 percent of the oil used was for generating electricity.China Imports 2004This graph gives us information about China's trading partners. We can see that 16% of China's imports came from Japan. Fifty two percent of China's imports came from 5 trading partners. Note that China imported more from South Korea than from the United States.China Exports 2004.This graph gives us information about China's exports in 2004. Its largest single market was to the US, which accounted for almost a quarter of China's exports. Causes of Death by Unintentional InjuryThis graph gives the causes of death by unintentional injury in one Middle Eastern country. It shows that traffic accidents account for more than half of the deaths. Causes of Death(Source: US Surgeon-General 1989)According to health experts, smoking is a major cause of disease and death. Tobacco use is a known or probable cause of death from various cancers, heart disease, and other diseases. In fact, smokers have a death rate about 3 times higher than nonsmokers.This graph gives the estimated annual deaths from these causes per million people. Of the total of 7,775 deaths due to these causes, more than 90% are caused by smoking. Traffic accidents are the cause of 2.4% of the deaths. Note that more than 99% of these deaths are caused by smoking, alcohol and traffic accidents. The other selected causes include drowning, which accounts for about 3 tenths of one percent of the total.Drinkers 1978-80This graph is based on a study of drinking in a number of towns in Great Britain. It shows the drinking pattern of the population in these towns in 1978-80. Note that at this time 6% of the population were non-drinkers and 24% of the population were occasional drinkers. Weekend drinkers accounted for 39 percent of the population. Among the 31% who were drinkers, the graph gives a breakdown by how many drinks they had each day. The heaviest drinkers, those who had 6 or more drinks per day, were 11% of the population. Now let's look at the same population 20 years later. This graph shows the drinking pattern in 1998-2000. Note that the percentage of non-drinkers is 10%, compared to 6% 20 years earlier. The heaviest drinkers, those who had 6 or more drinks per day, was just 3%.Putting the two graphs together, we can see that heavy drinking declined. Though occasional drinking increased slightly, the percentage of people having 3 or more drinks per day declined significantly.2001 Energy SourcesThis graph shows the dependency of the world on fossil fuels in 2001. Oil, Coal and Natural gas are all fossil fuels. Together they accounted for almost 90% of the world's energy.2000 Oil Usage in the United StatesThis graph shows how oil was being used in theUnited States in 2000. 70 percent of oil usage was for transporation, which includes automobiles, trucks and airplanes. Note that only 3 percent oil usage was for generating electricity.The graph indicates that if the US wants to reduce its oil consumption it should focus on cutting the amount used for transportation. Smaller, more fuel-efficient cars are essential. More efficient public transportation might also reduce the need for more automobiles.Aircraft SalesThese graphs show how the market share for aircraft sales has changed since 1995. According to the graphs, United Industries has lost market share. Its share of the market has declined from 29% to 25% of the market. On the other hand, Advanced Technologies has almost tripled its share of the market. Its market share has increased from a 10% share in 1995 to a 27 percent share now.English by the Numbers ~ Unit 7Sample Language & Learning PointsGraphsHow many calories per hour are burned while sleeping? What was the average price of gold in 1987?numerical operations10% less than 15 million, 20% more than 50 million, 10 times the smallest number, 80 is what percent less than 100 numerical relationsa increases by a factor of four, x is greater than or equal to y, x must be greater than zprobabilitiesthe probability of drawing an ace from a full deck of cards, the probability of drawing two aces in a row comparisonsThis chart compares the unemployment rates of several countries. How many more calories per hour are burned while jogging than hiking?Key Sentences and ExamplesThis chart gives the number of calories burned per hour for each activity.Which activity uses the most energy per hour?How many more calories per hour are burned while jogging than hiking?According to this graph, when was the best time to buy gold?If you bought gold in 1978 and sold it in '88, what was the approximate difference in price?Which number is 10% less than the largest?Eighty is what percent less than 100?One hundred is what percent more than 80?If you increase the unit price of an item from $3.00 to $4.00 what is the percentage increase?Which number is ten times the smallest number?These equations express the relationship between centigrade and Fahrenheit.Water boils at 100 degrees Centigrade, which is 212 degrees Fahrenheit.Water freezes at 0 degrees Centigrade, which is 32 degrees Fahrenheit.If X is greater than or equal to Y, and Y is greater than or equal to Z, which is the most accurate conclusion?The probability of drawing the ace of hearts from a full deck is one in fifty-two.Since there are 4 aces in a deck, the probability of drawing an ace is four in fifty-two.If four cards have been drawn from a deck, and no aces have been drawn, what is the probability that the next card will be an ace?。