Lurking Variables
问题分析:数据缺失导致分析结果不准确的原因

问题分析:数据缺失导致分析结果不准确的原因数据在现代社会中扮演着非常重要的角色,因为它提供了有关事物的准确,有意义的信息。
数据允许我们更好地了解和理解我们的世界,并且在科学和商业领域中,数据驱动决策已经成为常态。
然而,在数据分析领域,存在一个严重的问题:数据缺失。
数据缺失是指在数据集中丢失了一些值,导致无法分析或分析结果不准确。
本文将深入探讨数据缺失导致分析结果不准确的原因。
一、缺失数据的种类在开始分析数据缺失的原因之前,有必要先了解数据缺失的种类。
数据缺失可以分为三种类型:1. 完全随机缺失:数据缺失是完全随机的,与其他变量无关。
例如,在调查问卷中某些问题未回答,这可能是因为受访者没时间或忘记回答。
2. 非随机缺失:数据缺失是与其他变量有关的。
例如,在一个医疗研究中,一些受试者可能会因为疾病严重而缺失数据。
3. 有意缺失:数据缺失是有意为之的,这可能是因为某些变量并不适用于某些受试者。
例如,一个关于人类健康的调查中,妇女可能会被问及有无前列腺癌,然而前列腺癌显然并不适用于女性。
二、数据缺失导致分析结果不准确的原因1. 统计稳定性缺失数据可能会导致数据集的统计稳定性出现问题。
统计稳定性是指同样的分析重复多次时,得到的结果是否一致。
缺少数据可能导致数据集中的统计误差增加,从而导致结果的不准确性。
2. Lurking variables在缺失数据问题中,还经常出现“潜在变量”问题。
潜在变量是指对研究具有影响的变量,但并未被测量或记录。
例如,在医学研究中,潜在变量可能是患者的遗传背景或饮食习惯。
潜在变量很难统计,如果缺失数据的人群中,某个潜在变量与数据有关,那么分析的结果将会出现误差,这就是“潜在变量”问题。
3. 样本的不适当性缺失数据可能导致样本的不适当性。
样本不适当性是指采样方法或样本的大小不足以代表总体。
可以肯定的是,缺少数据会减少分析样本的大小,这可能导致样本的不适当性。
4. 误导性结论缺失数据可能导致结果受到误导。
Sampling

Sampling Plans
Stratified Random Sampling:
Population strata which may have a different distribution of variable. Strata must be known, non-overlapping and together they comprise the entire population. Examples: Measuring Heights: Stratify on Gender Strata are Male, Female Clinical study: stratify on stage of cancer Measuring Income: Stratify on education or years of experience
For blood screening, pool the samples from x individuals and test for rare disease. If the test is negative for disease then all x blood draws are negative. If the test is positive then test all x individually.
Sampling Plans
Composite Sampling:
Sample n units at random Form a composite of n/k units for k composite-samples; mix well Take the measurement on each of the k composite-samples For binary outcome (positive or negative; success or failure; yes or no, etc) with rare probability of one of the two possible outcomes then forming composites can save a lot of testing.
DFSSBB314CentralCompositeDesign 38页PPT文档

OR to ensure that blocks are orthogonal
(block coefficient(s) have no impact on other coefficients in the model)
OPTIMIZE Rally Points 4-6 Minimize Product Complexity
Maximize Product Velocity Optimize Critical Inputs - Final
Robust Design Optimize, Simulate Processes Final Robust Product Design
Develops Quadratic Models Relatively inexpensive Supports sequential experimentation strategy Optimizes process knowledge Commonly used with Response Surface Methods
Copyright © 2001-2004 Six Sigma Academy International LLC All Rights Reserved
314-10
Steps to Conduct a CCD Experiment (1)
Step 1: State the practical problem and objective of the experiment
314-8
Alpha
-1
0 +1
Possible Central Composite (CC) Designs
计量经济学中英文词汇对照

cross-loading Cross-over design Cross-section analysis Cross-section survey
Cross-sectional
Crosstabs Cross-tabulation table Cube root Cumulative distribution function Cumulative probability Curvature Curvature Curve fit Curve fitting Curvilinear regression Curvilinear relation Cut-and-try method Cycle
Controlled experiments Conventional depth Convolution Corrected factor Corrected mean Correction coefficient Correctness Correlation coefficient Correlation index Correspondence Counting Counts Covariance Covariant Cox Regression Criteria for fitting Criteria of least squares Critical ratio Critical region Critical value
Cyclist DDD D test Data acquisition Data bank Data capacity Data deficiencies Data handling Data manipulation Data processing Data reduction Data set Data sources Data transformation Data validity Data-in Data-out Dead time Degree of freedom Degree of precision Degree of reliability Degression Density function Density of data points Dependent variable Dependent variable Depth Derivative matrix Derivative-free methods Design Determinacy Determinant Determinant Deviation Deviation from average Diagnostic plot Dichotomous variable Differential equation Direct standardization Discrete variable DISCRIMINANT Discriminant analysis Discriminant coefficient
Yaman, Alp

43-48
49-54
Gage R&R (Nested) for 2HR %
G age name: D ate of study : U S P 4 IP G age R & R 11/06
Components of Variation
100
% Contribution % Study Var
Reported by : A rmando Riv era Tolerance: M isc: S ubgroup 3 O nly
Design of Experiment
How should the factors be selected?
Factor selection should be based on a planned study that analyzes many potential factors over a wider range than is studied in a DOE.
Components of Variance (COV) When resolving an issue, the COV approach: Use this approach to screen factors, statistically, to determine what factors should be in the DOE. Use this approach to determine which factors have the significant interactions that need further study.
Gage R&R (Nested) for 2 hours
G age name: Date of study : U S P 4 In-P rocess S amples January 24. 2008
全因子DOE设计

-- - - - - -
1
+- - - - - -
2
++ - - - - -
3
+- + - - - -
4
+- - + - - -
5
+- - + + - -
6
+- - + + + -
7
+- - + + - +
最后的结论?这样的试验有什么问题呢?
Result 2.1 2.6 2.4 2.5 2.8 2.9 2.7 3.2
第25页
DOE实验的基本步骤
6、做试验、收集数据
StdOrder RunOrder CenterPt Blocks
A
B
C
Y
10
1
1
2
1
-1
-1
13
2
1
2
-1
-1
1
14
3
1
2
1
-1
1
9
4
1
2
-1
-1
-1
12
5
1
2
1
1
-1
15
6
1
2
-1
1
1
16
7
1
2
1
1
1
11
8
1
2
-1
1
-1
8
9
1
1
1
1
1
6
10
1
1
1
1. 结论更加可信 2. 估计实验的精度 3. 区别重要/非重要因子 4. 找出因子间交互作用 5. 量化因子或交互作用对响应变量的影响度 6. 建立预测模型 7. 易于分析 8. 高效——有限的资源、最多的信息
第2讲 管理科学研究方法(管理科学研究的基本要素)

中介变量的性质与作用
• 中介变量是指能够传递自变量(预测变量)与因变量 (结果变量)影响的变量。中介变量解释自变量为什么 会对因变量起作用。
中介变量
自变量
结果变量
管理科学研究的基本要素
– 变量的类型: – 插入变量:例子
劳动力的多 元化 组织效能
管理科学研究的基本要素
– 变量的类型: – 插入变量:例子
– 外生变量(extraneous/exogenous variables):是在自变量与因变量 的对应关系框架之外作为外在条件 而存在的变量,它用于说明或限定 自变量与因变量的对应关系存在的 外部环境。
研究架构范例
Control Variable
IV
DV
IV DV
Moderating Variable
研究中理论概念与数据的关系
• 理论概念:常常是不可以直接观察的,例如财富/ 知识和素质等。 • 理论概念的替代变量(Proxy):必须是可以观察 的变量,但是与前者之间存在代表性偏差,例如 家庭拥有资产价值(原值)、存款额、教育程度 等。 • 进行研究时 实际取得的替代变量值: 可能含有测 度误差。 • 研究人员在分析中 实际使用的数值: 可能在数据 处理过程中引入误差。
– 调节变量(moderating variable/Moderator):A construct that governs or limits the relationship between two other constructs. Determines whether: » 它界定着自变量和因变量之间关系的边界条件, 是影响自变量和因变量之间关系强度或关系方 向的变量。它的存在可能会强化或弱化因变量 受自变量的影响程度。
Design-Expert 8.0.5响应面试验实施注意事项
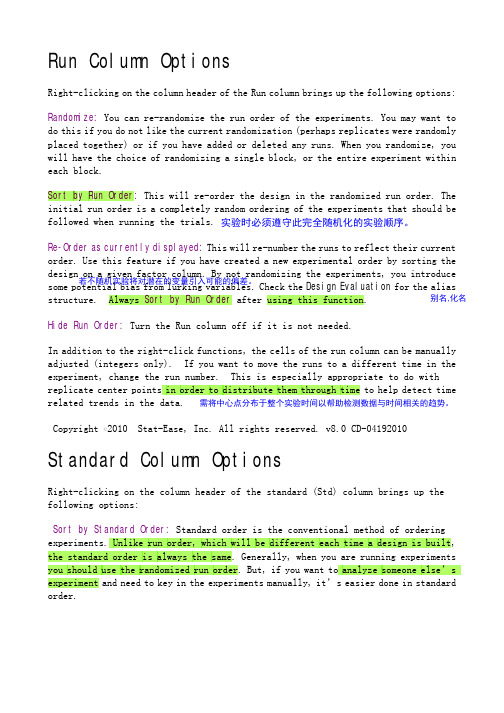
Run Column OptionsRight-clicking on the column header of the Run column brings up the following options: Randomize: You can re-randomize the run order of the experiments. You may want to do this if you do not like the current randomization (perhaps replicates were randomly placed together) or if you have added or deleted any runs. When you randomize, you will have the choice of randomizing a single block, or the entire experiment within each block. Sort by Run Order: This will re-order the design in the randomized run order. The initial run order is a completely random ordering of the experiments that should be followed when running the trials. Re-Order as currently displayed: This will re-number the runs to reflect their current order. Use this feature if you have created a new experimental order by sorting the design on a given factor column. By not randomizing the experiments, you introduce some potential bias from lurking variables. Check the Design Evaluation for the aliasstructure. Always Sort by Run Order after using this function.Hide Run Order: Turn the Run column off if it is not needed.In addition to the right-click functions, the cells of the run column can be manually adjusted (integers only). If you want to move the runs to a different time in the experiment, change the run number. This is especially appropriate to do with replicate center points in order to distribute them through time to help detect time related trends in the data. Copyright ©2010 Stat-Ease, Inc. All rights reserved. v8.0 CD-04192010 Standard Column OptionsRight-clicking on the column header of the standard (Std) column brings up the following options:Sort by Standard Order: Standard order is the conventional method of ordering experiments. Unlike run order, which will be different each time a design is built, the standard order is always the same. Generally, when you are running experiments you should use the randomized run order. But, if you want to analyze someone else ’s experiment and need to key in the experiments manually, it ’s easier done in standard order.实验时必须遵守此完全随机化的实验顺序。
- 1、下载文档前请自行甄别文档内容的完整性,平台不提供额外的编辑、内容补充、找答案等附加服务。
- 2、"仅部分预览"的文档,不可在线预览部分如存在完整性等问题,可反馈申请退款(可完整预览的文档不适用该条件!)。
- 3、如文档侵犯您的权益,请联系客服反馈,我们会尽快为您处理(人工客服工作时间:9:00-18:30)。
n
Safeguard:
— Randomize the order of the experimental trials to protect against the effect of lurking variables
n
Action:
— If the lurking variable creates a trend it can be compensated for in the numerical analysis — Conclusions can then be drawn from the original factors that are not affected by such lurking variables
The Agricultural Sciences Department at North Carolina State University developed a new and improved chicken feed that would supposedly promote plumper and meatier chickens. The school contracted with a local poultry provider (Holly Farms) and conducted a series of studies testing the new product. The NC State Mathematics Department was asked to develop a DOE to support the above tests. Preliminary calculations were made and two populations of chickens were identified, tagged (this becomes very important later), and segregated. One population was fed the standard feed and the other fed the new and improved feed. After feeding the two populations of chickens, statistically significant samples from each population were slaughtered and weighed (what we in Power Systems would refer to as 'Destructive Testing'). The outcome of the experiment was obviously trying to prove that chickens on the new feed weighed more than those on the old feed. In this case the Y = Weight and X = Type of feed. After reviewing the data, the scientists were surprised to learn that there was no statistical difference between the two populations. The average weight (from the samples) was actually slightly higher (although not statistically higher - p-value > 0.05) for those chickens fed the standard feed. Obviously, this baffled the scientists involved in the experiment. After a few weeks of evaluating the experiment and the data, one of the grad students asked Holly Farms for a map of their facility.
*Source: Joiner, Brian L. “Lurking Variables: Some Examples,” The American Statistician , November 1981, Volume 35, No. 4, pp. 227-233.
Improvement by Design
Improve Phase
g
GE Power Systems
Notes:
Lurking Variables
n
Definition*:
— A variable that has an important effect and yet is not included among the factors under consideration because:
Why Randomize?
Etch Rate vs Sequence
9500
Stirrer On Etch Rate
9000
8500
Stirrer Off
8000 Index 10 20 30
Improvement by Design Version 3 1/99 3.44
Proprietary to General Electric Co. 3.44
Improve Phase
g
GE Power Systems
Notes:
This shows an example of how etch rate appears to decrease over time. If you ran your experiment in standard order, all of the tests on the last factor would be at the end of the run. In this example the last factor was stirrer (on or off). This graph would lead us to conclude that the stirrer being on has no effect or even a negative effect on etch rate. The lurking variable of bath degradation has caused us to incorrectly assume that having the stirrer on results in a shallower etch depth. Note a T-test for means with Ha = mean of stirrer off > mean of stirrer on gave a P value of 0.
Version 3 1/99
3.42
Proprietary to General Electric Co. 3.42
Improve Phase
g
GE Power Systems
Notes:
Please tБайду номын сангаасke a few minutes to read this example.
An Example of a Lurking Variable
Improvement by Design
Version 3 1/99
3.43
Proprietary to General Electric Co. 3.43
Improve Phase
g
GE Power Systems
Notes:
Lurking Variable Example (cont.)
After reviewing the map, the student noticed that some of the chicken houses were located immediately next to the slaughter house. This raised a question in the student's mind and he decided to drive out to the farm for some first-hand observations. He was escorted to the slaughter house area and immediately noticed that the chickens located in the houses next to the slaughter house demonstrated significantly higher levels of activity - i.e. clucking, pecking, and running around like... well... like chickens. After another review of the experimental data (by tag number), it was discovered that all of the chickens on the new feed had been located in the house immediately adjacent to the slaughter house - a lurking variable had been identified. (NOTE: without the tag numbers being recorded, this lurking variable may have never been discovered once again illustrating the importance of proper, thorough data collection). After reviewing his findings with the team, it was decided to introduce a new variable into the experiment - chicken house location. The experiment was re-run with the new variable included (i.e. chicken locations were randomized) and the results analyzed. On the second attempt, the results validated the scientists original hypothesis - the new feed produced plumper, meatier chickens. Evidently, those chickens located next to the slaughter house experienced higher stress levels and subsequent weight loss. As a result, Holly Farms opted to use the new feed AND also relocated all chicken houses AWAY from their slaughter houses. Moral of the Story: Don't keep your chickens too close to the slaughter house.