应用商务统计学讲义,第一章,中英文对照
教学课件 商务统计学(第5版)

样本 数据 (Xi) : 10 12 14 15 17 18 18 24
n=8
平均数 = X = 16
S (10 X)2 (12 X)2 (14 X)2 (24 X)2 n 1
(10 16)2 (12 16)2 (14 16)2 (者个人已经发布的数据。 • 可以设计一个实验来获得必要的数据。 • 可以进行调查。 • 可以通过观察研究的方式。
Chap 1-14
数据的类型
▪ 属性变量(categorical variables)(也称为 定性变量(qualitative variables))给出定 性的回答,比如是或者不是。
全距 = 120 - 1 = 119
Chap 3-34
变异程度的度量:方差
• 观察值相对其算术平均数的离差平方和
– 样本方差:
n
(Xi X)2
S2 i1 n-1
其中
X= 算术平均数
n = 样本容量 Xi = 变量X 的第i个观测值
Chap 3-35
变异程度的度量:标准差
• 变异程度最常用的度量 • 显示与平均数的变异程度 • 方差的平方根 • 与原始数据有相同的单位
Chap 1-16
连续的
例子: 重量 电压
(衡量特征)
统计学使用的电脑程序
• Minitab
– 进行统计分析的统计包 – 用来进行尽可能精确的统计分析
• Microsoft Excel
– 多种功能的数据分析工具 – 有多种功能,但是每一种都没有其他程序那样专注
• Minitab和Excel都用工作表来存储收集来分析的数据
统计学的类型
• 统计学
• 将数字转化为对决策者有用信息的数学的分支。
商务统计章节知识点总结

商务统计章节知识点总结第一章:统计学基础概念1.1 统计学的概念和作用统计学是一门研究数据收集、整理、分析和解释的学科,通过统计学的方法可以对数据进行分析和推断,以便做出科学决策。
在商务领域,统计学可以帮助企业分析市场、预测销售和制定营销策略。
1.2 统计学的基本原理统计学的基本原理包括总体和样本、变量、数据类型、测度尺度等内容。
理解这些基本原理对于进行商务统计分析非常重要。
1.3 统计学的应用范围统计学在商务领域有广泛的应用,包括市场调研、销售预测、风险评估、财务分析等方面。
第二章:数据类型和数据收集2.1 数据的类型数据可以分为定量数据和定性数据,定量数据可以进一步分为禺式数据和顺序数据,定性数据可以进一步分为名义数据和区间数据。
理解不同类型的数据对于选择合适的统计分析方法非常重要。
2.2 数据的收集方法数据的收集方法包括问卷调查、访谈、实地观察、记录和外部数据收集等。
在商务统计分析中,选择合适的数据收集方法对于数据的质量至关重要。
第三章:统计描述与概率分布3.1 描述统计描述统计是对数据进行整理、描述、总结和展示的过程,包括中心位置测度、离散程度测度、分布形态测度等内容。
在商务统计分析中,描述统计可以帮助我们了解数据的特征和规律。
3.2 概率分布概率分布描述了随机变量的取值及其对应的概率,包括离散型概率分布和连续型概率分布。
在商务统计分析中,概率分布可以帮助我们理解不同变量之间的关系和规律。
第四章:抽样与估计4.1 抽样方法抽样是指从总体中选取样本的过程,常用的抽样方法包括简单随机抽样、分层抽样、整群抽样和多阶段抽样等。
在商务统计分析中,选择合适的抽样方法对于大规模数据的分析非常重要。
4.2 估计估计是根据样本数据对总体参数进行估计的过程,包括点估计和区间估计两种方法。
在商务统计分析中,通过估计可以得到总体参数的近似值,用于制定决策和预测。
第五章:假设检验与单因素方差分析5.1 假设检验假设检验是用来检验统计结论的正确性的方法,包括参数假设检验和非参数假设检验两种方法。
第一章 商务统计学样本
e.g., Tables and graphs 分析图表
Characterize data(刻画数据的特征)
e.g., Sample mean =
X
n
i
(样本均值)
Chap 1-7
Business Statistics: A First Course, 5e © 2009 Prentice-Hall, Inc.
The types of data used in business 商业活动中使用数据 的类型 The basics of Microsoft Excel Excel基础 The basics of Minitab 统计软件Minitab基础
Cha Statistics: A First Course, 5e © 2009 Prentice-Hall, Inc.
Present and describe business data and information properly 正确的展示和描述商业数据的和信息(描述性统计) Draw conclusions about large groups of individuals or items, using information collected from subsets of the individuals or items. 利用收集到的个体或者商品的子集数据来推断有关更广范围内个体 或者商品的结论(推断统计) Make reliable forecasts about a business activity 为商业活动提供可靠的预测(推断统计) Improve business processes 改善商业活动的过程
Business Statistics: A First Course, 5e © 2009 Prentice-Hall, Inc.
商务统计学第一章

xx年xx月xx日
contents
目录
• 引言 • 商务统计学基本概念 • 数据类型与数据收集 • 数据的整理与可视化 • 概率论基础
contents
目录
• 统计推断基础 • 相关分析与回归分析 • 时间序列分析与预测 • 统计决策理论
01
引言
课程简介
商务统计学是统计学在商业和经济领域的应用,旨在培养学 生在商业和经济领域运用统计学方法解决实际问题的能力。
统计学的发展经历了描述性统计学、推断性 统计学和现代统计学三个阶段。
描述性统计学主要是对数据进行描述性统计 指标的计算和数据的可视化,推断性统计学 主要是通过样本信息对总体进行推断和分析 ,现代统计学则涉及到数据挖掘、机器学习
、时间序列分析等多个方面。
02
商务统计学基本概念
统计学的定义
统计学是一门收集、整理、分析和 解释数据的科学。
基于一组变量预测另一个变量的值。
选择变量、收集数据、建立模型、检 验模型、应用模型。
03
回归分析的基本假设
线性关系、误差项独立同分布、误差 项无序列相关性、解释变量与误差项 无多重共线性。
线性回归模型
线性回归模型的定义
一种用于预测的模型,将解释变 量与响应变量之间的关系建模为 线性关系。
线性回归模型的参数 估计
数据收集的方法
调查问卷
通过邮寄、网络或现场发放问卷, 收集相关数据
观察法
记录现场观察到的数据,如销售额 、客流量等
实验法
通过实验来测试不同因素对变量的 影响,如A/B测试
现有统计数据
从政府、企业或第三方机构获取相 关统计数据
数据收集的步骤
01
《应用商务统计》-课程教学大纲

《应用商务统计学》课程教学大纲一、课程基本信息课程代码:16045003课程名称:应用商务统计学英文名称:Applied Business Statistics课程类别:专业课学时: 48学分: 3适用对象: 国际商务专业考核方式:考试先修课程:《微积分》、《概率论与数理统计》二、课程简介应用商务统计学介绍在商务经济活动当中常用的统计描述和统计推断的方法。
主要内容包括如何使用图形和统计指标对数据进行整理和描述、抽样分布、点估计、区间估计、假设检验、列联表分析、方差分析、回归分析。
课程的教学中将介绍计算机统计分析软件EXCEL的使用和案例分析。
Applied Business Statistics introduces some statistical description and statistical inference methods used in business and economic activities. The main contents include how to use graphics and statistical indicators to organize and describe the data, sampling distribution, point estimation, interval estimation, hypothesis testing, contingency table analysis, variance analysis and regression analysis. The course will introduce the use of computer statistical analysis software EXCEL and the analysis of several cases. 三、课程性质与教学目的应用商务统计学是一门应用性统计学课程,系统论述了统计理论与方法在商务经济活动中的应用。
商务统计学ppt课件
精选ppt课件
17
统计的应用领域
hydrology(水文学)
industry(工学)
linguistics(语言学)
literature(文学)
manpower planning(劳动力计划)
management science(管理科学)
marketing(市场营销学)
medical diagnosis(医学诊断)
称
离散变量:取有限个值 连续变量:可以取无穷多个值
精选ppt课件
30
统计中的几个基本概念
总体(参数) 平均数 μ 标准差 σ 比例 Π
样本(统计量) ¯x s p
精选ppt课件
31
几个常用的统计软件 (software)
典型的统计软件
SAS SPSS MINITAB STATISTICA EXCEL
所研究的全部元素的集合,其中的每一个元素称为 个体
分为有限总体和无限总体
有限总体的范围能够明确确定,且元素的数目是有限的 无限总体所包括的元素是无限的,不可数的
2、样本(sample)
从总体中抽取的一部分元素的集合 构成样本的元素的数目称为样本容量
精选ppt课件
28
参数和统计量
1、参数(parameter)
商务统计学 Business Statistics
精选ppt课件
1
参考书籍:
• 商务统计学 戴维.M.莱文等著 贾俊平改编
•
中国人民大学出版社
• 统计学原理 谢启南 主编 暨南大学出版社
• 统计学原理 贾俊平 中国人民大学出版社
精选ppt课件
2
成绩评定方法
• 1.闭卷考试成绩(70%) • 2.平时作业、考勤和上机。(30%)
统计学(中英文)_ch01

Business Statistics, A First Course (4e) © 2006 Prentice-Hall, Inc.
Chap 1-12
∑X
n
i
Business Statistics, A First Course (4e) © 2006 Prentice-Hall, Inc.
Chap 1-8
Inferential Statistics 推断统计
Estimation 估计 e.g., Estimate the population mean weight using the sample mean weight 例如:利用采样的平均重量估计人口的平均体 重 Hypothesis testing 假设检验 e.g., Test the claim that the population mean weight is 120 pounds 例如:根据测试的要求,人口平均体重是120 磅
英文翻译乃自己所做, 英文翻译乃自己所做,有错误 之处请自行查证。 之处请自行查证。
Business Statistics, A First Course (4e) © 2006 Prentice-Hall, Inc.
Chap 1-1
Business Statistics, A First Course
Defined descriptive vs. inferential statistics 描述性统计和推理统计 Reviewed data types 回顾数据类型
♦ ♦ ♦ ♦
Categorical vs. Numerical data 绝对的和数值的数据 Discrete vs. Continuous data 离散的和连续的数据
统计学英文教学课件Chapter 1(商科)What is Statistics
Statistics Terminology
Population The collection of all possible individuals, objects, or measurements of interest
Sample A portion, or part, of the population of interest
• How to do it:
– Use random number table or random number generator, such as Excel • Assign numbers to population • Select n random numbers • Sample population elements that correspond to the random numbers
Methods of organizing, summarizing, and presenting data in an informative way.
Graphical & Tabular [Ch. 2] Numerical [Ch. 3]
22
Descriptive Statistics – Graphical
7
Levels of Measurement
Ordinal Data are rank-ordered, order is meaningful, differences between rankings not meaningful
Examples: Sports rankings, Earthquake magnitude [Richter scale]
SAMPLE
- 1、下载文档前请自行甄别文档内容的完整性,平台不提供额外的编辑、内容补充、找答案等附加服务。
- 2、"仅部分预览"的文档,不可在线预览部分如存在完整性等问题,可反馈申请退款(可完整预览的文档不适用该条件!)。
- 3、如文档侵犯您的权益,请联系客服反馈,我们会尽快为您处理(人工客服工作时间:9:00-18:30)。
– Quantitative: measurement of amount or quantity
– -定量:量或量的测量 • Discrete (counting) (# of family numbers): limited values in a range • 离散(计数)(#家属):在一个有限的范围值 • Continuous variable (measuring) (age, income): any value in a range •连续变量(测量)(年龄,收入):某一范围内的任何值
– Element: an entity or object on which data are collected. Also called case, subject, individual, item– 元素:收集数据的实体或对象。也称案件、主体、个人、项目
– Observation: measurement of a variable on a single element
Data Vocabulary数据的词汇
– Data: measurements that are collected, recorded, and summarized for presentation, analysis, and interpretation –
– 数据:收集、记录和总结用于陈述、分析和解释的测量
Ch0: First Things First and Ch1: Defining and collecting dataLearning Obje Nhomakorabeatives
• What is Statistics?什么是统计学 • Basic concepts in Statistics 统计学中的基本概念
– Data, variable, population, sample, parameter, statistic, etc… – 数据、变量、人口样本统计量、参数,等等……
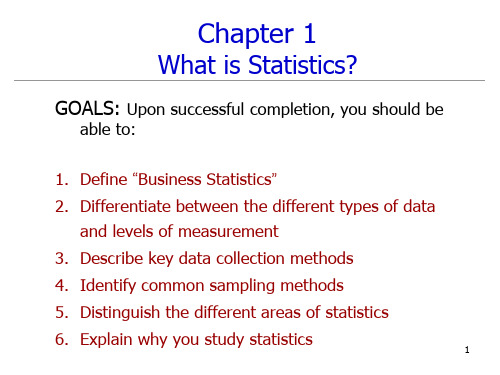
• 统计是一种可以带来更好决策的思维方式。
2
Why Statistics?
• In today’s digital world ever increasing amounts of data are gathered, stored, reported on, and available for further study.
– Business information systems
•在当今的数字世界中,越来越多的数据被收集、存储、报告,并可供进一步研究。 -商业信息系统
• You hear the word data everywhere.
• 你到处都听到“数据”这个词。
• Data are facts about the world and are constantly reported by an ever increasing number of sources.
No order
3.区间水平4.率水平
No true zero
Difference is meaningful
Absolute zero Difference is meaningful
Ratio is not meaningful Ratio is also meaningful
e.g. Eye color Rating of a professor
Integers? 整数?
10
Four Levels of Measurement
Amount
1。标称等级2。顺序层次
ordered/ ranked
测量的四个层次
o f I n f o r m a t i o n 信息量
水平/测量尺度
Levels/Scales of measurement
1. Nominal level 2. Ordinal level 3. Interval level 4. Ratio level
F
M M
8
Jaime
50
71,200 Public relations
F
8
Data Vocabulary
• Types of Variables变量类型
– Qualitative: labels or names for a characteristic (position, gender, name)
$67,100 Personnel director 56,500 Operations manager 88,200 Marketing VP 59,000 Statistician
5
6 7
Larry
Alicia Alex
46
52 65
36,000 Security guard
68,500 Comptroller 92,500 Chief executive
In this course we will use DCOVA
– Define the data you want to study in order to solve a problem or meet an objective – Collect the data from appropriate sources – Organize the data collected by developing tables – Visualize the data by developing charts – Analyze the data collected to reach conclusions and present results
– -观察:单个元素上变量的测量
7
5 variables
Case 1 2 3 4 Name Frieda Stefan Barbara Donna
8 subjects/elements/individuals/items
Data Vocabulary
40 observations
Gender F M F M Age 45 32 55 27 Income Position
• Data/variable types 数据/变量类型 • How to collect data如何收集数据 • The different ways to collect a sample收集样本的不同方 法 • The types of survey errors调查误差的类型
1
What is Statistics?
• Statistics refers to methods that help transform data into useful information for decision makers.
• 统计指的是帮助决策者将数据转化为有用信息的方法。
• Statistics is a way of thinking that can lead to better decisions.
• • • • • • • • Summarize & visualize business data 总结和可视化业务数据 Reach conclusions from those data 从这些数据中得出结论 Make reliable forecasts about business activities 对业务活动作出可靠的预测 Improve business processes 改进业务流程
– Variable: characteristic of the elements whose values may differ from element to element and is of interest to the data collector
– 变量:元素的特征,其值可能不同于元素到元素,并且对数据收集器感兴趣。
• 数据是关于世界的事实,并且不断地被越来越多的来源所报道。
3
To Properly Apply Statistics You Should Follow A Framework To Minimize Possible Errors
为了正确地应用统计数据,您应该遵循一个框架,以尽量减少可能出现的错误。
9
Data Vocabulary
变量类型 Variable types
定性的(名 义的,明确 的
Qualitative (Nominal, categorical)
Quantitative (Numerical) Discrete
定量 (数值)
Continuous
连续的
Words? 语言?
分离的,不相关联的
5
Business Analytics: The Changing Face Of Statistics 商业分析:统计数据的变化
• Use information systems methods to collect and process data sets of all sizes, including very large data sets that would otherwise be hard to examine efficiently. •使用信息系统方法收集和处理各种大小的数 据集,包括非常大的数据集,否则很难有效地检查这些数据集。 • Use statistical methods to analyze and explore data to uncover unforeseen relationships. •使用统计方法分析和探索数据,以发现 不可预见的关系。 • Use management science methods to develop optimization models that impact an organization’s strategy, planning, and operations. •使用管理 科学方法开发影响组织战略、规划和运作的优化模型。 • The growth of “Big Data” spurs the use of business analytics •“大数据 ”的增长刺激了商业分析的应用 • “Big data” or very large data sets are arising because of the automatic collection of high volumes of data at very fast rates. •“大数据”或非 常大的数据集的出现,是因为以非常快的速率自动收集大量数据 6 。