自动化专业期刊
自动化核心期刊

自动化核心期刊引言:随着科技的发展,自动化技术日益深入到各个领域,对工业、农业、服务业等产生了深远的影响。
在学术界,关于自动化的研究也日益受到关注。
本文将探讨自动化核心期刊,深入剖析其价值与影响。
正文:自动化核心期刊的定义与重要性自动化核心期刊是指专注于自动化技术领域的学术期刊,主要刊载自动化技术领域的最新研究成果、学术论文、技术进展和行业动态。
随着自动化技术的迅猛发展,自动化核心期刊成为了解和研究该领域的重要信息来源。
它对学术交流、推动科技创新和产业升级起到了重要作用。
自动化核心期刊的内容特点内容专业性:期刊主要围绕自动化技术的理论与实践,涵盖了控制理论、智能系统、机器人技术、传感器技术等多个专业方向。
学术前沿性:期刊致力于发表本领域的最新研究成果,引导学术潮流,推动技术创新。
实践指导性:除了理论研究成果,期刊还注重发表具有实际应用价值的技术文章,对产业界有重要指导意义。
自动化核心期刊的影响力学术影响力:被引用次数、影响因子等评价指标反映了其在学术界的地位和影响力。
产业影响力:自动化核心期刊为产业界提供了前沿的科技信息和实用的技术指导,推动了产业的发展和升级。
国际影响力:自动化核心期刊的国际化程度高,为国际学术交流和技术合作提供了平台。
如何选择合适的自动化核心期刊根据研究方向选择:针对自己的研究领域和方向,选择专注于该领域的自动化核心期刊。
参考影响因子和被引次数:关注期刊的影响因子和被引次数,这些数据可以帮助评估期刊的学术价值和影响力。
浏览期刊的论文内容:通过浏览期刊已发表的论文,了解其论文风格、审稿流程和发表周期等。
自动化核心期刊的发展趋势随着科技的不断进步,自动化核心期刊将更加关注跨学科研究和交叉领域的应用。
例如,自动化技术与大数据、云计算、人工智能等新兴技术的结合,将成为未来的研究热点。
绿色自动化和可持续发展将成为重要议题,推动自动化技术在环保、节能等方面的应用研究。
国际化合作与交流将进一步加强,促进全球范围内自动化技术的共同进步。
电气工程与自动化工程的学术期刊对比

电气工程与自动化工程的学术期刊对比在电气工程与自动化工程领域,学术期刊是研究人员发表研究成果、分享新知识的重要平台。
随着学术界的发展和技术进步,越来越多的学术期刊涌现出来,为学术交流提供了更多的选择。
本文将对电气工程与自动化工程领域的学术期刊进行对比分析,旨在帮助读者选择适合自己的学术期刊。
一、学术期刊的背景与特点电气工程与自动化工程是技术密集型领域,学术期刊在该领域的发展具有一定的特点。
首先,电气工程与自动化工程涵盖了诸多学科,包括电力系统、电机与电力电子、控制与自动化等,因此学术期刊的数量众多。
其次,由于该领域的迅猛发展,学术研究成果更新换代快,因此学术期刊的发表周期较短。
此外,电气工程与自动化工程的学术期刊一般着眼于实际应用和工程设计,注重技术的可行性和经济性。
二、国内电气工程学术期刊对比1.《电机与控制学报》《电机与控制学报》是电气工程领域的重要学术期刊之一,发表电机与控制方面的研究论文。
该期刊注重理论与应用相结合,对电机与控制技术的研究进行深入探讨。
该期刊发表的论文内容通常具有较高的技术含量和工程实用性,适合电气工程专业的研究人员。
发表周期一般为3-6个月,审稿周期较短。
2.《电力系统自动化》《电力系统自动化》是电力系统与自动化领域的顶级期刊,发表电力系统与电力自动化方面的研究论文。
该期刊在国内电力系统领域有较高的声誉,期刊内容涵盖电力系统建模与仿真、电力系统稳定性分析、智能电网等方面。
发表的论文通常具有较高的学术水平和科研价值,适合电力系统与自动化专业的研究人员。
发表周期一般为4-6个月,审稿周期相对较长。
三、国际电气工程学术期刊对比1.《IEEE Transactions on Power Systems》《IEEE Transactions on Power Systems》是国际上电力系统领域的顶级学术期刊,属于IEEE旗下的重要刊物。
该期刊发表电力系统与智能电网等方面的研究论文。
电气工程与自动化专业的学术期刊排名

电气工程与自动化专业的学术期刊排名学术期刊是学术界进行研究、学术交流和学术成果分享的重要平台。
对于电气工程与自动化专业的学生和学者来说,了解该领域的学术期刊排名可以帮助他们选择适合自己的研究方向、增加论文发表的机会以及与相关领域专家进行学术交流。
本文将介绍一些电气工程与自动化领域的知名学术期刊,并就其排名进行评述。
一、IEEE Transactions on Industrial Electronics(SCI Q1)IEEE Transactions on Industrial Electronics(简称TIE)是由IEEE (Institute of Electrical and Electronics Engineers)出版的一本国际学术期刊,涵盖了电气工程领域的工业电子和自动化技术。
作为该领域的顶级期刊之一,TIE在工业电子、电力电子、自动化控制和机器人方面的研究成果发表较多,影响力较大。
二、IEEE Transactions on Power Electronics(SCI Q1)IEEE Transactions on Power Electronics(简称TPEL)是IEEE出版的一本权威学术期刊,涵盖了电力电子与电能转换领域的研究。
该期刊主要关注电力电子技术的进展、拓展和应用,包括电源技术、电力转换、能源管理等方面的研究。
TPEL在电力电子学术领域有较高的声誉和影响力。
三、Automatica(SCI Q1)Automatica是一个国际性学术期刊,涵盖了自动控制领域的多个学科。
该期刊发表与控制理论、自动化系统、信号处理以及相关领域相关的高质量学术论文。
Automatica是自动控制领域的知名期刊之一,对于电气工程与自动化专业的学者来说,发表在该期刊上的论文将有利于其学术声誉的提高。
四、International Journal of Electrical Power and Energy Systems(SCI Q1)International Journal of Electrical Power and Energy Systems(简称IJEPE)是关于电力和能源系统方面的国际性学术期刊。
自动化专业文献

自动化专业文献自动化专业是一门涉及自动控制、机器人技术、人工智能等领域的学科,其研究内容包括自动化系统的设计、开辟和应用。
本文将介绍自动化专业的相关文献,包括研究动态、学术期刊、会议论文等。
一、研究动态自动化专业的研究动态主要包括学术研究的最新发展、技术应用的实践案例等。
近年来,自动化领域涌现出许多重要的研究成果,例如机器学习在自动控制中的应用、智能化创造系统的发展等。
这些研究成果对于推动自动化技术的发展具有重要意义。
二、学术期刊学术期刊是自动化专业研究成果发表的重要渠道,以下是几个国际知名的自动化学术期刊:1. IEEE Transactions on Automatic Control(IEEE自动控制学报):该期刊是自动控制领域的顶级期刊,发表了许多重要的自动化研究成果,包括控制理论、控制系统设计与应用等方面的论文。
2. Automatica(自动化学报):这是一本综合性的自动化学术期刊,涵盖了自动控制、机器人技术、人工智能等多个方向的研究成果。
3. Control Engineering Practice(控制工程实践):该期刊关注自动化技术在实际工程应用中的应用与实践,发表了许多有关自动化系统设计与实现的案例分析和经验总结。
三、会议论文学术会议是自动化专业学者交流研究成果的重要平台,以下是几个国际知名的自动化学术会议:1. IEEE Conference on Decision and Control(IEEE决策与控制会议):该会议是自动控制领域的顶级会议之一,汇集了世界各地的自动化专家学者,分享最新的研究成果和技术应用。
2. International Conference on Robotics and Automation(国际机器人与自动化会议):这是一个专注于机器人技术与自动化领域的国际会议,涵盖了机器人控制、感知与导航、智能机器人等多个方向的研究内容。
3. IFAC World Congress(国际自动控制联合会世界大会):该会议是国际自动控制领域的重要盛会,每年举办一次,吸引了全球自动化领域的顶级学者和专家参预。
电气工程与自动化专业的学术期刊论文发表和引用情况的比较

电气工程与自动化专业的学术期刊论文发表和引用情况的比较近年来,电气工程与自动化专业在学术界和工业界都得到了广泛关注和应用。
众多专业学术期刊成为电气工程与自动化领域的重要发布平台,为研究者提供了一个交流与分享的平台。
然而,不同学术期刊的质量和影响力存在差异,本文将就电气工程与自动化专业的学术期刊论文发表和引用情况展开比较分析。
首先,我们来比较三个主要学术期刊在论文发表方面的情况。
这三个期刊分别是《电气工程与自动化研究》、《自动化与电气工程学报》和《电气与能源系统研究》。
这三个期刊都是该领域的顶级期刊,具有较高的影响力和学术声誉。
然而,根据最新的统计数据显示,这三个期刊在过去五年发表的论文数量存在明显差异。
其中,《电气工程与自动化研究》每年发表的论文数量较多,占比约为40%;而《自动化与电气工程学报》次之,占比约为30%;最后,《电气与能源系统研究》发表的论文数量最少,只占比约为20%。
这一比较表明,《电气工程与自动化研究》在论文发表方面处于较为领先的地位。
其次,我们将比较这三个期刊在论文引用方面的情况。
引用是衡量一篇论文影响力的重要指标,也是评价学术期刊质量的重要依据之一。
根据最新的引用数据,我们可以发现,《电气与能源系统研究》在论文引用方面的表现最佳,被引频次最高,大约占总引用次数的50%;其次是《电气工程与自动化研究》,被引频次约占总引用次数的30%;而《自动化与电气工程学报》则相对较低,只占总引用次数的20%。
这一比较结果表明,《电气与能源系统研究》在论文影响力方面处于领先地位。
综合分析以上数据,我们可以得出总结:《电气工程与自动化研究》是三个主要学术期刊中在论文发表方面最多、论文引用方面次多的期刊;《自动化与电气工程学报》在论文发表方面居中,但在论文引用方面较为落后;而《电气与能源系统研究》则在论文引用方面表现最佳,但论文发表数量相对较少。
因此,研究者在选择投稿期刊时,需要根据自身研究领域和目标读者群体的需求,权衡选择合适的期刊。
电力系统自动化(国网电力科学研究院主办专业技术期刊)

办刊条件
栏目方向
人员编制
能源互联网,智能电网,信息能源系统,电力系统规划、运行、分析与控制,交直流输电,智能配用电,分 布式发电与微电网,智能调度,厂站自动化,继电保护,绿色电力自动化(包括清洁能源并网、碳排放及管理、 节能与环保等),电力市场,电能质量,以及电力电子、信息通信技术、智能化仪器仪表在电力系统中的应用等。
《电力系统自动化》主要栏目有观点,综述,学术研究,研制与开发,工程应用,新技术新产品,讨论园地, 微文,信息动态等,以及针对行业技术发展和热点课题的特约专稿、专辑、专题等。
据2018年6月《电力系统自动化》编辑部官网显示,《电力系统自动化》编辑委员会拥有学术顾问17人,委 员48人。
办刊成果
收录情况 研究发表
据2018年6月8日中国知网显示,《电力系统自动化》共出版文献12847篇。 据2018年6月8日万方数据知识服务平台显示,《电力系统自动化》载文量为10361篇。 《电力系统自动化》发行至全国各省、市、自治区和港澳台地区,中国以外发行至北美、欧洲和亚太地区数 十个国家。
据2018年6月8日中国知网显示,《电力系统自动化》总被下载5158580次、总被引351873次;(2017版)复 合影响因子为3.953、(2017版)综合影响因子为2.924。
电力系统自动化(国网电力科 学研究院主办专业技术期刊)
国网电力科学研究院主办专业技术期刊
01 办刊历史
03 办刊成果 05 现任领导
目录
02 办刊条件年,由国家电网有限公司主管,国网电力科学研究院有限公司主办的电气工 程学科期刊。
据2018年6月《电力系统自动化》编辑部官网显示,《电力系统自动化》编辑委员会拥有学术顾问17人,委 员48人。
计算机核心期刊排名
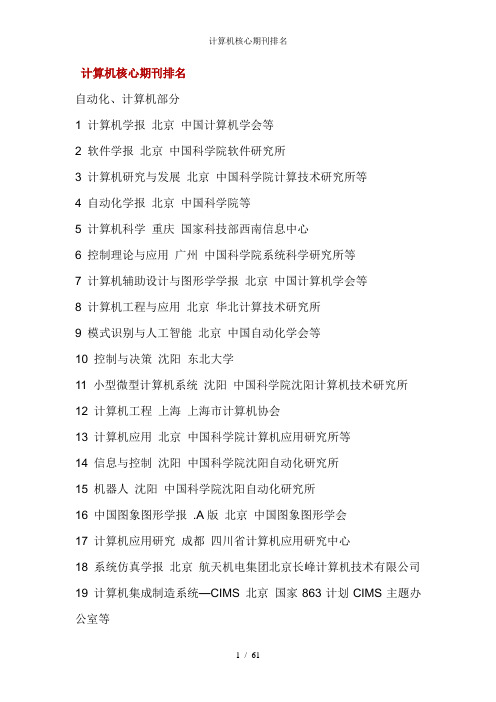
计算机核心期刊排名自动化、计算机部分1 计算机学报北京中国计算机学会等2 软件学报北京中国科学院软件研究所3 计算机研究与发展北京中国科学院计算技术研究所等4 自动化学报北京中国科学院等5 计算机科学重庆国家科技部西南信息中心6 控制理论与应用广州中国科学院系统科学研究所等7 计算机辅助设计与图形学学报北京中国计算机学会等8 计算机工程与应用北京华北计算技术研究所9 模式识别与人工智能北京中国自动化学会等10 控制与决策沈阳东北大学11 小型微型计算机系统沈阳中国科学院沈阳计算机技术研究所12 计算机工程上海上海市计算机协会13 计算机应用北京中国科学院计算机应用研究所等14 信息与控制沈阳中国科学院沈阳自动化研究所15 机器人沈阳中国科学院沈阳自动化研究所16 中国图象图形学报 .A版北京中国图象图形学会17 计算机应用研究成都四川省计算机应用研究中心18 系统仿真学报北京航天机电集团北京长峰计算机技术有限公司19 计算机集成制造系统—CIMS 北京国家863计划CIMS主题办公室等20 遥感学报 .北京中国地理学会环境遥感分会,中国科学院遥感应用研究所21 中文信息学报北京中国中文信息学会22 微计算机信息北京中国计算机用户协会,山西协会23 数据采集与处理南京中国电子学会等24 微型机与应用北京信息产业部电子第6研究所25 传感器技术哈尔滨信息产业部电子第49研究所26 传感技术学报南京国家教委全国高校传感技术研究会,东南大学27 计算机工程与设计北京航天工业总公司706所28 计算机应用与软件上海上海计算技术研究所等29 微型计算机重庆科技部西南信息中心30 微电子学与计算机西安中国航天工业总公等影响因子计算机学报0.921软件学报 0.919计算机集成制造系统一CIMS 0.855计算机研究与发展 0.806计算机辅助设计与图形学学报 0.692中文信息学报 0.635中国图象图形学报 0.616计算机应用研究 0.428计算机测量与控制 0.406模式识别与人工智能 0.39计算机与应用化学 0.388J COMPUT SCI&TECH 0.33计算机应用 0.329计算机工程与应用 0.28计算机科学 0.28小型微型计算机系统 0.275物探化探计算技术 0.239计算机工程与科学 0.234 计算机工程 0.232计算机仿真 0.206计算机工程与设计 0.203微型电脑应用 0.134数值计算与计算机应用 0.123计算机辅助工程 0.098微型机与应用 0.096微计算机应用计算机中文核心详细版(2)计算机类中文核心期刊简介在实际工作中,常有些读者在职称评审、投稿、申报项目时,需要查找计算机类中文权威、核心期刊目录或编辑部地址、联系方式等,现汇编、整理了这份“计算机类中文核心期刊简介”,供参考。
自动化专业文献

自动化专业文献自动化是一门涉及控制系统和自动化设备的学科,它的发展对于现代工业和生活的方方面面都有着重要的影响。
为了深入了解自动化专业的相关知识和最新研究成果,我们需要阅读和研究相关的文献。
本文将为您提供一份关于自动化专业文献的详细介绍,包括文献的来源、内容和研究方法等方面的信息。
一、文献来源1. 学术期刊:学术期刊是自动化专业研究的重要来源之一。
在自动化领域,有许多著名的学术期刊,如《自动化学报》、《控制理论与应用》等。
这些期刊发表了大量的自动化专业研究论文,包括理论研究、应用实践、技术创新等方面的内容。
2. 会议论文集:自动化专业的学术会议也是获取文献的重要途径。
在自动化领域,有许多国际和国内的学术会议,如国际自动化与控制会议(ICAC)、中国自动化大会等。
这些会议的论文集收录了大量的自动化专业研究成果,是了解最新研究动态的重要参考资料。
3. 学位论文:学位论文是研究生在攻读硕士或博士学位时撰写的重要成果。
在自动化专业,许多研究生会选择自动化相关的课题进行深入研究,并撰写学位论文。
这些学位论文通常包含了对特定问题的深入研究和探索,是了解某一领域研究的重要参考文献。
二、文献内容自动化专业的文献内容涵盖了广泛的领域,包括但不限于以下几个方面:1. 控制理论与应用:自动化专业的核心内容之一是控制理论与应用。
相关文献涵盖了控制系统的设计、控制算法的研究、控制策略的优化等方面的内容。
例如,一篇文献可以介绍一种新的控制算法在某个特定系统中的应用效果,或者提出一种改进的控制策略来提高系统的性能。
2. 传感器与测量技术:自动化领域的另一个重要方向是传感器与测量技术。
相关文献可以介绍不同类型的传感器原理、测量方法以及应用案例等内容。
例如,一篇文献可以介绍一种新型传感器的工作原理和性能指标,或者提出一种新的测量方法来解决某个特定问题。
3. 自动化系统与应用:自动化系统在现代工业和生活中的应用非常广泛。
相关文献可以介绍不同类型的自动化系统,如工业自动化系统、家庭自动化系统等,并探讨其应用案例和效果评估等内容。
- 1、下载文档前请自行甄别文档内容的完整性,平台不提供额外的编辑、内容补充、找答案等附加服务。
- 2、"仅部分预览"的文档,不可在线预览部分如存在完整性等问题,可反馈申请退款(可完整预览的文档不适用该条件!)。
- 3、如文档侵犯您的权益,请联系客服反馈,我们会尽快为您处理(人工客服工作时间:9:00-18:30)。
Partial discharges and noise separation in high frequency signals using inductive sensorsJ.M. Martínez-Tarifa1, M. Rojas,G. RoblesDepartment of ElectricalEngineering Universidad Carlos III de Madrid Leganés (Madrid), Spainjmmtarif@ing.uc3m.es1. B. MacPherson, P. Moore.Elimpus Ltd,Bellshill, United KingdomI. Portugués.Electric Power Research Institute,United States of AmericaAbstract—Partial discharges in high voltage equipment are a cause and consequence of premature ageing. Thus, its accurate measurement is an important diagnosis tool trying to avoid premature failures. Classical phase resolved patterns are now completed with pulse waveform analysis in order to discriminate between PD sources and PD from noise. For this purpose, high frequency inductive sensors are being used in recent years. In this paper, a fixed post-processing technique for PD pulse waveforms will be used to discriminate between discharges from electrical noise for two inductive sensors: a commercial High Frequency Current Transformer and a newly developed inductive loop sensor. Results will prove that this novel inductive loop sensor is able to discriminate PD from electrical noise for several test objects.Keywords-component; partial discharges, electrical insulation, inductive sensor, pulse shape analysis, noise rejection.I.I NTRODUCTIONElectrical equipment is usually exposed to several stresses through its whole lifetime. These devices (e.g. electrical machines and power cables) do not withstand voltages above their defined limits (dielectric strength) but, in addition to this, some of them show unexpected failures within their insulation systems at their rated voltages. A known source of insulation degradation are Partial Discharges (PD), that are a result of impurities or inhomogeneous areas inside insulation systems subjected to rated high voltages [1]. This phenomenon is a microscopic ionization localized at these sites, so they do not immediately lead to insulation breakdown; on the contrary, they are responsible for accelerated ageing through ion and electronic bombardment and resulting chemical attack [2].Partial discharges are not only a cause, but a symptom of insulation degradation, so their measurement is an important technique for power equipment status assessment [3]. Conventional PD measuring systems detect the discharge pulse amplitude and represent it in a phase resolved pattern which is used for PD source identification. These systems are typically bandwidth limited to 400 kHz.In order to help in PD interpretation it must be taken into account that not all kinds of PD are harmful for a long term operation of the equipment. In addition to this, PD measurements are commonly made on-line, so high levels of noise are always present in PD measurements [4]. Thus, conventional Phase Resolved Partial Discharge (PRPD) patterns sometimes cannot help in insulation diagnosis; furthermore, rejecting noise by means of increasing the trigger level is not reliable for PD detection in industrial environments because this means withdrawing low-magnitude PD pulses, that are more probable [1].For these reasons, modern techniques have been developed to process PD pulse waveform information from high frequency sensors [5], [6], [7], [8]. These devices provide complementary information to conventional PRPD patterns for PD detection and classification. The most commonly used sensor is the High Frequency Current Transformer (HFCT), but other recently developed inductive loop sensors have been proposed as well [9]. Despite these loop sensors show less sensitivity, they are a cheaper approach for high frequency pulse detection than HFCTs, and do not suffer from saturation when applied to power cables feeding electrical equipment diagnosed on-line.In this paper, PD pulse waveforms will be processed in order to distinguish them from noise pulses. This will be done using a previous technique proposed for pulse classification [5]. These pulses will be measured by means of an HFCT and an Inductive Loop Sensor (ILS). In this paper, the ILS pulse separation capability will be compared to that from HFCT for different test objects.II.E XPERIMENTAL SETUPPartial discharges have been measured in a classical indirect detection circuit, where high frequency pulses from ionization flow through the capacitive mesh formed by test object, and capacitive divider. A commercial PD detection circuit has been used in order to check PD activity in the test object. The inductive loop and the HFCT are placed at the low voltage terminal connecting the measurement impedance and ground (see Fig. 1).This research has been supported by the Spanish Science and Technology Ministry under Contract No. DPI 2009-14628-C03-02. Tests have been carried out in the High Voltage Research and Tests Laboratory at Universidad Carlos III de Madrid (LINEALT). The research stage of Technician Brian MacPherson was financed by Elimpus Ltd.978-1-4577-1772-7/12/$26.00 ©2012 IEEEFigure 1.- Experimental setup for PD measurements.The flow of charge due to PD produces currents in the parallel main ground conductor; this leads to a transient magnetic field that links the areas of both sensors.In the case of the ILS, the output signal corresponds to an inductive electromotive force that is proportional to the time rate of change of PD current, (1). M is the mutual inductance between the ILS and the conductor where the current flows.·(1)This ILS is connected to a 50 Ω oscilloscope channel that modifies the sensor output limiting its derivative response. According to the equivalent circuit of the Fig 2, the quotient of output voltage to the input PD current is determined by (2) in the Laplace domain.2where R o is the channel resistance and L the loop inductance.Figure 2.- Electric equivalent circuit.Initially, ILS response is derivative until a corner frequency, f c, (3). Afterwards, the effect of the reactive impedance is higher than that of the resistive one, so the output signal begins to be proportional to the current. Fig. 3 shows the frequency response of the ILS used in this paper. It has a derivative output up to 35 MHz, which is most of the PD inductive spectrum. More details about the sensor parameters and dimensions are presented in [9].23Figure 3.- Frequency response of the inductive sensor. The experimental data (dotted plot) and the theoretical data (solid data). [9].Regarding the HFCT, its output signal is always proportional to the current due to its large inductance. The HFCT used in this experimental work is a Techimp Systems S.r.l. clamp HFCT 39 with a bandwidth up to 40 MHz. Thus, for almost the same frequency interval, the ILS response provides an output signal that is the derivative of the HFCT signal.Since PD pulses will be measured by means of both sensors, the response of the commercial HFCT and this new ILS to the same discharge phenomenon will be compared.III.TEST SPECIMENSPartial discharge and noise waveforms depend on the test object, since its equivalent electrical network may change the response to ionization current from discharge sites. Thus, instrumentation techniques devoted to PD measurements must be proven on different test objects. In this paper tests were done on three insulation systems representing some of the main PD phenomena found in electrical insulation systems [10]:a)Corona PD. Typically produced near the tip in point-gas-plane setups or in highly divergent field zones. They are the result of local ionizations in the gas volume.b)Surface PD. Associated with gas ionization along a path on a solid dielectric-gas interface. They appear in bushings, outdoor insulators and in electrical machines windings.c)Internal PD. Produced in gaseous voids surrounded by solid insulation, normally in non-homogeneous insulating materials or due to unavoidable air impurities inside epoxy resins or polyethylene.Partial discharges are a stochastic phenomenon, whose behaviour changes for the same applied voltage and test objects. Temperature, humidity and dielectric material degradation change the PD response. In addition to this, noise sources are not unique and different noise pulse waveforms may be recorded as well. Thus, several measurements for the same test object and applied voltage are needed to get statistically reliable data. In this paper, 10 measurements ofpartial discharges, 10 from electrical noise and 10 lowmagnitude PD (superimposed on noise) have been recorded, in order to get a first approximation to the capability of the sensor to separate PD.A.Corona discharge setupIn this experimental setup, a 0.5 mm thick needle was placed above of a wide metallic ground plane. The air gap was adjusted with a screw to 4mm.B.Surface discharge setupThese discharges were generated using a wide (1m x 1m) polyethylene (PE) sheet 2 mm thick placed on a wider metallic ground plane. A 2 cm diameter electrode connected to a high voltage source is placed on this sheet. This provides a high electric field and an easy path to ground through the surface of the polyethylene layer. Surface discharges will appear in these paths due to the roughness of the layer, dust and other impurities.C.Internal discharge setupThe setup to generate internal discharges consists of three glued insulating papers 0.4 mm thick, typically used in high voltage generators as slot insulation systems. The papers are placed between two heavy metallic electrodes so they are pressed together. The central paper was pierced with a needle, creating a hole measuring 1 mm in diameter with a circular shape. Thus, the test object will have a disk-shaped void created inside the solid insulation system and will guarantee the generation of internal PD at moderate voltage levels.IV.PULSE WAVEFORM MEASUREMENTS In these experiments, Partial Discharge Inception Voltage (PDIV) was measured for all test objects using classical PRPD patterns from the commercial measuring system. Pulses detected below PDIV were electrical noise, whereas pulses above this voltage level were PD, noise or the superposition of both. Higher trigger levels for voltages well above PDIV lead to clear discharge waveforms, but pulses detected for lower trigger levels may be noise, or low magnitude PD superimposed on noise. For voltages below PDIV, the highest amplitude noise pulses were recorded, in order to get the worst case for PD-noise separation. These noise pulses are high magnitude and sporadic bursts that are present in the High Voltage Laboratory, so the noise level superimposed to low magnitude PD is different from the noise level presented in the worst case.Pulse waveforms for all test objects were recorded. The response to PD from HFCT and ILS will be compared in the following traces. For clarity, only a selection of characteristic pulses for one test object will be shown.A.Corona discharges and noise pulses measurementsFor voltages below PDIV (2400 V), different kinds of waveforms were acquired with an oscilloscope. Typical noise signals are shown in Fig. 4.When the voltage was raised above PDIV, clear PD were observed. These waveforms are very repetitive, as can be seen in Fig. 5. In addition to this, low-magnitude discharges superimposed to noise were observed as well, Fig. 6.As can be seen from Figs. 4-6, detected noise pulses can have higher magnitudes than clear corona discharge pulses. Thus, low magnitude PD are difficult to detect just controlling the trigger level and PD pulse processing techniques will be especially useful.Figure 4.- Noise pulses for corona discharge test measured with ILS (blue plot) and HFCT (brown plot). The vertical scales are 20 mV/div and 100 mV/div for ILS and HFCT, respectively; 80ns/div in horizontal scale.Figure 5- PD pulses for corona discharge test measured with ILS (blue plot) and HFCT (brown plot). The vertical scales are 5 mV/div and 20 mV/div for ILS and HFCT, respectively; 80ns/div in horizontal scale.Figure 6- Low-magnitude PD pulses for corona discharge test measured with ILS (blue plot) and HFCT (brown plot). The vertical scales are 5 mV/div and20 mV/div for ILS and HFCT, respectively; 80ns/div in horizontal scale.B.Surface discharges and noise pulses measurementsThe experimental procedure from point-plane geometry was repeated for the polyethylene sheet stressed by means of one low-diameter steel electrode. Noise waveforms detected for voltages below PDIV and partial discharges measured for 1200 V of applied voltage are not shown now for sake ofbriefness.C. Internal discharges and noise pulses measurementsNoise, low magnitude and high magnitude PD pulses were also measured for the three glued papers acquiring ten measurements from each case.V.NOISE REJECTION CAPABILITY . C LUSTERINGTECHINQUES .Pulse waveform analysis provides helpful information regarding PD source separation and PD-noise rejection. A successful example of the application of these techniques is the clustering analysis developed by [5], where two parameters related to pulse waveforms are used to classify signals in a two dimensional map.In this approach, each detected signal u(t) and its Fast Fourier Transform U(f) is sampled K times (sampling frequency 1.25GHz). The statistical time position of the signal t 0 is calculated as follows:∑4 This is used for the calculation of the equivalent time length T and the equivalent bandwidth BW of the signal:∑ · 5 ∑ ·| | ∑|| 6 In this paper, the T-BW maps have been slightly modified in order to represent both magnitudes in units of seconds. For this purpose, the inverse of the equivalent bandwidth T’=1/BW has been used as the second pulse indicator.The results of applying this processing technique to pulses measured with HFCT and ILS are presented in the Fig. 7-9. It is clearly seen that both sensors provide different clusters for noise (+) and high magnitude PD pulses (*), so noise rejection is possible with these devices; this holds even for corona discharges, where many noise pulses amplitudes were higher than most detected discharges (see Fig. 4 and 5). For ILS measurements, low magnitude PD (green Δ) are clearly overlapped to the high magnitude PD cluster for corona discharges or define a completely different cluster for internal and surface discharges. This means that the inductive loop sensor is capable of distinguishing low magnitude PD from noise in each scenario. On the other hand, the same low magnitude pulses create a cluster that is clearly overlapped to noise pulses clusters when they are measured using the HFCT for the three test objects. Thus, ILS allows the detection of low magnitude PD without confusing them as noise and performs better than HFCT. The derivative response to PD current pulses from the ILS gives better frequency components for PD-noise separation using the currently commercial techniques proposed by [5].Figure 7.- T-T’ maps for corona discharge setup. Results for HFCT (up) andILS (down) measurements. PD (blue *), noise (red +) and low magnitude PD(green Δ).Figure 8.- T-T’ maps for surface discharge setup. Results for HFCT (up) and ILS (down) measurements. PD (blue *), noise (red +) and low magnitude PD(greenΔ).Figure 9.- T-T’ maps for internal discharge setup. Results for HFCT (up) and ILS (down) measurements. PD (blue *), noise (red +) and low magnitude PD(green Δ).VI.CONCLUSIONS AND FUTURE WORK.In this paper, partial discharge pulse waveform analysis has been used to aid in PD recognition. The novel inductive loop sensor has shown a proper response to discriminate between high magnitude noise pulses and high magnitude discharges. Moreover, the difficult task of noise rejection when detecting low magnitude PD can be accomplished using this inductive loop sensor in a reliable way. The authors have shown that the pulse processing techniques commercially available in some detection equipments to deal with PD recognition are compatible and appropriate for this new and inexpensive inductive sensor. This study shall be extended to PD source classification when several discharge sites (for example, corona and internal PD) are simultaneously active. For this objective, PD digital acquisition systems able to detect and process hundreds of pulses per second must be used.R EFERENCES[1]Bartnikas, McMahon; “Engineering Dielectrics: Volume I, CoronaMeasurement and Interpretation”; 1979; ASTM; Philadelphia; pp 23-66. [2]Morshuis P.; “Degradation of Solid Dielectrics due to internal partialdischarge: Some thoughts on progress made and where to go now”;IEEE Transactions On Dielectrics and Electrical Insulation; 2005; Vol 12; pp 905-913.[3]IEC 60270; “High Voltage Test Techniques. Partial DischargeMeasurements”; 2000 ; 3.0 Ed.[4]Stone G., Boutler E.A., Culbert I., and Dhirani H.; “Electrical Insulationfor Rotating Machines: Design, Evaluation, Aging, Testing and Repair”; IEEE Press Series on Power Engineering, Wiley Interscience;2004; New Jersey; pp 295-307.[5]Contin A., Cavallini A., Montanari G.C., Pasini G., Pulleti F.; “Digitaldetection and fuzzy classification of partial discharge signals”; IEEE Transactions on Dielectrics and Electrical Insulation; 2002; Vol.9; pp 335-348.[6]Okubo H., Hayakawa N; “A Novel Technique for Partial Discharge andBreakdown Investigation Based on Current Pulse Waveform Analysis”;IEEE Transactions on Dielectrics and Electrical Insulation; August 2005; Vol.12; pp 736-744.[7]Evagorou, D., Kyprianou, A., Lewin, P.L., Stavrou, A., Efthymiou, V.,Metaxas, A.C., Georghiou, G.E.; “Feature extraction of partial discharge signals using the wavelet packet transform and classification with a probabilistic neural network ”; IET Science Measurement and Technology; May 2010; Vol. 4; pp 177–192.[8]Zhang, Z.S., Xiao, D.M., Li, Y.; “Rogowski air coil sensor technique foron-line partial discharge measurement of power cables ”; IET Science Measurement and Technology; May 2009; Vol. 3, pp 187-196.[9]M. Rojas-Moreno, G. Robles, B. Tellini, C. Zappacosta, J.M.Martínez-Tarifa, and J.Sanz-Feito; “Study of an Inductive Sensor for Measuring High Frequency Current Pulses”; IEEE Transactions on Instrumentation and Measurement; 2011; vol. 60; pp 1893-1900.[10]Kreuger F.H.; “Partial Discharge Detection in High-VoltageEquipment”; Butterworth & Co.; Kent; 1989; pp 52-102.。