超辐射发光二极管
半导体激光器的应用与分类
半导体激光器的应用与分类半导体光发射器是电流注入型半导体PN结光发射器件,具有体积小、重量轻、直接调制、宽带宽,转换效率高、高可靠和易于集成等特点,被广泛应用。
按照其发光特性,可分为激光二极管(又称半导体激光器或二极管激光器,Laser Diode,LD),通常光谱宽度不]于5nm(采取专门措施可不大于0.1nm);发光二极管(Light Emitting Diode,LED),光谱宽度一般不小于50nm;超辐射发光二极管(Superluminescent Dmde,SLD),光谱宽度不大于5nm(采取专门措施可不大于0.1nm);发光二极管(Light Emiltting,LED),光谱宽度一般不小于50nm;超辐射发光二极管(Superluminescent SLD),光谱宽度为30~50nm,本节重点介绍几种半导体激光器,钽电容简要介绍超辐射发光二极管。
半导体激光器的分类有多种方法。
按波长分:中远红外激光器、近红外激光器、可见光激光器、紫外激光器等;按结构分:双异质结激光器、大光腔激光器、分布反馈激光器、垂直腔面发射激光器;按应用领域分:光通信激光器、光存储激光器、大功率泵浦激光器、引信用脉冲激光器等;按管心组合方式分:单管、阵列(线阵、面阵);按注入电流工作方式分:脉冲、连续、准连续等。
LD主要技术摄技术指标有光功率、中心波长、光谱宽度、阈值电流、工作电流、工作电压、斜率效率和电光转换效率等。
半导体激光器的光功率是指在规定驱动电流条件下输出的光功率,该指标直接与工作电流对应,这体现了半导体激光器的电流驱动特性。
如果是连续驱动条件,T491T336M004AT则输出功率就是连续光功率,如果是脉冲驱动条件,输出的光功率可用峰值功率或平均功率来衡量。
hymsm%ddz半导体激光器的中心波长是指激光器所发光谱曲线的中心点所对应的波长,通常用该指标来标称激光器的发光波长。
光谱宽度是标志个导体激光器光谱纯度的一个指标,通常用光谱曲线半高度对应的光谱全宽来表示。
GaAIAs/GaAs非均匀阱宽多量子阱超辐射发光管材料制备及表征
n m辐射波长的 G A A / a s a 1s G A 非均匀 阱宽多 量子 阱超辐射 发光二 极管结 构 ,采用分 子束外延 ( E) 法进 MB 方 行 了材料制备。同时利用 x射线双晶衍射 , 变温( 0~ 0 光致发光 ( L 等方法检测分析 了外延薄膜 的结 1 3 0K) P) 构 和光 电特性 。在光致发光谱 线中我们 得到 了发射波长 80 r 5 m的谱 峰 , i 谱峰 范围跨跃 80~ 8 m , 晶回 0 8 0r 双 i 摆 曲线结果显示 了设计 的结 构得 到实现。在注入 电流 10mA时 , 4 器件输 出光谱的半峰全宽可 以达 到 2 m, 6r i 室 温下连续输 出功率 达到 6m w。 关 键 词 :超辐射发光二极管 ; 均匀阱宽多量子阱 ; 非 光致发 光
G AA / a s a IsG A 非均 匀阱宽 多量子阱超辐 射 发 光管材 料制备及表征
李 梅 , 李 辉 ,王 玉 霞 ,刘 国军 ,曲 轶
( 长春理工大学 高功率半导体激光 国家重点实验室 ,吉林 长 春 10 2 ) 30 2
摘要 : 超辐射发光二极管(L ) S D 具有不同于半导体激光器和普通发光二极管的优异性能。为了制备高功率
E m i i i4 l 3 cr ,T l 0 3 ) 5 0 2 2 - al me @ 6 . o :l 5 n e :( 4 1 8 3 3 8
维普资讯
P C: 20 7 5 AC 35 F; 8 5 文献标识码 : A
中 图分 类 号 :0 8 . 1 4 2 3
l 引
质子辐照对超辐射发光二极管性能的影响

Table 1 Experimental conditions of proton irradiation on samples
Energy/ MeV Sample fluence/ (p/ cm2) Energy/ keV Sample fluence/ (p/ cm2)
1
内 外的科学工作者开展了对发光二极管( LED) 、 半 导体激光器(LD) 和太阳能电池等光电子器件的辐 射效应方面的研究[6 11, C- 0 主要研究了电子、 高能质 子辐射器件的辐射效应, 而低能质子对 SLD 辐射效
应的研究未见报道, 由于在空间直接进行辐射研究 通常受到空间实验条件的限制, 而利用地面加速器 提供的质子束模拟空间辐射对器件辐射效应进行研 究, 有方便、 省时、 经济的优点. 本文采用串列加速器, SLD 进行了能量分别 对 在 350keV 和 1MeV, 相同注量质子辐照对 SLD 出
DH l
摘要: 用能量分别为350keV 和 1MeV, 注量为1X101 和1x loll p/ C 2 的质子对超辐射发光二极管(SLD)进行辐 , M 照, 对辐照前后器件的光学和电学性能进行了测试. 结果表明, 在相同注量辐照的条件下, 350keV 与 1MeV 能量质 子辐照引起的辐照损伤相比, 前者引起的出光功率的退化更大, 造成的辐照损伤更加严重.采用 TRIM 程序对质子
人射到器件材料中的射程分布进行了模拟, 初步探讨了SLD 在 350keV 和 1MeV 能量质子辐照下的损伤效应. 关键词: 超辐射发光二极管 (SLD) ; 辐照损伤; 出光功率; TRIM 程序; 注量
PACC : 6180 EEACC : 2 5 5 OR
中图分类号: TN248. 4
1_3_mInGaAsP低电流超辐射发光二极管组件

第22卷第5期半 导 体 光 电V ol.22No.5 2001年10月Semiconductor Optoelectronics Oct.2001文章编号:1001-5868(2001)05-0343-041.3μm In GaAsP低电流超辐射发光二极管组件李金良,朱志文(重庆光电技术研究所,重庆400060)摘 要: 设计并制作了用于高精度光纤陀螺的1.3μm低电流超辐射发光二极管组件。
采用隐埋异质结结构,实现了良好的电流限制和光限制,同时采用长腔结构来提高器件单程增益,从而获得了高的输出功率。
组件具有工作电流小、输出功率高,以及光谱特性好等特点。
测试结果表明,在70mA工作电流下,组件尾纤输出功率大于0.1mW,光谱宽度大于30nm。
关键词: 超辐射发光二极管;光纤陀螺;In G aAsP中图分类号: TN31218 文献标识码: A1.3μm W avelength In G aAsP Superluminescent Diode Modulewith Low CurrentL I Jin2liang,ZHU Zhi2wen(Chongqing Optoelectronics R esearch I nstitute,Chongqing400060,China)Abstract: 1.3μm superluminescent diode modules are developed for high sensitive fiber optic gyroscopes.The precise control of injected current and emitting light is performed by using buried heterostructure and the single path gain is improved by applying long active cavity so as to increase the output power.A qualified chip is alignedly coupled with single mode polarization2maitained fiber.The modules are all2metal packaged with standard142pin shells by laser welding and are characterized by low injection,high output power and wide spectral width.Over0.l mW output power and over30 nm spectral width(FWHM)have been achieved at operating current of70mA.K ey w ords: SLD;fiber optic gyroscope;In G aAsP1 引言光纤陀螺要求所使用的光源具有高的输出功率和宽的光谱范围,以保证陀螺的高精度和高敏感性。
质子对超辐射发光二极管的辐射损伤研究
关键 词 : 间辐 射 损 伤 ; 子 ; 电 离能 损 ; 射 深 度 ; 辐 射 发 光 二 极 管 空 质 非 入 超
0 引 言
空间 装 置 的失 效 不 仅 来 源 于 L T引 起 的 电离 E 效应 , 而且 来 源 于 N E I L引 起 的位 移 损 伤 效 应 。其 中 NE I L引起 的位 移 损伤 是 导致 空 间辐射 环境 中新 型光 电器件 失效 的主要 因素 , I L涉及 了不 同能 NE 量范 围的不 同粒子 在 材 料体 中产 生 的位 移 损伤 , 所
带粒 子 和宇 宙 射 线 。地 磁 场俘 获 辐射 带 通 常 可 以
分 为 内辐 射 带 和 外 辐 射 带 , 内辐 射 带 以质 子 为 主 , 而 外辐射带 以电子 为 主 , 磁 俘 获辐 射 带 中质 子 能 地 量 可达5 0Me 电子 的最高 能量 达7Me 0 V, V。宇宙 射
核 的碰 撞采用 两体 碰 撞 描述 , 这部 分 主要 导致 入 射 离子运 动轨迹 的曲折 , 量 损 失来 自于弹 性 能量 损 能 失部 分 , 而在 两次 两体 碰 撞 之 间认 为 入 射 离 子 与材 料 中的电子连 续均 匀 地 损失 能量 , 当入 射 重 离子 时
中被储 存下 来 , 后 得 到各 种 所需 要 物 理量 的期 望 最
值 和相应 的统 计 误 差 。在 M neC r ot-al 法 计算 过 o方
程 中采用 连续慢 化假 设 , 即入 射 离子 与 材料 靶 原 子
6 — O
超辐射发光二极管应用
超辐射发光二极管应用一、超辐射发光二极管的概述超辐射发光二极管(Superluminescent Light Emitting Diode,简称SLED)是一种新型的半导体光源,它具有比普通的LED更高的亮度和更宽的光谱带宽。
SLED是一种特殊构造的半导体器件,其结构类似于激光二极管,但其工作原理与普通LED相同。
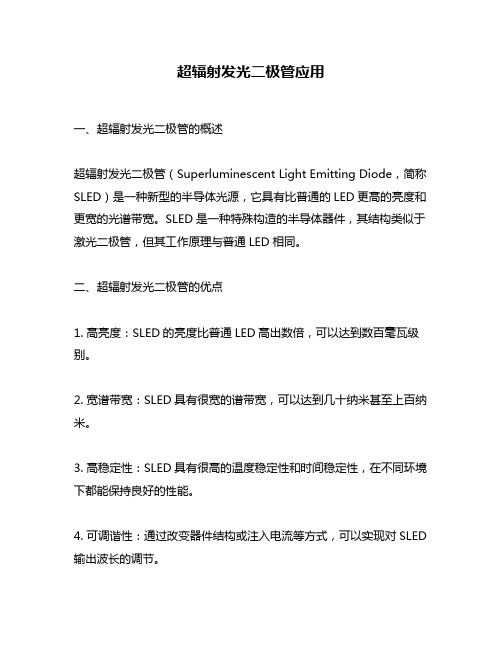
二、超辐射发光二极管的优点1. 高亮度:SLED的亮度比普通LED高出数倍,可以达到数百毫瓦级别。
2. 宽谱带宽:SLED具有很宽的谱带宽,可以达到几十纳米甚至上百纳米。
3. 高稳定性:SLED具有很高的温度稳定性和时间稳定性,在不同环境下都能保持良好的性能。
4. 可调谐性:通过改变器件结构或注入电流等方式,可以实现对SLED 输出波长的调节。
三、超辐射发光二极管应用领域1. 光通信领域:SLED广泛应用于单模光纤通信系统中作为发送端和接收端的光源,其宽带特性可以提高光纤传输带宽。
2. 生物医学领域:SLED被用于生物医学成像、光学相干断层扫描(OCT)等领域,其高亮度和宽谱带宽可以提高成像质量。
3. 工业检测领域:SLED可以作为光源用于工业检测中,如光谱分析、色度测量等。
4. 其他领域:SLED还被应用于激光雷达、气体传感器、环境监测等领域。
四、超辐射发光二极管的制备方法1. 分子束外延法:通过分子束外延技术在半导体衬底上生长多层超晶格结构,再进行腐蚀和电极沉积等工艺制备而成。
2. 溅射法:将金属或合金靶材置于真空腔内,利用离子轰击或电子轰击使靶材表面产生溅射现象,在半导体衬底上形成磊晶生长膜。
最后进行腐蚀和电极沉积等工艺制备而成。
3. 气相外延法:通过化学气相沉积技术在半导体衬底上生长多层超晶格结构,再进行腐蚀和电极沉积等工艺制备而成。
五、超辐射发光二极管的发展趋势1. 高功率:SLED将向更高功率方向发展,以满足光通信和生物医学等领域的需求。
2. 更宽的谱带宽:SLED将继续扩大其谱带宽,以提高其在生物医学成像和光纤通信等领域的应用价值。
半导体光电子学第6章 半导体发光二极管
半导体激光器与发光二极管在结构上的主要差别是前 者有光学谐振腔,使复合所产生的光子在腔内振荡和 放大;而后者则没有谐振腔。
正是由于它们在发光机理和上述这一基本结构上存在 差别,而使它们在主要性能上存在明显差别。
光谱宽度随有源层厚度的增 加而减小可归因于能为载流 子所填充的能带变窄。
面发光二极管的光谱宽度较宽。例如, 在高的注入电流下中心波长为1.3m 的面发光管,其Δ可达1300Å。但 它对温度不灵敏、高可靠性和低成本 等优点,却是光纤通信局部网(LAN) 中波分复用(WDM)光源所希望的。
然而,如此宽的谱宽限制了在保证邻 近信道之间有小的串音的前提下所能 供复用的波长数量。
防止发光管产生受激发射的另一种有效方法是将后端面弄斜, 以破坏由解理面形成的法布里-拍罗腔,如图6.2-2所示。其 基本结构与V沟衬底埋层异质结激光器相同,前端面镀增透 膜,后端面腐蚀成斜面。这种结构的特点是更能可靠地防止 受激发射,与前面采取非泵浦区结构的边发光管相比,更能 利用有源层的长度来产生自发辐射,获得较高输出功率。
1.不存在阈值特性,P-I线性好,因而有利于实现信 号无畸变的调制,这在高速模拟调制中是特别重要的;
2.虽然半导体发光二极管的光相干性很不好,但正因 为如此,避免了半导体激光器容易产生模分配噪声和 对来自于光纤传输线路中反射光较灵敏的缺点; 3.工作稳定,输出功率随温度的变化较小,不需要精 确的温度控制,因而驱动电源很简单;
三、发光二极管的发射谱
半导体发光二极管的自发发射的特点决定了它的发射光 谱是很宽的,要比半导体激光器的线宽高几个数量级。 而且光谱宽度Δ与峰值波长有关,可表示为
超辐射发光二极管应用
超辐射发光二极管应用一、介绍超辐射发光二极管(Superluminescent Light Emitting Diode,简称SLED)是一种特殊的发光二极管,具有较宽的光谱带宽和高亮度的特点。
它是一种介于激光器和发光二极管之间的光源,广泛应用于光通信、光纤传感、医疗设备、精密测量等领域。
二、光通信领域中的应用2.1 光纤通信系统SLED可以作为光纤通信系统中的光源,用于发送信号。
其较宽的光谱带宽使得可以传输更多的信息量,提高通信速率。
同时,SLED的高亮度和稳定性能,确保信号的传输质量。
2.2 光纤传感技术SLED在光纤传感技术中也有广泛应用。
通过将SLED与光纤传感器相结合,可以实现对温度、压力、应变等物理量的精确测量。
SLED的高亮度和宽光谱带宽能够提供更多的测量信息,增强传感器的灵敏度和精度。
三、医疗设备中的应用3.1 光学相干断层扫描技术光学相干断层扫描技术(Optical Coherence Tomography,简称OCT)是一种用于成像的非侵入性检测方法,广泛应用于眼科、皮肤科等领域。
SLED作为OCT的光源,能够提供高亮度和宽光谱带宽的光线,使得成像质量更高,能够更清晰地观察到组织结构和病变情况。
3.2 光动力疗法光动力疗法是一种利用光敏剂和光源进行治疗的方法。
SLED作为光源,可以提供适合光敏剂激活的光线,用于治疗皮肤病变、肿瘤等疾病。
其高亮度和稳定性能,保证了治疗的效果和安全性。
四、精密测量中的应用4.1 光学测量仪器SLED在精密测量仪器中的应用越来越广泛。
其高亮度和宽光谱带宽使得可以提供更多的测量信息,提高测量的精度和准确性。
例如,SLED可以用于光谱分析仪、光学显微镜等设备中,用于观察和测量样品的光谱特性和形貌。
4.2 光学标准器件SLED也可以作为光学标准器件使用。
其稳定性和可调节性能使得可以用于校准其他光学设备。
例如,SLED可以用于校准光功率计、光谱仪等设备,提高测量的准确性和可靠性。
- 1、下载文档前请自行甄别文档内容的完整性,平台不提供额外的编辑、内容补充、找答案等附加服务。
- 2、"仅部分预览"的文档,不可在线预览部分如存在完整性等问题,可反馈申请退款(可完整预览的文档不适用该条件!)。
- 3、如文档侵犯您的权益,请联系客服反馈,我们会尽快为您处理(人工客服工作时间:9:00-18:30)。
Superluminescent diode with a broadband gain based on self-assembled InAs quantum dots and segmented contacts for an optical coherence tomography light source Nobuhiko Ozaki, David T. D. Childs, Jayanta Sarma, Timothy S. Roberts, Takuma Yasuda, Hiroshi Shibata, Hirotaka Ohsato, Eiichiro Watanabe, Naoki Ikeda, Yoshimasa Sugimoto, and Richard A. HoggCitation: Journal of Applied Physics 119, 083107 (2016); doi: 10.1063/1.4942640View online: /10.1063/1.4942640View Table of Contents: /content/aip/journal/jap/119/8?ver=pdfcovPublished by the AIP PublishingArticles you may be interested inStructural and optical properties of self-assembled InAs quantum dot molecules on GaAs substratesJ. Vac. Sci. Technol. B 28, 1271 (2010); 10.1116/1.3516010N incorporation into InGaAs cap layer in InAs self-assembled quantum dotsJ. Appl. Phys. 98, 113525 (2005); 10.1063/1.2140891Broadband InGaAs tapered diode laser sources for optical coherence radar and coherence tomographyAppl. Phys. Lett. 86, 191101 (2005); 10.1063/1.1925313Low frequency noise of GaAs Schottky diodes with embedded InAs quantum layer and self-assembled quantum dotsJ. Appl. Phys. 93, 3990 (2003); 10.1063/1.1559412Light emission spectra of columnar-shaped self-assembled InGaAs/GaAs quantum-dot lasers: Effect of homogeneous broadening of the optical gain on lasing characteristicsAppl. Phys. Lett. 74, 1561 (1999); 10.1063/1.123616Superluminescent diode with a broadband gain based on self-assembled InAs quantum dots and segmented contacts for an optical coherence tomography light sourceNobuhiko Ozaki,1,2,a)David T.D.Childs,1Jayanta Sarma,1,b)Timothy S.Roberts,1Takuma Y asuda,2Hiroshi Shibata,2Hirotaka Ohsato,3Eiichiro Watanabe,3Naoki Ikeda,3Y oshimasa Sugimoto,3and Richard A.Hogg 11Department of Electronic and Electrical Engineering,University of Sheffield,Sheffield S37HQ,United Kingdom 2Faculty of Systems Engineering,Wakayama University,Wakayama 640-8510,Japan 3National Institute for Materials Science (NIMS),Tsukuba,Ibaraki 305-0047,Japan(Received 7November 2015;accepted 26January 2016;published online 29February 2016)We report a broadband-gain superluminescent diode (SLD)based on self-assembled InAs quantum dots (QDs)for application in a high-resolution optical coherence tomography (OCT)light source.Four InAs QD layers,with sequentially shifted emission wavelengths achieved by varying the thick-ness of the In 0.2Ga 0.8As strain-reducing capping layers,were embedded in a conventional p-n hetero-junction comprising GaAs and AlGaAs layers.A ridge-type waveguide with segmented contacts was formed on the grown wafer,and an as-cleaved 4-mm-long chip (QD-SLD)was prepared.The seg-mented contacts were effective in applying a high injection current density to the QDs and obtaining emission from excited states of the QDs,resulting in an extension of the bandwidth of the electrolumi-nescence spectrum.In addition,gain spectra deduced with the segmented contacts indicated a broad-band smooth positive gain region spanning 160nm.Furthermore,OCT imaging with the fabricated QD-SLD was performed,and OCT images with an axial resolution of $4l m in air were obtained.These results demonstrate the effectiveness of the QD-SLD with segmented contacts as a high-resolution OCT light source.VC 2016AIP Publishing LLC .[/10.1063/1.4942640]I.INTRODUCTIONNear-infrared (NIR)broadband (low-coherence)lighthas been utilized as a useful probe for non-invasive cross-sectional biological and medical imaging system:optical coherence tomography (OCT).1OCT relies upon low-coherence interferometry,and the axial resolution of OCT is governed by the coherence length of the light source,2which is given by the formula 0.44Âk 02/D k for a low-coherence light with a Gaussian spectral shape.Where the peak in emission is centered at k 0with a bandwidth of D k .As the application is in medical imaging,the center wavelength,k 0,is preferably in the NIR wavelength range as NIR light offers deep penetration into biological samples,and a large imag-ing depth can be obtained.3Thus,a large bandwidth NIR light source is required to obtain an OCT image with high axial resolution and large penetration depth.As a specific criterion,a resolution of 3–5l m is necessary to distinguish single cells.4In commercial OCT systems,a semiconductor-based superluminescent diode (SLD)is often used as a broadband light source.A SLD exhibits amplified spontane-ous emission providing a broader spectral emission range than a laser diode and higher emission power and brightness than a light-emitting diode.However,it is difficult tobroaden the emission bandwidth of a NIR SLD beyond $100nm,which is one of the reasons for the limitation of the axial resolution in an OCT image to around $10l m.Although alternative light sources have been developed for realizing high-resolution OCT,such as the use of a short-pulsed femtosecond laser 5or supercontinuum generation in a photonic crystal fiber,6a SLD still offers the advantages of being a compact,robust,and inexpensive device compared with alternative light sources.To overcome the difficulty of obtaining a broadband-gain SLD,self-assembled quantum dots (QDs)7have been recently recognized as an ideal light-emitting material instead of a con-ventional quantum well (QW)or bulk semiconductor.A QD is a three-dimensionally quantum confined structure and has a unique configuration of electron states and discrete delta-function-like density of states (DOS).8The states can be easily filled with supplied carriers,and the emission bandwidth of the QD should be extended in accordance with their discrete bandgap energies:the ground state (GS),1st excited state (ES1),and 2nd excited state (ES2).In addition,self-assembled InAs QDs on a GaAs substrate,which are grown via the strain induced by a lattice mismatch between InAs and GaAs (Stranski-Krastanov growth mode),9,10are particularly suitable to emit a broadband spectrum in the NIR region because of their size and compositional distributions in the ensemble.A SLD based on InAs QDs (QD-SLD)was first proposed by Wang et al .11and has been intensively studied.12–21We have fabricated a QD-SLD based on InAs QDs with controlled emission wavelengths 21and demonstrated OCT imaging usinga)This research was partly performed while N.Ozaki was at The University of Sheffield as a Visiting Academic.Electronic mail:ozaki@sys.wakayama-u.ac.jp b)Visiting Scholar with Department of Electronic and Electrical Engineering,University of Sheffield,Sheffield S37HQ,United Kingdom.0021-8979/2016/119(8)/083107/7/$30.00VC 2016AIP Publishing LLC 119,083107-1JOURNAL OF APPLIED PHYSICS 119,083107(2016)the developed QD-SLD.22However,the bandwidth of the elec-troluminescence (EL)was limited because the emission was limited to that from GS and ES1due to a limited injection cur-rent density (J )through the use of a single contact electrode.In this work,we thus developed a QD-based SLD,which includes multiple QD layers with deliberately shifted emission wavelengths,with segmented contacts to allow an increase in J locally within the device and to exploit emis-sions from higher energy states of the QDs,i.e.,ES2.The objective of this work was to realize a further broadened and dipless EL spectrum suitable for a high-resolution OCT light source.In addition,we measured gain spectra from the fabri-cated SLD using the segmented contact method 23to examine the gain bandwidth.Furthermore,OCT imaging with the fab-ricated QD-SLD was performed to evaluate its potential use in an OCT light source.II.EXPERIMENTAL DETAILS A.Sample preparationFour stacked InAs QD layers capped with In 0.2Ga 0.8As layers of various thickness were grown by molecular beam epitaxy on an n þ-GaAs (001)substrate,as illustrated inFig.1(a).All the QD layers were grown with a supply of InAs of 2.0monolayers,where the density of the grown QDs was 2–4Â1010cm À2.The In 0.2Ga 0.8As layer deposited on each QD layer was used as a strain-reducing layer (SRL)24to con-trol the emission center wavelength of the QDs by varying its thickness:250,1,2,and 4nm.A 240-nm-thick GaAs wave-guide layer including the QD layers was optically and elec-tronically confined within 1.5-l m-thick p-/n-Al 0.35Ga 0.65As cladding layers.The p-/n-cladding layers were doped at approximately 2.0Â1017cm À3by Be and Si,respectively.A 300-nm-thick p þ-GaAs (doped:$1Â1019cm À3)layer was grown on the upper p-cladding layer as a contact layer to the electrode.A ridge waveguide (RWG)was fabricated normal to cleaved facets with a height of 1.4l m and width of 5l m on the p-side surface of the grown wafer using photolithography and inductively coupled plasma reactive ion etching techni-ques.An insulation film of 200-nm-thick SiO 2was deposited on the surface using plasma-enhanced chemical vapor depo-sition,followed by wet-etching of selective areas (segments)on the RWG with buffered hydrofluoric acid solution.Subsequently,electrodes were formed by depositing Ti/Au (p-contact)and Ni/AuGe/Ni/Au (n-contact),and rapid ther-mal annealing was performed.To form segmented contacts,the electrode of the p-contact was divided into four 1-mm-long electrically isolated segments via the lift-off process,as shown in Fig.1(b).The contact gap lengths between the seg-ments were approximately 40l m.Both edges of the RWG were cleaved to form a 4-mm-long chip,and no anti-reflective (AR)coating was applied to the cleaved edges.B.EL and gain spectra measurementEL emission spectra from an edge of the fabricated RWG were measured at room temperature.Various injection currents (I s)were applied to the contact nearest to the edge (segment 1).The emission light was collected with an optical lensed fiber and was detected with an optical spectrum ana-lyzer,which performs spectrum measurements through tuna-ble bandpass filtering with a monochromator.The coupling loss into the optical lensed fiber was approximately 10dB.The gain spectrum was obtained using the segmented contact method.Based on the following formula,23G ¼1L lnP J ;2L ðÞP J ;L ðÞÀ1 ;(1)the gain and absorption spectra as a function of wavelengthwere determined.P (J ,L )and P (J ,2L )indicate the EL inten-sities obtained from the RWG lengths of L and 2L ,respec-tively,under the same J .Figures 2(a)and 2(b)present schematic diagrams of the device drive geometries;the cur-rent was injected into segment 1only to measure P (J ,L ),and both segments 1and 2were injected with identical J to measure P (J ,2L ).The un-pumped segments are expected to act as absorber elements during the EL measurements and prevent lasing in the device.This feature of the segmented contact can be effective in obtaining a broadband SLDemissionFIG.1.(a)Profile of a fabricated sample.(b)Schematic image and photo-graph of the segmented contacts fabricated on the QD-SLD chip.even though the RWG has a simple straight structure and no AR coating is formed on the facets.C.Spectral-domain OCT imagingA spectral-domain OCT(SD-OCT)26system was uti-lized to evaluate the fabricated chip as an OCT light source. The SD-OCT,which is categorized as a Fourier-domain OCT,27,28enables a spatial reflectivity distribution to be obtained against the depth of a sample along with the optical axis through an inverse Fourier-transformed(IFT)spectrum of interference between reflections from the sample and a refer-ence mirror.As schematically illustrated in Fig.3,the OCT setup consisted of the QD-SLD as a light source,a reference arm,a sample arm,and a spectrometer.Light from the QD-SLD was split by a50:50coupler and introduced into the refer-ence and sample arms.Then,the reflected light from the two arms was recombined by the50:50coupler,and the interfer-ence signal was measured by the spectrometer.The interfer-ence signal sampled as a function of the wavelength was rescaled to the wavenumber,I(k),by the linear interpolation method.The zero-filling method was also used to increase the number of data points on both sides of the spectrum,I(k).29 Subsequently,the IFT spectrum and depth profile of the reflec-tivity in the sample along with the optical axis was obtained.By collecting the depth profile with a lateral scanning of the sample,a2D OCT image was obtained.III.RESULTS AND DISCUSSIONA.EL measurementsFigure4presents the EL spectra obtained from the fabri-cated chip under various I s¼1–150mA,correspondingto FIG.2.Schematic images of device driven with differentlengths.FIG.3.Schematic illustration of SD-OCT setup including the fabricatedQD-SLD chip.FIG.4.(a)–(c)EL spectra obtained from the fabricated QD-SLD chip undervarious I s applied to segment1.(d)Plotted peak wavelength(closed square)and span(solid bar)of the EL emissions.current densities of J¼20–3000A/cm2,which were applied to segment1.As clearly observed in the series of spectra with injected currents(Figs.4(a)–4(c)),the spectral shape and center wavelength varied with the increased current. Initially,1230-nm-centered emission spanning approxi-mately1100–1300nm(the bandwidth was below100nm) was exhibited at lower I s($3mA),as observed in Fig.4(a). Subsequently,1180-nm-centered emission spanning approxi-mately1050–1300nm was exhibited from I¼5–10mA (Fig.4(b)).Finally,the center wavelength blue-shifted up to 1100nm and the emission span extended to$1000nm for I¼150mA(Fig.4(c)).As summarized in Fig.4(d),the peak wavelength(closed square)and emission band(solid bar) were blue-shifted,and the bandwidth was increased from approximately70to120nm with increased I.These behav-iors can be attributed to state-filling effect,where supplied carriersfill the discrete states in the QD in a stepwise man-ner,from lower to higher energy states.Although the observed emission spectra cannot be certainly assigned to specific emission lines from each energy state of the four stacked QDs,the emission spanning1200–1250nm is attrib-uted to electron/hole(e/h)recombination between GSs, and the emissions at approximately1150–1200nm and 1050–1150nm is attributed to ES1and ES2recombinations, respectively.The number of states in the GS is lower than that in the ES1and ES2,and thus,GS emissions can be obtained,even though a low injection current($3mA)is applied.Then,the injection current was increased,and the contribution of ES1emissions began.When their intensity was almost equal to the GS intensity under the injection cur-rent of approximately12.5mA,the bandwidth was increased to120nm.On further increasing the injection current,the ES1emissions were increased while the GS emissions were saturated;then,ES2emissions were sequentially increased, while the ES1and GS emissions were saturated.In order to clarify the state-filling effect,EL intensities at several wavelengths in the spectra are plotted as functions of I,as shown in Fig.5.Ideally,the integral EL intensities of each QD energy state in each layer should be plotted;how-ever,it is difficult to distinguish the emission spectra because of the broad and overlapping nature of emissions from QD ensembles,as described above.We thus utilized the plotted EL intensities as an approximate investigation.The EL intensities at1200and1250nm,which should be dominantly contributed from the GS emissions,were increased for lower I(Շ30mA)and then became gradually saturated for Iտ30mA.On the other hand,the EL intensities at1150and 1100nm increased sequentially after the increment of EL intensities at longer wavelength were decreased.These incre-ments of EL intensities in order of wavelength(state energy) indicate the state-filling in the discrete states,which indicates QD-originated emission.Furthermore,the ratio of the satura-tion currents of the EL intensities can be explained by vary-ing the number of carriersfilling the QD states.The ratio of the number of states for GS:ES1:ES2in a parabolic potential is2:4:6(including spin degeneracy),30and thus,the ratio of the injection currents necessary forfilling the QD states should be2:6:12for GS,GSþES1,and GSþES1þES2.In addition,when the carrier density increases,the Auger pro-cess will occur,and the actual current to saturate these states will increase.The saturation currents of the EL intensities shown in Fig.5vary with respect to the increase in current forfilling the states,e.g.,approximately20mA for the lon-gest wavelength in contrast to above140mA for the shortest wavelength.The wide extended emission wavelength implies the con-tribution of emission from ES2and not only ES1and GS of the QDs.In our previous work,21,22the emission wavelength was extended to approximately$1100nm from a chip with single contact under a current density of400A/cm2.By intro-ducing the segmented contacts,it was possible to increase the current density up to3000A/cm2in a single segment, which is approximately8times higher than that for the previ-ous device,and emission from the higher energy state(ES2) emerged.B.Gain spectraFigure6presents the deduced net modal gain spectra under various I s(applied to a1-mm-long segment of the waveguide)in accordance with Equation(1).The positive or negative values of the net modal gain indicate that the QDs function as optical gain or absorption media at the given wavelength,respectively.As clearly seen in the spectra, positive gain regions occur from approximately1240nm, where the GS emissions were mainly observed and extended continuously to shorter wavelength with increasing I.TheFIG.5.EL intensity plotted for each wavelength as a function of -modal-gain spectra of the QD-SLD under various I s.positive gain region under I of12.5mA was$1183–1237nm and was extended to a range of$1076–1233nm(bandwidth of$160nm)under I of150mA.The extension of the positive gain region with the increase in I can also be attributed to the sequential state-filling effect from GS to ES2,which is dem-onstrated by the dependence of the EL intensities.These results demonstrate that the fabricated chip operates as a gain media because of the QDs.The maximum gain value at I of 150mA was approximately6cmÀ1.The span of the gain region and the maximum gain value were almost the same under I s higher than150mA.This result might be due to the influence of the heat caused by high I s.By introducing a ther-moelectric cooler and a pulsed current source,the maximum gain value can be further increased.Because the emission center wavelength of each QD layer was shifted continuously by the SRL,the broad gain spectra appeared without apparent dips in the positive gain regions of the spectra in contrast to the QD-SLD including QD layers with identical emission center wavelengths of GS and ES.This smooth gain feature is useful in obtaining a broad emission spectrum with homogeneous intensities.The gain values assigned at excited states(ES1and ES2)were higher than that from GS,which is probably due to the higher state degeneracy in the ESs compared with the GS. The possibility of amplified spontaneous emission,that is, stimulated emissions from the states,is proportional to the DOS for the transition of carriers(Fermi’s golden rule).The results above indicate the effectiveness of the segmented contacts for deriving higher ES emission and a broadband-gain.C.OCT imagingA fabricated QD-SLD chip was evaluated as an OCT light source.As described in the Introduction,the axial reso-lution of OCT image is governed by the central wavelength and the bandwidth of the EL spectrum.Figure7(a)presents normalized EL spectra of a QD-SLD under various I s (10–100mA).In order to estimate the axial resolution when the chip was used in OCT,the IFT EL spectra were deduced, as shown in Fig.7(b).The IFT EL spectra provide more accurate estimation of the OCT axial resolution than that from the formula indicated in the Introduction:0.44Âk02/ D k,because this formula is defined for a low-coherence light source with a Gaussian spectrum in the frequency unit. According to the Wiener–Khinchin theorem,a Fourier rela-tionship exists between the autocorrelation function and the power spectrum of the light source.31The autocorrelation, which corresponds to the point-spread function,governs the axial resolution of the OCT image;the axial resolution can be estimated using the full-width at half-maximum(FWHM) of the IFT EL(power)spectra.As observed in the Fig.7(b), the FWHM decreased with increased I.In addition to the increase in the bandwidth of the power spectrum,the blue-shift of the peak wavelength resulted in a decrease of the axial resolution to3.8l m(in air)with an increase of I to 100mA.This estimated axial resolution is less than half of that of typical commercial OCT:$10l m.In addition,no apparent side lobes appeared beside the main peak,which indicates that the ghost images(noise)resulting from the side lobe should be minimized in an OCT image when the QD-SLD is used as a light source.OCT imaging with the QD-SLD was performed for a test sample:a cover-glass plate with a refractive index of1.5 and a thickness of approximately150l m.To produce a two-dimensional OCT image of the sample,depth profiles were obtained by scanning the sample along the in-plane direc-tion.Then,the depth profiles were displayed in two dimen-sions with a gray scale of the signal intensity.Figure8(a) presents the obtained OCT image.Two white lines are clearly seen in the image,which represent reflections at the upper and lower surfaces of the sample.The distance between the lines is approximately220l m,which is consist-ent with the optical path length,that is,the thickness of the cover-glass plate multiplied by its refractive index. Figure8(b)presents a depth profile along the red dashed line in the image.Two peaks resulting from reflections from the surfaces of the cover-glass plate appear in the depth profile. The FWHM of each peak is approximately4l m,and no apparent side lobes appeared beside the peak.These features are consistent with those of the coherence function shown in Fig.7(b).The axial resolution of the OCT image was thus determined to be approximately4l m,which is half of that of our previous result using a QD-SLD with a single con-tact.22This improvement of the axial resolution results from FIG.7.(a)Normalized EL spectrum from a QD-SLD under I s of 10–100mA.(b)Coherence function of the EL spectra shown in(a).the modification of the prepared contacts;the segmented contacts enable an increase of J and extension of the emis-sion wavelength range.Based on the above results,we conclude that the QD-SLD with segmented contacts is a promising light source for high-resolution OCT imaging.In particular,the axial resolu-tion below 4l m in air is expected to distinguish single cells in an OCT image,which is difficult to observe using a con-ventional OCT system.IV.SUMMARYA SLD chip based on self-assembled InAs QDs with seg-mented contacts was developed.EL spectra revealed the extension of the emission band to shorter wavelength with increasing I .This behavior is due to the contribution of higher excited states of the QDs to the emission,which were derived from the state-filling effect under higher I s.The measured op-tical gain of the QDs using the segmented contact method revealed a gain bandwidth beyond 160nm under I of 150mA.The gain bandwidth was also extended to shorter wavelength,corresponding to the contributions of the ESs of the QDs.These results indicate the effectiveness of the segmented con-tacts for deriving emissions of higher excited states of QDs and broadband gain.Furthermore,OCT imaging was per-formed using the QD-SLD,and the potential of the QD-SLD as a light source for high-resolution OCT was demonstrated.ACKNOWLEDGMENTSN.O.would like to thank the members of Richard Hogg’s group at the University of Sheffield for their supportand fruitful discussions about the experimental results.This study was partly supported by Grants-in-Aid for Scientific Research (KAKENHI)Grant No.25286052and the Canon foundation.N.O.would like to acknowledge financial support received from Wakayama University to visit the University of Sheffield.The fabrication of the SLD chip was supported by the NIMS Nanofabrication Platform in the “Nanotechnology Platform Project”sponsored by the Ministry of Education,Culture,Sports,Science,and Technology,Japan (MEXT).1D.Huang,E.A.Swanson,C.P.Lin,J.S.Schuman,W.G.Stinson,W.Chang,M.R.Hee,T.Flotte,K.Gregory,C.A.Puliafito,and J.G.Fujimoto,Science 254,1178(1991).2M. E.Brezinski,Optical Coherence Tomography:Principles and Applications (Academic Press,New York,2006).3M.S.Patterson,B.C.Wilson,and D.R.Wyman,Lasers Med.Sci.6,379(1991).4J.Welzel,Skin Res.Technol.7,1(2001).5W.Drexler,U.Morgner,F.X.K €a rtner,C.Pitris,S.A.Boppart,X.D.Li,E.P.Ippen,and J.G.Fujimoto,Opt.Lett.24,1221(1999).6B.Povazay,heva,A.Unterhuber,B.Hermann,H.Sattmann,A.F.Fercher,W.Drexler,A.Apolonski,W.J.Wadsworth,J.C.Knight,P.St.,J.Russell,M.Vetterlein,and E.Scherzer,Opt.Lett.27,1800(2002).7Self-Assembled Quantum Dots ,Lecture Notes in Nanoscale Science and Technology Series Vol.1,edited by Z.M.Wang (Springer,New York,2008).8Y.Arakawa and H.Sakaki,Appl.Phys.Lett.40,939(1982).9L.Goldstein,F.Glas,J.Y.Marzin,M.N.Charasse,and G.Le Roux,Appl.Phys.Lett.47,1099(1985).10D.Leonardo,M.Krishnamurthy,C.M.Reaves,and P.Petroff,Appl.Phys.Lett.63,3203(1993).11Z.Z.Sun,D.Ding,Q.Gong,W.Zhou,B.Xu,and Z.G.Wang,Opt.Quantum Electron.31,1235(1999).12Z.Y.Zhang,Z.G.Wang,B.Xu,P.Jin,Zh.Sun,and F.Q.Liu,IEEE Photonics Technol.Lett.16,27(2004).13M.Rossetti,A.Markus,A.Fiore,L.Occhi,and C.Velez,IEEE Photonics Technol.Lett.17,540(2005).14S.K.Ray,K.M.Groom,M.D.Beattie,H.Y.Liu,M.Hopkinson,and R.A.Hogg,IEEE Photonics Technol.Lett.18,58(2006).15P.D.L.Greenwood,D.T.D.Childs,K.M.Groom,B.J.Stevens,M.Hopkinson,and R.A.Hogg,IEEE J.Sel.Top.Quantum Electron.15,757(2009).16Z.Y.Zhang,R.A.Hogg,X.Q.Lv,and Z.G.Wang,Adv.Opt.Photonics 2,201(2010).17X.Li,P.Jin,Q.An,Z.Wang,X.Lv,H.Wei,J.Wu,J.Wu,and Z.Wang,Nanoscale Res.Lett.6,625(2011).18N.Yamamoto,K.Akahane,T.Kawanishi,H.Sotobayashi,Y.Yoshioka,and H.Takai,Jpn.J.Appl.Phys.,Part 151,02BG08(2012).19S.Chen,M.Tang,Q.Jiang,J.Wu,V.G.Dorogan,M.Benamara,Y.I.Mazur,G.J.Salamo,P.Smowton,A.Seeds,and H.Liu,ACS Photonics 1,638(2014).20N.Ozaki,T.Yasuda,S.Ohkouchi, E.Watanabe,N.Ikeda,Y.Sugimoto,and R.A.Hogg,Jpn.J.Appl.Phys.,Part 153,04EG10(2014).21T.Yasuda,N.Ozaki,H.Shibata,S.Ohkouchi,N.Ikeda,H.Ohsato,E.Watanabe,Y.Sugimoto,and R.A.Hogg,IEICE Trans.Electron.E99-C ,381(2016).22H.Shibata,N.Ozaki,T.Yasuda,S.Ohkouchi,N.Ikeda,H.Ohsato,E.Watanabe,Y.Sugimoto,K.Furuki,K.Miyaji,and R.A.Hogg,Jpn.J.Appl.Phys.,Part 154,04DG07(2015).23P.Blood,G.M.Lewis,P.M.Smowton,H.Summers,J.Thomson,and J.Lutti,IEEE J.Sel.Top.Quantum Electron.9,1275(2003).24K.Nishi,H.Saito,S.Sugou,and J.-S.Lee,Appl.Phys.Lett.74,1111(1999).25N.Ozaki,K.Takeuchi,Y.Hino,Y.Nakatani,T.Yasuda,S.Ohkouchi,E.Watanabe,H.Ohsato,N.Ikeda,Y.Sugimoto,E.Clarke,and R.A.Hogg,Nanomater.Nanotechnol.4,26(2014).FIG.8.(a)OCT image obtained from a cover-glass plate with a refractive index and thickness of approximately 1.5and 150l m,respectively.Surfaces of the cover-glass are indicated by black arrows.(b)Depth profile along the red dashed line in the OCT image.The FWHM of the peaks indicated by black arrows is $4l m.26Optical Coherence Tomography:Technology and Applications,edited by W.Drexler and J.G.Fujimoto(Springer,New York,2008).27A. F.Fercher, C.K.Hitzenberger,G.Kamp,and S.Y.El-Zaiat, mun.117,43(1995).28G.H€a usler and M.W.Lindner,J.Biomed.Opt.3,21(1998).29C.Dorrer,N.Belabas,J.-P.Likforman,and M.Joffre,J.Opt.Soc.Am.B 17,1795(2000).30A.Wojs,P.Hawrylak,S.Fafard,and L.Jacak,Phys.Rev.B.54,5604 (1996).31L.Cohen,IEEE Signal Proc.Lett.5,292(1998).。