人教版高三英语图表作文训练复习教案
高三英语人教版图表作文训练复习教案
高三英语人教版图表作文训练复习教案
图表作文复习
I. 理论依据:《课程标准》八级写作目标
1、能根据所读文章进行转述或写摘要;
2、能根据文字或图表提供的信息写短文或报告;
3、能写出语意连贯且结构完整地范文,叙述事情或表达观点和态度;
4、能在写作中做到文体规范、语句通顺。
II. 教学内容:复习图标作文的写作方法和思路。
教学目标:达到《课程标准》八级写作目标
教学重点和难点:根据所给的信息,正确地审题和组织文章的结构;运用
尽可能多样的句式
必要的过渡性词语完成写作任务。
III. 图表作文的几种形式:
A 表格形式,将统计的数据或被说明的事物直接用表格形式体现出来,即统计表。
B 图形形式
C 表示数据变化的曲线图;
D 表示数据的大小或数量之间的差异的柱状图;
E 表示总体内部结构变化的扇形图
IV. Presentation
1.【例析1】请你根据下表提供的信息写一篇题为Changes in Chinese People’s Diet 的短文。
短文可分为三小节:
1) state the changes in people’s diet in the past five years;。
高考英语题型解析---图表作文(教案)
高考英语题型解析---图表作文(教案)I. 理论依据:《课程标准》八级写作目标1、能根据所读文章进行转述或写摘要;2、能根据文字或图表提供的信息写短文或报告;3、能写出语意连贯且结构完整地范文,叙述事情或表达观点和态度;4、能在写作中做到文体规范、语句通顺。
II. 教学内容:复习图标作文的写作方法和思路。
教学目标:达到《课程标准》八级写作目标教学重点和难点:根据所给的信息,正确地审题和组织文章的结构;运用尽可能多样的句式和必要的过渡性词语完成写作任务。
III. 图表作文的几种形式:A表格形式,将统计的数据或被说明的事物直接用表格形式体现出来,即统计表。
B图形形式C表示数据变化的曲线图;D 表示数据的大小或数量之间的差异的柱状图;E表示总体内部结构变化的扇形图IV. Presentation1.【例析1】请你根据下表提供的信息写一篇题为Changes in Chinese People‘s Diet 的短文。
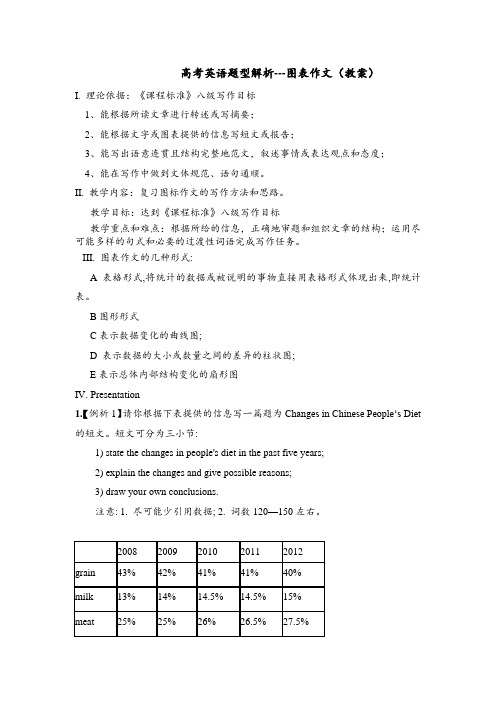
短文可分为三小节:1) state the changes in people's diet in the past five years;2) explain the changes and give possible reasons;3) draw your own conclusions.注意: 1. 尽可能少引用数据; 2. 词数120—150左右。
分析:本统计表描述中国人民从2008年至2012年饮食结构的变化。
第一步:点明主题。
(开门见山,言简意赅)There have been some changes in the diet of the Chinese people.第二步:观察图表中数据的增减总趋势,分类式阐明,并说明原因。
Grain, the main food of the most people in China, is now playing a less important role. The amount of fruit and vegetables on the average person's diet has also dropped by 1.5 percent from 2008 to 2012. The amount of milk and meat has increased.The changes in diet can be explained by several reasons. For one thing, with the development of economy, an increasing number of people can afford to buy better foods. For another, people have realized the importance of a balanced diet. Avoiding starvation is no longer the only purpose of eating.第三步:归纳总结并得出结论。
高三英语一轮复习图表类作文写作讲义

高考英语图表类作文写作框架与句型自从2022年开始全国乙卷的作文用了图表后,图表类作文就如同雨后春笋般出现在高三大大小小历次模拟考试的英语作文题中。
要知道,考场作文,哪有那么多时间给你构思,想要在短时间内拿出一篇不错的作文给阅卷老师,靠的就是好的框架与句型,然后将作文的话题内容套入即可。
所以,只要你的脑中已经搭建好了框架与句型模板,那么,考场作文,对于别人或许是作文题,对你来说就是填空题!简直不要太轻松。
那么,对于图表类作文,能不能搞一套“模板框架”,让学生可以直接套内容呢?当然可以,我们不妨来试一试,就拿最近经常写的图表类作文为例。
先建立框架,其实,图表类作文的框架很容易建立,一般在考题里的内容要点也会讲清楚,大致就是如下几部分:Part 1 介绍背景Part 2 描述图表信息Part 3 分析原因或描述评论图表反应的现象part 4 给建议(发表观点)有时,我们会把part 1 与part 2 放在一段,介绍背景与描述图表放一起。
有时,我们会把part 2 和part 3 放一起,描述图表并分析原因或其反应现象,这两种分层都可以。
框架有了,接下来,我们只需要记住每一部分需要用到哪些句型,再套入内容即可。
Part 1 介绍背景这部分其实就是概括性地描述下图表的主要内容或其调查背景,比如2022年高考的“学生通过多途径在课外学习英语”,我市三练“劳动课的开设的内容选择” 等等,这里,我们都可以用一句话去开篇全文,比如:1 当今,随着...的(流行/受欢迎/发展...), 越来越多的... 选择/做了...Nowadays, with the ... of ..., an increasing number of ...2 It has been noticed that .... (形式主语)后面跟图表反映的主要内容Part 2 描述图表一般来说图表都是柱状图或扇形图,主要数据有四组,这里学生要做到的就是如何用简洁的两三句话,把图表的信息描述清楚,避免重复、啰嗦。
应用文写作之图表作文课件 2024届高考英语作文备考

Step 4 Practice
学校英文报正在开展以Learning English Beyond the Classroom为题的讨论。请使用图表 中的调查结果写一篇短文投稿,内容包括: 1. 学习活动状况描述; 2. 简单评论; 3. 你的建议。 注意: 1.写作词数应为80左右; 2.请按如下格式在相应位置作答。
Step 1 Build the structure
Genre: a short essay Structure: Paragraph 1 A brief description
Paragraph 2 A short comment
Paragraph 3 Your suggestions
Step 2 Build the language (para.1)
如图所示: 1. The chart shows/indicates/illustrates…. 2. According to the chart, … 3. As is shown in the chart,… 4. As can be seen from the chart,… 描述结果: 1. …percent of the students ..., while … percent of
Step 3 Appreciation
According to the survey conducted in our school, 43% of the students prefer to read science books, followed by comic readers, which accounts for 26%. 18% of the students enjoy reading sports and music books while 13% of the students like to read classical books.
高三英语作文复习教学设计(精选五篇)
高三英语作文复习教学设计(精选五篇)第一篇:高三英语作文复习教学设计高三英语作文复习教学设计教学背景:英语写作能力是高中阶段着重培养和提高的语言技能之一。
《英语课程标准》对九级语言技能目标写作能力的描述如下:①能用英文书写摘要、报告、通知和公务信函等;②能比较详细和生动地用英语描述情景、态度或情感;③能阐述自己的观点和评述他人的观点,文体恰当,用词准确;④能在写作中恰当地处理引用的资料及他人的原话;⑤能填写各种表格,写个人简历和申请书,用语基本正确、得当;⑥能做简单的笔头翻译;⑦能在以上写作过程中做到文字通顺,格式正确。
学生情况:学生已经具备一定的写作能力,但是依然存在很多的问题。
相当部分学生对于作文出现畏难情绪,信心不足,常把它看成是死板的任务;也有为数不少的学生在需要用语言表达时,就感到力不从心,写出来的句子常常令人费解;作文中的语言错误、语法错误、词汇拼写及标点符号方面的错误也比比皆是,这种语言表达手段的贫瘠和错误反映出学生所掌握的常用词汇量太少,灵活运用英语句式的能力还较差。
另外,他们思想不活跃,缺乏观察和思考,思路阻塞,又懒于思索,写作时所用的词语自然是最简单、最保险的词,因此所写内容单调,平淡,没有实际内容,苍白无力。
还有的同学动笔前不审题,不构思,想一句写一句,东拼西凑,语无伦次,根本没有使作文主题与段落和句子连贯为一体的整体概念。
此外,修改环节常常受到忽视,以至学生不懂得如何修改文章。
教学目标:1.让每个学生都能够积极思考,有话可说2.让每个学生学会有条理的完成写作内容3.激发学生写作的热情,创造性地完成写作4.让学生找到写作自信重点与难点:1.如何激发学生的写作热情2.如何帮助学生找回写作自信3.如何引导学生很好的完成写作任务教学工具:多媒体常规教具教学步骤:第一步:导入教师播放一段视频,其内容为:一辆大型搅拌车与一辆大型油罐车相撞,搅拌车车头与油罐车车尾相撞,搅拌车右驾驶室严重变形,司机双腿被牢牢卡在驾驶室中无法移动,腿部有血迹,司机意识还算清醒,右车门深深凹进驾驶室,无法打开,地面是两车相撞后产生的大量碎片。
(课标通用)近年高考英语一轮复习专题27图表作文教学案
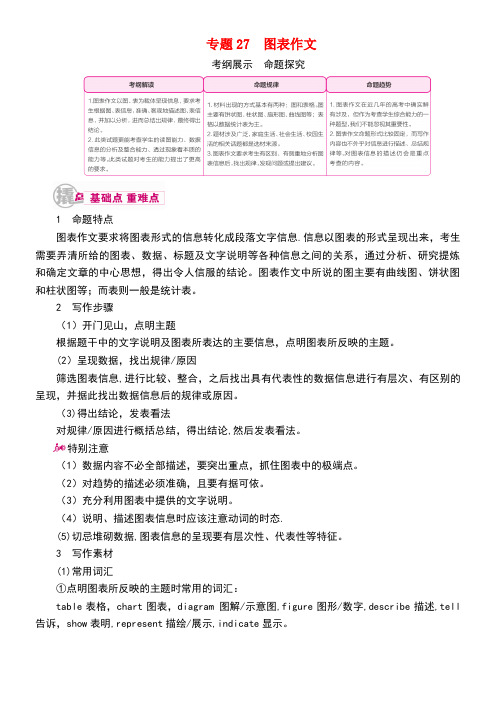
专题27 图表作文考纲展示命题探究1 命题特点图表作文要求将图表形式的信息转化成段落文字信息.信息以图表的形式呈现出来,考生需要弄清所给的图表、数据、标题及文字说明等各种信息之间的关系,通过分析、研究提炼和确定文章的中心思想,得出令人信服的结论。
图表作文中所说的图主要有曲线图、饼状图和柱状图等;而表则一般是统计表。
2 写作步骤(1)开门见山,点明主题根据题干中的文字说明及图表所表达的主要信息,点明图表所反映的主题。
(2)呈现数据,找出规律/原因筛选图表信息,进行比较、整合,之后找出具有代表性的数据信息进行有层次、有区别的呈现,并据此找出数据信息后的规律或原因。
(3)得出结论,发表看法对规律/原因进行概括总结,得出结论,然后发表看法。
特别注意(1)数据内容不必全部描述,要突出重点,抓住图表中的极端点。
(2)对趋势的描述必须准确,且要有据可依。
(3)充分利用图表中提供的文字说明。
(4)说明、描述图表信息时应该注意动词的时态.(5)切忌堆砌数据,图表信息的呈现要有层次性、代表性等特征。
3 写作素材(1)常用词汇①点明图表所反映的主题时常用的词汇:table表格,chart图表,diagram 图解/示意图,figure图形/数字,describe描述,tell 告诉,show表明,represent描绘/展示,indicate显示。
②分析数据差异及变化趋势时常用的词汇:a.表示上升或增加的:rise, increase, go up.b.表示下降或减少的:decrease, fall, reduce, decline, drop, go down。
③表示变化特点的:sharply急剧地,quickly迅速地,rapidly快速地,dramatically 戏剧性地,slowly缓慢地,gradually逐渐地。
④表示比较的:compared to/with。
.., in contrast to, the same as, similar to,different from,difference between,while,but, on the contrary, however, as..。
高考英语一轮总复习 第一部分 写作提升7(图表作文)课件 新人教版选修7

Lack of physical training will not keep people healthy. It is necessary for people to realize the importance of physical training. Some measures should be taken to provide people with training facilities and places. ________, everyone should take part in physical training in order to keep healthy.
4.写作要点: ①点明参加锻炼与不参加锻炼的比例,提出为什么 ②分析产生这种现象的原因 ③提出相关建议,并号召人们多参加锻炼,以保持身体 健康
常用模板 Ⅰ.格式模板 开头:Recently we made a survey on... There are several reasons for... 正文:More than 10% of them... Some measures should be taken to... 结尾:In a word, everyone should... in order to...
As the saying goes, writing style shows the man. Beautiful and neat handwriting is beneficial, especially for middle school students. Therefore, in my opinion, more emphasis should be placed on this aspect in future.
高考英语一轮复习 图表类夹叙夹议作文课件 人教
良好的人际关系是建设和谐社会的关键。假设你是李华,最近你校对“中学生如何交友?”的话题展开讨论,大家发表了不同的看法。请你根据下面所给内容,给《21世纪报 高中生版》Your Words栏目写一封信,反映讨论情况。并说明你对如何交友的看法。 注意:1.对所给要点,逐一陈述,适当发挥,不要简单翻译。 2.词数150左右。开头和结尾已经写好,不计入总词数。
常用句式: 1. 点题总结句式: We can see from the graph that... From the table we can find out that... As can be seen from the chart,... As is shown in the chart, the production last month rose... Chart 1 shows that... 2. 细节描写句式: In conclusion,/Personally,/In my opinion, people around the world should be aware of the real situation of... The number was/is ten times as many as in 2010. It doubled the number of last year. There is an increase of 20% this year. It decreased twice than that of the year 2010. The total number was lowered by 10%. It rose from 10% to 15% of the total this year. Compared with 2010, it fell from 15% to 10%.
- 1、下载文档前请自行甄别文档内容的完整性,平台不提供额外的编辑、内容补充、找答案等附加服务。
- 2、"仅部分预览"的文档,不可在线预览部分如存在完整性等问题,可反馈申请退款(可完整预览的文档不适用该条件!)。
- 3、如文档侵犯您的权益,请联系客服反馈,我们会尽快为您处理(人工客服工作时间:9:00-18:30)。
图表作文复习I. 理论依据:《课程标准》八级写作目标1、能根据所读文章实行转述或写摘要;2、能根据文字或图表提供的信息写短文或报告;3、能写出语意连贯且结构完整地范文,叙述事情或表达观点和态度;4、能在写作中做到文体规范、语句通顺。
II. 教学内容:复习图标英语作文的写作方法和思路。
教学目标:达到《课程标准》八级写作目标教学重点和难点:根据所给的信息,准确地审题和组织文章的结构;使用尽可能多样的句式必要的过渡性词语完成写作任务。
III. 图表作文的几种形式:A表格形式,将统计的数据或被说明的事物直接用表格形式体现出来,即统计表。
B图形形式C表示数据变化的曲线图;D 表示数据的大小或数量之间的差异的柱状图;E表示总体内部结构变化的扇形图IV. Presentation1.【例析1】请你根据下表提供的信息写一篇题为Changes in Chinese People‘s Diet的短文。
短文可分为三小节:1) state the changes in people's diet in the past five years;2) explain the changes and give possible reasons;3) draw your own conclusions.注意:1. 尽可能少引用数据; 2. 词数120—150左右。
分析:本统计表描述中国人民从2001年至2002年饮食结构的变化。
第一步:点明主题。
(开门见山,言简意赅)There have been some changes in the diet of the Chinese people.第二步:观察图表中数据的增减总趋势,分类式阐明,并说明原因。
Grain, the main food of the most people in China, is now playing a less important role. The amount of fruit and vegetables on the average person's diet has also dropped by 1.5 percent from1998 to 2002. The amount of milk and meat has increased.The changes in diet can be explained by several reasons. For one thing, with the development of economy, an increasing number of people can afford to buy better foods. For another, people have realized the importance of a balanced diet. Avoiding starvation is no longer the only purpose of eating.第三步:归纳总结并得出结论。
In a word, the changes are the signs of the improvement in people's lives. There is no doubt that there will be greater changes in people's diet in the future.2.Conclusion:图表式作文写作分三步:第一、开门见山地点明本图表所反映的主题经常使用的词汇有:table, chart, figure, graph, describe, tell, show, represent等等。
第二、分析数据间的主要差异及趋势,然后描写在描写数据间变化及总趋势特征时,可采用分类式或对比式以支持主题,并阐明必要的理由。
要注意层次清楚。
经常使用的词汇有:rise, drop, reduce, increase, decrease, fall, while, but, on the contrary, however, compare... to/ with..., in contrast to, as...as, the same as, similar to, different from, difference between, among, more than, less than等等。
第三、归纳总结或发表评论。
有时第三步可省略经常使用的词汇有:in a word, in short, generally speaking, It's clear from the chart that..., We can draw the conclusion that..., We can learn/know...等等。
激活练习:3. More practice某学校对中学生课余活动实行了调查,结果如下。
请根据图表1提供的信息描述学生每天的课余活动,并针对图表2中任何一个数据中反映的情况写出你的看法。
词数120-150。
一、内容要点:1. 图表1中六项活动及所用时间2. 图表2中一个数据反映的情况3. 自己的看法二、说明:1. 内容要点可用不同方式表达。
2. 能够紧扣主题的适当发挥。
一个看法。
词数很多于60。
一、内容要点:1. 图表1中六项活动及所用时间2. 图表2中一个数据反映的情况第一步:本图表所反映的主题Key words1. the daily average amount of time, different after-class activities.The Chart shows the daily average amount of time the students spend on different after-class activities.第二步:图表1中六项活动及所用时间On Chart 1, The students spend 93 minutes on their homework. And watching TV takes up 46 minutes. They put in about the same amount of time listening to music and working on the computer, 34 minutes and 30 minutes each. 25 minutes is spent on sports, only 12 minutes goes into housework.第三步:图表2中一个数据反映的情况及自己的一个看法Problem:little time for sportsSuggestions10% of the time is taken up with sports activities.We should encourage the students to do more exercise after class.One possible version:Chart 1 shows the daily average amount of time the students spend on different after-class activities. As Chart 1 shows,the students put most of their time -93 minutes-into their homework, and next in line is watching TV, which takes up 46 minutes. They spend about the same amount of time listening to music and working on the computer, 34 minutes and 30 minutes each. While 25 minutes is spent on sports, only 12 minutes goes into housework.As is shown in Chart 2, only 10% of the time is taken up with sports activities. I think the school should encourage the students to do more exercise after class. Just as a proverb goes, all work and no play makes Jack a dull boy. So only when students strike a balance between studies and play, can they be healthier and more energetic.4. 图表题中常见句子翻译:• 1. 从图表上能够看出这本书销售辆有两个高峰。
• 2. 从图表上能够看出62%的人愿意当志愿者。
• 3. 7月的数量是四月的两倍• 4. 与1,2月间的销售量相比,本书2月到7月间的销售额增加了两倍。
• 5. 正如你所看到的,整体呈下降趋势.• 6. 在前三个月车祸从数由一月22起上升到三月的32起.答案:• 1 From the graph, we can see that there were two peaks in the sales of the book• 2.As is shown by the graph that 62% of students like to be a volunteer3. The number in July doubled that in February.4. Comparing the sales of the book between January and February, we find that itincreased 3times.• 5. As you can see the general tendency is a declining.• 6. In the first three months car accidents increased from 22 in January to 32 in March. 5. 图表作文中套用句式:1. As is shown by the graph/in the table that/ As we can see clearly from the chart above…(概述图表)2. The results of the survey seem to suggest that…(得出结论)3. …amount to …(数量总计)(add up to /come to /sum up to )4. …increase(rise/ fall/ drop )from …to …(数量增减)5.(be)three times as + 形容词+ aspared with …, …7.There is (was) a rapid rise in …8 The changes ….can be explained for several reasons.9. It is reported that 85% of…10 In recent years/during this years……11 … are also the reason why the number increasing so fast.12. From the increased number we can get that…。