How the Economic Machine Works(宏观经济研究框架)
多恩布什《宏观经济学》第七版第01章绪论

〔3〕 短期AS曲线:水平:乘数及IS – LM模型
短期: 阐述短期产出波动属于AD〔乘数及IS – LM模型〕研究的范围。
结论三:在短期中,产出只取决于AD,价格不受 产出水平影响 35.0 30.0 25.0 20.0 15.0 10.0 5.0 0.0
11111111111111111111112222222999999999999999999999900000007788888888889999999999000000089012345678901234567890123456
8000.00 6000.00 4000.00 2000.00
0.00
19781979198019811982198319841985198619871988198919901991199219931994199519961997199819992000200120022003200420052006
通货膨胀与经济周期 图1-9:通货膨胀:CPI变动率
通货膨胀与产出缺口反相关
GDP增长率 CPI
40.0 35.0 30.0 25.0 20.0 15.0 10.0
5.0 0.0 -5.0
11111111111111111111112222222999999999999999999999900000007788888888889999999999000000089012345678901234567890123456
FIGURE 1-5:AGGREGATE DEMAND AND SUPPLY
AS曲线:对于每一给定价格水平,厂商愿意提供的 产量。主要取决于增长和生产要素价格。
AD曲线:商品和货币市场同时均衡时的价格和产量 水平组合。取决于货币、财政政策和消费者信心等。
经济学入门必读书籍
第一步:正三观在推荐任何经济学书之前,我不推荐你读任何的” 书“ 。
在你读任何的经济学书(无论是理论还是通俗读本之前),我们需要做的是:正三观。
为什么因为经济学是一门很模糊的学科,甚至在每个学校中的分类都不一样,有的学校放在商科,有的学校叫社会科学,有的学校叫科学。
所以,在经济学中是没有绝对的对错,只有不同的派别和有些看起来还不错有一些听起来对但是非常不靠谱。
所以在读任何”书“,甚至是教科书之前,需要端正下三观,了解下真正的世界。
说一句肯定会被抽的,但是我觉得是对的话:经济学本无基础,但是有初,中,高三段。
与基础相比更重要的是三观一定要正,不要被专业名字忽悠到。
很多东西是逻辑问题,不是学术问题。
在此推荐秒杀无数经济学教科书的一篇论文,这个论文可以秒杀掉市面上99%的经济学教科书。
How the Economic machine works - By Ray Dalio From Bridgewater?英文链接:宏观经济运行的框架(英文原版)by Ray中文翻译版本链接:理解宏观经济运行的框架(Ray Dalio)_百度文库首先,我们需要用这个文章好好正下三观。
无数的经济学书和理论都太浮云和浮夸了。
经济和金融,我只相信真正Hands on的人写出来的东西。
Ray Dalio现在卸任了Bridgewater的CEO,和另外2个合伙人转做Advisors,专门专注于投资方向决策。
Bridgewater现在应该仍然是全世界最大的宏观对冲基金。
这个文章用非常好的语言,充分的说明了这个世界到底是怎样的,调整并且融合了相当多的理论并且真正的和现实结合。
不管你是否有经济学功底是否真正懂得经济学,在你读任何数之前,必须读这个。
金融炼金术- 索罗斯豆瓣链接:金融炼金术(豆瓣)不用多说什么。
这个也是一个帮助你更好了解这个世界的经济与哲学构架的书。
索罗斯是少数几个业内的真正的大师级,并且愿意说真话表达真观点的人。
我保证上面两个作者说的都是真话,其他的现在很多书作者说的不是有偏颇就是有炒作或者就是在放屁。
intermediate principles of economics -回复

intermediate principles of economics -回复主题:中级经济学原理(Intermediate Principles of Economics)导言:中级经济学原理(Intermediate Principles of Economics)是经济学学科中的重要内容,涉及到宏观经济学和微观经济学的基本原理和概念。
本文将一步一步回答有关中级经济学原理的问题,探讨经济学的核心理论和应用。
第一部分:宏观经济学原理1. 宏观经济学是什么?宏观经济学研究的是整个国家或地区的经济运行和政策制定。
通过研究宏观经济学原理,我们可以了解国内生产总值(GDP)、通货膨胀率、失业率等指标的变化规律,以及经济政策对经济运行的影响。
2. 宏观经济学原理中的需求与供给曲线是什么?根据宏观经济学原理,需求曲线表示消费者对货物和服务的购买意愿,供给曲线表示生产者愿意生产和提供的货物和服务数量。
这两条曲线的相互作用决定了市场上的价格和数量。
3. 什么是经济增长与经济波动?经济增长指的是一个国家或地区长期内国内生产总值(GDP)的增加,反映了经济活动的扩张。
而经济波动则指的是国内生产总值在短期内的波动,包括经济的繁荣、衰退、萧条等阶段。
第二部分:微观经济学原理1. 微观经济学是什么?微观经济学研究的是个体经济主体(如家庭、企业和市场)之间的经济决策和交互行为。
通过研究微观经济学原理,可以了解消费者如何做出购买决策、企业如何优化生产和定价,以及市场竞争对价格和数量的影响。
2. 供给和需求曲线如何确定价格和数量?根据微观经济学原理,供给曲线表示生产者愿意提供的货物和服务数量与价格的关系,需求曲线表示消费者愿意购买的货物和服务数量与价格的关系。
市场的价格和数量在供给和需求曲线的相互作用下,最终达到供给与需求平衡的状态。
3. 什么是边际效用和边际成本?边际效用指的是消费者从每多消费一单位产品中获得的额外满足程度,边际成本是指生产一单位产品所需要增加的额外成本。
多恩布什《宏观经济学》第七版习题答案(英文)--02
Solutions to Problems in the T extbook:Conceptual Problems:1. Government transfer payments (TR) do not arise out of any production activity and arethus not counted in the value of GDP. If the government hired the people who currently receive transfer payments, then their wages would be counted as part of government purchases (G), which is counted in GDP. Therefore GDP would rise.2.a. If the firm buys a car for an executive's use, the purchase counts as investment (I). But ifthe firm pays the executive a higher salary and she then buys a car, the purchase is counted as consumption (C).2.b. The services that a homemaker provides are not counted in GDP (regardless of theirvalue). However, if an individual officially hires his or her spouse to perform household duties at a certain wage rate, then the wages earned will be counted in GDP and GDP will increase.2.c. If you buy a German car, consumption (C) will increase but net exports (NX = X - Q) willdecrease. Overall GDP will increase by the value added at the foreign car dealership, since the import price is likely to be less than the sales price. If you buy an American car, consumption and thus GDP will increase. (Note: If the car you buy comes out of the car dealer's inventory, then the increase in C will be partially offset be a decline in I, and GDP will again only increase by the value added.)3. GDP is the market value of all final goods and services currently produced within thecountry. (The U.S. GDP includes the value of the Hondas produced by a Japanese-owned assembly plant that is located in the U.S., but it does not include the value of Nike shoes that are produced by an American-owned shoe factory located in Malaysia.) GNP is the market value of all final goods and services currently produced using assets owned by domestic residents. (Here the value of the Hondas produced by a Japanese-owned Honda plant is not counted but the value of the Nikes by the American-owned shoe plant is.)Neither is necessarily a better measure of the output of a nation. The actual value of the GDP and GNP for the U.S. is fairly close.4. The NDP (net domestic product) is defined as GDP minus depreciation. Depreciationmeasures the value of the capital that wears out during the production process and has to be replaced. Therefore NDP comes closer to measuring the net amount of goods produced in this country. If this is what you want to measure, then NDP should be used.5. Increases in real GDP do not necessarily mean increases in welfare. For example, if thepopulation of a country increases by more than real GDP, then the population of the country is on average worse off. Also some increases in output come from welfare reducing events. For example, increased pollution may cause more lung cancer, and the treatment of the lung cancer will contribute to GDP. Similarly, an increase in crime may lead to overtime work for police officers, whose increased salary will increase GDP. But the welfare of the people in the country may not have increased in either case. On the other hand, GDP does not always accurately measure quality improvements in goods or services (faster computers or improved health care) that improve people's welfare.6. The CPI (consumer price index) and the PPI (producer price index) are both measuredby looking at a certain market basket. The CPI's basket contains mostly finished goods and services that consumers tend to buy regularly in their daily lives. The PPI’s basket contains raw materials and semi-finished goods, that is, it measures costs to the producer of a product and its first user. The CPI is a concurrent economic indicator, whereas the PPI is a leading economic indicator.7. The GDP-deflator is a price index that covers the average price increase of all final goodsand services currently produced within an economy. It is defined as the ratio of current nominal GDP to current real GDP. Nominal GDP is measured in current dollars, while real GDP is measured in so-called base-year dollars. Even though early estimates of the GDP-deflator tend to be unreliable, the GDP-deflator can be a more useful price index than the CPI or PPI (both of which are fixed market baskets). This is true for two reasons: first it measures a much wider cross-section of goods and services; second, a fixed market basket cannot account for people substituting away from goods whose relative prices have changed, while the GDP-deflator, which includes all goods and services produced within the country, can.8. If nominal GDP has suddenly doubled, it is most likely due to an increase in the averageprice level. Therefore, the first thing you would want to check is by how much the GDP-deflator has changed, to calculate by how much real output (GDP) has changed. If nominal GDP and the GDP-deflator have both doubled, then real GDP should be the same.9. Assume the loan you made yields you an annual nominal return of 7%. If the rate ofinflation is 4%, then your rate of return in real terms is only 3%. If, on the other hand, if inflation rate is 10%, then you will actually get a negative real rate of return, that is, you will lose 3% of your purchasing power. One way to protect yourself against such a loss of purchasing power is to adjust the interest rate for inflation, that is, to index the loan. In other words, you can require that, in addition to the specified interest rate of the loan of,let’s say, 3%, the borrower also has to pay an inflation premium equal to the percentage change in the CPI. In this case, a real rate of return of 3% would be guaranteed.T echnical Problems:1. The text calculates the change in real GDP in 1992 prices in the following way:[RGDP01 - RGDP92]/RGDP92 = [3.50 - 1.50]/1.50 = 1.33 = 133%.To calculate the change in real GDP in 2001 prices, we first have to calculate the GDP of 1992 in 2001 prices. Thus we take the quantities consumed in 1992 and multiply them by the prices of 2001, as follows:Beer 1 at $2.00 = $2.00Skittles 1 at $0.75 = $0.75_______________________________Total$2.75The change in real GDP can now be calculated as[6.25 - 2.75]/2.75 = 1.27 = 127%.We can see that the growth rate of real GDP calculated this way is roughly the same as the growth rate calculated above.2.a. The relationship between private domestic saving, investment, the budget deficit and netexports is shown by the following identity:S - I ≡ (G + TR - TA) + NX.Therefore, if we assume that transfer payments (TR) remain constant, then an increase in taxes (TA) has to be offset either by an increase in government purchases (G), a decrease in net exports (NX), or a decrease in the difference between saving (S) and investment (I).2.b. From the equation YD ≡ C + S it follows that an increase in disposable income (YD) willbe reflected in an increase in consumption (C), saving (S), or both.2.c. From the equation YD ≡ C + S it follows that when either consumption (C) or saving (S)increases, disposable income (YD) must increase as well.3.a. Since depreciation D = I g - I n = 800 - 200 = 600 ==>NDP = GDP - D = 6,000 - 600 = 5,4003.b. From GDP = C + I + G + NX ==> NX = GDP - C - I - G ==>NX = 6,000 - 4,000 - 800 - 1,100 = 100.3.c. BS = TA - G - TR ==> (TA - TR) = BS + G ==> (TA - TR) = 30 + 1,100 = 1,1303.d. YD = Y - (TA - TR) = 5,400 - 1,130 = 4,2703.e. S = YD - C = 4,270 - 4,000 = 2704.a. S = YD - C = 5,100 - 3,800 = 1,3004.b. From S - I = (G + TR - TA) + NX ==> I = S - (G + TR - TA) - NX = 1,300 - 200 - (-100)= 1,200.4.c. From Y = C + I + G + NX ==> G = Y - C - I - NX ==>G = 6,000 - 3,800 - 1,200 - (-100) = 1,100.Also: YD = Y - TA + TR ==> T A - TR = Y - YD = 6,000 - 5,100 ==> TA - TR = 900From BS = T A - TR - G ==> G = (TA - TR) - BS = 900 - (-200) ==> G = 1,1005. According to Equation (2) in the text, the value of total output (in billions of dollars) canbe calculated as: Y = labor payments + capital payments + profits = $6 + $2 + $0 = $86.a. Since nominal GDP is defined as the market value of all final goods and servicescurrently produced in this country, we can only measure the value of the final product (bread), and therefore we get $2 million (since 1 million loaves are sold at $2 each).6.b. An alternative way of measuring total GDP would be to calculate all the value added ateach step of production. The total value of the ingredients used by the bakeries can be calculated as:1,200,000 pounds of flour ($1 per pound) = 1,200,000100,000 pounds of yeast ($1 per pound) = 100,000100,000 pounds of sugar ($1 per pound) = 100,000100,000 pounds of salt ($1 per pound) = 100,000__________________________________________________________ = 1,500,000Since $2,000,000 worth of bread is sold, the total value added at the bakeries is $500,000.7. If the CPI increases from 2.1 to 2.3, the rate of inflation can be calculated in thefollowing way:rate of inflation = (2.3 - 2.1)/2.1 = 0.095 = 9.5%The CPI often overstates inflation, since it is calculated by using a fixed market basket of goods and services. But the fixed weights in the CPI's market basket cannot capture the tendency of consumers to substitute away from goods whose relative prices have increased. Therefore, the CPI will overstate the increase in consumers' expenditures.8.The real interest rate (r) is defined as the nominal interest rate (i) minus the rate ofinflation (π). Therefore the nominal interest rate is the real interest rate plus the rate of inflation, ori = r + π = 3% + 4% = 7%.。
曼昆宏观经济学第七版英文答案 第二章

c.Real GDP falls because with fewer workers on the job, firms produce less. Thisaccurately reflects a fall in economic well-being.d.Real GDP falls because the firms that lay off workers produce less. This decreaseseconomic well-being because workers’ incomes fall (the income side), and there are fewer goods for people to buy (the expenditure side).e.Real GDP is likely to fall, as firms shift toward production methods that producefewer goods but emit less pollution. Economic well-being, however, may rise. The economy now produces less measured output but more clean air; clean air is not traded in markets and, thus, does not show up in measured GDP, but is neverthe-less a good that people value.f.Real GDP rises because the high-school students go from an activity in which theyare not producing market goods and services to one in which they are. Economic well-being, however, may decrease. I n ideal national accounts, attending school would show up as investment because it presumably increases the future produc-tivity of the worker. Actual national accounts do not measure this type of invest-ment. Note also that future GDP may be lower than it would be if the students stayed in school, since the future work force will be less educated.g.Measured real GDP falls because fathers spend less time producing market goodsand services. The actual production of goods and services need not have fallen, however. Measured production (what the fathers are paid to do) falls, but unmea-sured production of child-rearing services rises.9.As Senator Robert Kennedy pointed out, GDP is an imperfect measure of economic per-formance or well-being. In addition to the left-out items that Kennedy cited, GDP also ignores the imputed rent on durable goods such as cars, refrigerators, and lawnmowers;many services and products produced as part of household activity, such as cooking and cleaning; and the value of goods produced and sold in illegal activities, such as the drug trade. These imperfections in the measurement of GDP do not necessarily reduce its usefulness. As long as these measurement problems stay constant over time, then GDP is useful in comparing economic activity from year to year. Moreover, a large GDP allows us to afford better medical care for our children, newer books for their education, and more toys for their play. Finally, countries with higher levels of GDP tend to have higher levels of life expectancy, better access to clean water and sanitation, and higher levels of education. GDP is therefore a useful measure for comparing the level of growth and development across countries.。
曼昆《经济学原理(宏观经济学分册)》(第6版)课后习题详解(第28章 失 业)
曼昆《经济学原理(宏观经济学分册)》(第6版)第28章 失 业课后习题详解跨考网独家整理最全经济学考研真题,经济学考研课后习题解析资料库,您可以在这里查阅历年经济学考研真题,经济学考研课后习题,经济学考研参考书等内容,更有跨考考研历年辅导的经济学学哥学姐的经济学考研经验,从前辈中获得的经验对初学者来说是宝贵的财富,这或许能帮你少走弯路,躲开一些陷阱。
以下内容为跨考网独家整理,如您还需更多考研资料,可选择经济学一对一在线咨询进行咨询。
一、概念题1.劳动力(labor force )答:劳动力指一国或地区法定劳动年龄以上的,或者在工作,或者在积极寻找工作,或者因为暂时失业而等待召回的所有人。
劳动力包括失业者和就业者。
一国劳动力的规模取决于人口总量、人口结构、劳动力参工率以及移民等因素。
劳动力是既包括就业者又包括失业者的工人总量,用公式可以表示为:劳动力=就业者人数+失业者人数。
2.失业率(unemployment rate )答:失业率指失业者在劳动力中所占的百分比。
失业率是劳工统计中用来反映一国或一个地区失业程度的主要指标。
计算方法是失业人数除以劳动力人数再乘以100%,即:失业率=失业人数/劳动力人数×100%。
失业率可以分别按性别、年龄、种族、产业和职业分组进行计算。
西方各国失业者的统计标准并不相同,一般的标准是:凡是统计时没有工作,但在此以前的4周以内曾做过寻找工作的努力,却没有找到工作的人。
此外,包括在失业者统计范围的还有:①暂时被解雇,正在等待召回的人。
②正等待到新工作岗位报到,但等待时间达30天以上的人。
许多经济学家认为,失业率这一指标并不足以反映一国或地区失业的严重程度,因为还有那些因为寻找工作太难而放弃寻找工作的努力,从而退出劳动力市场成为非劳动力人口的“丧失信心的工人”,他们并没有包括在失业者范围之内。
3.劳动力参工率(labor-force participation rate ) 答:劳动力参工率是指劳动力在成年人口中的百分比。
中英:宏观经济运行的框架(HowtheEconomicMachineWorks-RayDalio)
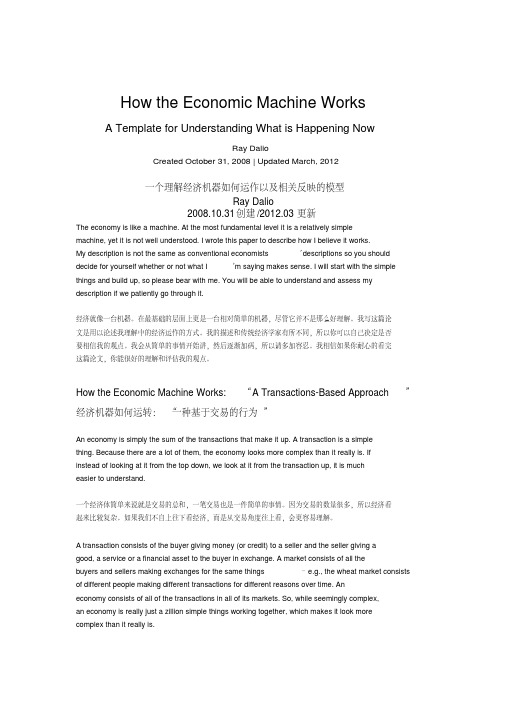
How the Economic Machine WorksA Template for Understanding What is Happening NowRay DalioCreated October 31, 2008 | Updated March, 2012一个理解经济机器如何运作以及相关反映的模型Ray Dalio2008.10.31创建/2012.03更新The economy is like a machine. At the most fundamental level it is a relatively simplemachine, yet it is not well understood. I wrote this paper to describe how I believe it works.My description is not the same as conventional economists’ descriptions so you should decide for yourself whether or not what I’m saying makes sense. I will start with the simple things and build up, so please bear with me. You will be able to understand and assess my description if we patiently go through it.经济就像一台机器。
在最基础的层面上更是一台相对简单的机器,尽管它并不是那么好理解。
我写这篇论文是用以论述我理解中的经济运作的方式。
我的描述和传统经济学家有所不同,所以你可以自己决定是否要相信我的观点。
我会从简单的事情开始讲,然后逐渐加码,所以请多加容忍。
我相信如果你耐心的看完这篇论文,你能很好的理解和评估我的观点。
中级宏观经济学(Macroeconomics)考试试题答案
2003-2004学年第二学期中级宏观经济学(Macroeconomics)考试试题答案(经济试验班021、022)Ⅰ.Choose the best answers (2'×10)1.B2.A3.C4.B5.C6.A7.B8.C9.C 10.DⅡ. Explain the following terms. (20 points)1.Endogenous variables: 经济模型中要解释的变量。
Exogenous variables:模型给出作为既定的变量。
2. Menu costs:企业因通货膨胀改变价格的成本。
shoe-leather costs:为减少持有货币的损失而发生的成本。
3. GDP deflator :名义GDP/实际GDP,是相对于基年商品和劳务价格的那一年的商品和劳务价格。
CPI:即消费价格指数,是相对于某个基年一篮子物品与劳务价格的同样一篮子物品与劳务的现期价格。
4. Adaptive expectation :人们根据过去的经验或数据来预测未来。
rational expectation:人们尽可能地利用所有可以获得地信息,包括关于现在政府政策地信息预测未来。
5. Real exchange rate :两国物品的相对价格。
nominal exchange rate:两国通货的相对价格。
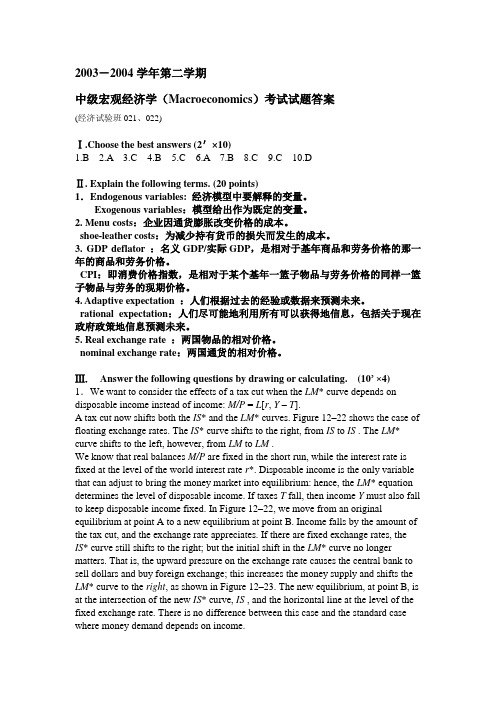
Ⅲ.Answer the following questions by drawing or calculating. (10’ ×4) 1.We want to consider the effects of a tax cut when the LM* curve depends on disposable income instead of income: M/P = L[r, Y –T].A tax cut now shifts both the IS* and the LM* curves. Figure 12–22 shows the case of floating exchange rates. The IS* curve shifts to the right, from IS to IS . The LM* curve shifts to the left, however, from LM to LM .We know that real balances M/P are fixed in the short run, while the interest rate is fixed at the level of the world interest rate r*. Disposable income is the only variable that can adjust to bring the money market into equilibrium: hence, the LM* equation determines the level of disposable income. If taxes T fall, then income Y must also fall to keep disposable income fixed. In Figure 12–22, we move from an original equilibrium at point A to a new equilibrium at point B. Income falls by the amount of the tax cut, and the exchange rate appreciates. If there are fixed exchange rates, theIS* curve still shifts to the right; but the initial shift in the LM* curve no longer matters. That is, the upward pressure on the exchange rate causes the central bank to sell dollars and buy foreign exchange; this increases the money supply and shifts the LM* curve to the right, as shown in Figure 12–23. The new equilibrium, at point B, is at the intersection of the new IS* curve, IS , and the horizontal line at the level of the fixed exchange rate. There is no difference between this case and the standard case where money demand depends on income.2. a.将生产函数两边同时除以效率工人,则有:()4.04.06.04.0k L E K L E L E K L E Y y =⎪⎭⎫ ⎝⎛⨯=⨯⨯=⨯=b .s=0.25 δ=5% n=2% g=3%; 带入经济稳定的条件:38.15.275.0)1(*84.15.2*6.45.2*1.025.0)()(3/23/24.03/54.0≈⨯=-=≈==≈==⋅++=⋅y s c k y k kk kg n k f s δc.当g 变为5%时,有: 63.11225*4.31225*12.025.0)()(3/24.03/54.0≈⎪⎭⎫ ⎝⎛==≈⎪⎭⎫ ⎝⎛==⋅++=⋅k y k kk kg n k f s δ 这种变化导致了效率工人的人均资本量减少,效率工人的人均产量下降;但总产出会增加。
- 1、下载文档前请自行甄别文档内容的完整性,平台不提供额外的编辑、内容补充、找答案等附加服务。
- 2、"仅部分预览"的文档,不可在线预览部分如存在完整性等问题,可反馈申请退款(可完整预览的文档不适用该条件!)。
- 3、如文档侵犯您的权益,请联系客服反馈,我们会尽快为您处理(人工客服工作时间:9:00-18:30)。
宏观研究框架:经济运行的逻辑How the Economic Machine Works导读:这是一篇近15000字的长篇文章,需要时间和耐心才能读完。
本文作者是桥水公司创始人雷·达里奥,此文是其最著名的文章之一。
作为一篇视角比较独特的宏观经济研究论文,1万多字并不算多,文章干货很多,详细解析了桥水公司的宏观研究方法论。
经济的运行如同机器的运行,而且本质上来说是经济是相对比较简单的机器,然而并不总是非常好理解。
我写这篇文章的目的是描述经济这台机器是怎么运作的,跟传统的经济学家们描述的不一样,你需要自己加以判断并吸收利用。
下面跟跟随我描述这座简单的经济机器。
我相信如果你耐心的读完,你会更好的理解经济的运行。
经济如何运行:“基于交易的理解方法”经济是大量交易的总和,每个交易都很简单。
交易包括买方和卖方,买方支付货币(或者信贷)给卖方以换取商品、服务或者金融资产。
大量的买方和卖方交换同一种商品,构成了市场,例如:小麦的市场包含了各种持有不同目的的买方和卖方,他们进行不同的交易方式。
各种交易的市场便组成了经济。
因此,现实中难以理解看似复杂的经济,其实仅仅是大量的简单的交易组合在一起而已。
对于一个市场(或者对于经济),如果你知道了支出货币以及信贷的总额、所卖商品的数量,你就是知道了理解经济的所有的事情。
比方说,既然任何商品、服务以及金融资产的价格等于所有买方花费的支出(total $)除以卖出的总产量(Q),因此如果要了解或者预测商品的价格,你只需要预测出总支出($)以及总产量(Q)。
然而,每一个市场有都大量的买方和卖方,并且这些买方和卖方交易的动机不一致,但是最主要的买卖动机总是很好理解,这样考虑理解经济就变得不那么困难。
可以用下面的一个简单图表来说明。
这种解释经济的视角比传统的解释方式要更容易理解,传统的解释视角是基于商品的供给、需求以及价格弹性。
这种经济框架你需要知道的重要概念是:支出($)来自两种方式--货币(money)或者信贷(credit)。
例如,你到商店去买东西,你可以付钱或者用信贷卡付款。
如果你用信贷卡付账,你就创造了延期支付的信贷(只要双方达成一致就可以立即产生信贷,传统的关于货币的流速,名义GDP,绕来绕去,容易让人搞不清楚发生了什么),若直接付现金,则没有创造信贷。
简单的说就是:不同的市场、不同类型的买方卖方以及不同的支付方式构成了经济。
为了方便,我们把他们分组以便概况经济运行框架:·所有经济活动的变化以及金融市场价格变化都来自:1)货币以及信贷总量的变化(total $)2)所卖产品、服务以及金融资产的数量的变化(Q),其中前者($)的变化比后者(Q)的变化对于经济的影响要大,因为改变货币以及信贷的供应相对其他来说显然要容易得多。
·简化分析,把买方分几大类:私人部门和政府部门。
私人部门包括家庭和企业,无论来自国内还是国外;政府部门主要包括:联邦政府(同样花钱在商品或者服务上)和中央银行,中央银行是唯一能够创造货币并且用之于购买金融资产。
与商品、服务以及金融资产相比,货币以及信贷更容易由于供求关系而增加或者减少,因此有了经济和价格的周期。
资本体系(The capitalist system)经济的参与者买卖商品、服务或者金融资产,并且支付货币或者信贷。
在资本体系里,这种交换是自由发生的,在这个自由的市场中,买卖可以基于各自利益和目的。
金融资产的产生和购买(即贷款、投资)称之为“资本形成”(capital formation)。
之所以能够完成资本形成,是因为买卖双方都认为达成的交易对于各自都是有好处的。
那些债权人之所以愿意提供货币或者信贷,是基于预期能够收回更多。
因此,这个体系良好运行的前提是有大量的资本的提供者(投资者/贷款方)以及大量的资本接受者(借款方、权益的卖方),资本的提供方相信他们能够获得多于投入的回报。
而中央银行则控制着货币的总量;信贷的多少受货币政策的影响,但是信贷量可以轻易产生,只需要双方在信贷上达成一致。
泡沫的出现,是因为信贷创造多了,难以履行偿还义务,进而导致了泡沫的破灭。
当资本缩减出现,经济也跟着萎缩,因为没有足够的货币和信贷来购买商品。
这种缩减的出现常见的形式有两个:衰退(比较常见)和萧条。
衰退出现在短期债务周期中(short-term debt cycle),而萧条发生在去杠杆(deleveragings)过程中。
衰退很好理解,因为经常发生,大部分人经历过;而萧条相对比较难理解,因为不经常发生,经历得不够。
短期债务周期:也称为商业周期(business cycle),周期产生于:a) 消费支出或者货币和信贷($)的增长快于产量的增长(Q)的增长,导致价格上升。
(b) 价格上升促使货币政策紧缩,减少货币以及信贷,这时候衰退就开始了。
话句话说,衰退是由于中央银行货币政策紧缩(往往是为了抵抗通胀)打压了私人部门负责的增加而导致的经济放缓,随着中央银行货币政策的放松,衰退也相应结束。
为了终结衰退,中央银行降低利率以刺激需求增长和信贷增加,因为低利率可以:)降低偿贷成本。
2)减少每月偿付额,从而刺激相关需求。
3)由于利率降低,预期现金流折现效应,将抬高产生收入(income-producing)的资产价格,例如股票,债券,房地产,从而产生财富效应,刺激消费支出。
长债务周期:是由于债务增长快于收入以及货币的增长,直到不能再增长为止,因为债务的成本已经走向极端了,典型的是利率不能再降低了。
去杠杆就是降低债务负担(debt/income)的过程,如何完成去杠杆呢?主要是通过以下组合:1)债务重组,减少还贷2)勒紧裤腰带,减少支出3)财富的重分配4)债务货币化(政府购买债务,增加信贷)。
萧条正是去杠杆化过程带来的经济减慢。
萧条的发生是由于中央银行不能通过降低货币的成本来对抗私人部门的需求萎缩以及支出的缩减。
在萧条时:1)很多债务人偿还的货币量,比实际承诺的要多。
2)通过改变偿贷成本以及刺激信贷增长的货币政策,都不管用。
其一:利率不可能无限降低,也就不足以鼓励消费支出和资本行为(产生通缩性萧条deflationary depressions),其二增长的货币会涌向抗通胀资产,而不能增加信贷(产生通胀性萧条inflationary depressions)。
萧条的结束一般都是通过央行印钞票大量的货币化债务以及弥补私人部门支出削减产生的影响。
需要指出的是,萧条是去杠杆的经济缓慢阶段,如果控制的好,去杠杆不一定会引起萧条。
(可以参考前期文章“An In-Depth Look at Deleveragings”)政府在经济衰退以及萧条时的表现可以作为我们判断当下经济运行情况的风向标。
例如,在萧条时,央行典型的表现是印钞用以购买大量的金融资产以弥补私人部门信贷的萎缩,在衰退时就不会出现这样的行为。
同时,在萧条时,政府也会消费支出得更多以弥补私人部门消费支出的缩减。
以上两种类型的周期是经济运行框架的两个重要部分,下面更全面的介绍经济运行框架。
经济运行框架:三大驱动力(The three big force)我认为经济运行驱动力主要来自:1)生产率的趋势性增长2)长期债务周期3)短期债务周期(商业周期)如下图:后面内容主要是解释这三种驱动,主要结合两种周期分析,以及两种周期与生产率趋势线结合分析,通过这种分析可以理解经济运行的逻辑。
这三种驱动适用于所有国家的经济,但是这里我们讲的是美国过去100年的例子。
如果需要了解其他国家,可以参考前期两篇文章“An In-Depth Look at Deleveragings”and“Why Countries Succeed and Fail Economically”。
如下图所示,过去100年,每单位资本产生的真实GDP的增长平均保持在略低于2%左右,并且没有波动太大。
这主要是因为,随着时间的推移,知识在增加,致使生产率的提高和生活水平的上升。
在图中可以看出,从长期来看,生产率趋势线波动非常小,即使是在1930s大萧条时期。
因此我们有理由相信,时间会把经济拉回到正轨上来。
然而,往细里看,与趋势线的背离波动短期却比较大,比如说,在萧条时期,经济在高峰和低谷相差20%,金融财富的损失超过50%,股价下降甚至超过80%。
对于萧条的起始阶段的持有金融财富的损失比图中的显示的更大,因为财富还有一个转移的过程(政府通过税收等政策财富转移)。
围绕着趋势线的波动不是由于知识的增加或者减少。
例如,大萧条的出现不是由于人们忘记了如何有效生产,也不是由于战争和干旱。
所有对经济产生噪音的因素都在那,然而经济就是停滞不前。
那为什么闲置的工厂不简单的雇佣一些失业者来利用充足的资源,以便拉升经济呢?问题在于这些周期不是由于我们无法控制的事件引起的(比如自然灾害),真是的原因是人的本性以及信贷系统的运作。
背离趋势线的波动最主要是由于信贷的扩张以及收缩,也就是信贷周期:1)长债务周期(50-75年)(the long wave cycles)2)短债务周期(5-8年),又叫商业/市场周期。
债务周期我们发现不管什么时候我们说起周期,特别是长周期的波动,总是皱着眉头产生这样的想:预测经济周期就像是算命。
因此,在解释两种债务周期之前,先简单的解释下周期。
周期不过是由按逻辑顺序发生的事件,导致重复出现的形态。
在资本经济中,信贷扩张与收缩带动经济周期,并完全可以根据逻辑推理出来。
虽然每一次方式和时间未必完全一样,但形态与逻辑都很相似。
如果你玩过大富翁游戏(game of Monopoly),你就明白信贷和经济都有周期,一开始玩的时候,大家手里有很多现金,旅馆很少。
所以谁拥有的旅馆多,谁赚的钱就多。
于是玩家纷纷将现金转换成实物资产,随着越来越多的旅馆被收购,对现金的需求增多,但此时很多玩家现金都很少,于是不得不折价出售手中的旅馆。
在这场游戏中,最初实物资产持有者占优势,玩到后来则是现金为王。
高手是那些懂得在实物资产和现金之间保持最佳比例的玩家,不过所谓的最佳比例也在不停变换之中。
现在设想可以改变“大富翁”的游戏规则,允许游戏中的银行接受存款,也可以发放贷款。
这样玩家就可以借明天的钱来购置旅馆,也可以存款挣利息,而不是让手中的现金闲置。
如果“大富翁”可以这样玩,那就更接近真实的经济运行方式了。
相比没有借贷的情况,更多的钱会投入实物资产旅馆,欠款的总量会是实际流通量的很多倍,而依靠贷款成为旅馆拥有者的人现金缺口量更大,周期会显得更加突出。
当出现大量提现需求时,银行和存款者会遇到麻烦,而此时往往出现无法拿出现金的情况。
基本上,经济和信贷周期就是这么回事。
那么现在我们讨论两种债务周期是如何驱动经济周期。
当经济在产能利用率高时就出现繁荣,换句话说,就是需求能够容纳现有的生产能力。