metadisc的sroc数据解读
meta分析讲课

• sROC曲线不受阈值变化的影响,其更准确的反映 敏感度和特异度之间的关系。
• AUC代表诊断的准确性
Meta-DiSc是一款功能全面而专用于诊断 试验Meta分析的软件,采用多种计算方 法进Meta分析。这一软件已被多种高级 别杂志的论文应用或引用,足以证明其 功能强大,值得循证医学特别是诊断试 验工作者关注。
阴性似然比(-LR):出现在金标准确定有病的受试者阴性结果与出现在无病受试者 阴性结果的比值大小。 -LR越小,表明患目标疾病的可能性越小
统计软件使用
*异质性检验(Test of heterogeneity) *结果合成(Pooling data) *亚组分析(Sub-group analysis)
待评价试验及金标准试验:例数、检测方法、是否盲法、是否有 详细的操作过程报道
评价指标:TP、FP、FN、TN
文献质量评价标准
纳入研究的质量是否准确而严格直接影响着 诊断性系统评价的质量。--偏倚和异质性 常用评价标准: 1.STARD:诊断准确性研究报告标准(25条) 2.QUADAS:诊断精确性研究的质量评价方法(14条)
异质性检验(Test of heterogeneity)
目的:了解影响精确估计的可能因素和评价 统计合并不同研究的精确估计是否恰当
1.阈值效应
在诊断试验中,引起异质性最重要的因素之 一是阈值效应。当存在阈值效应时,灵敏度 和特异度呈负相关,在sROC曲线平面图上呈
“肩臂状”点分布。
视图检验
先通过sROC曲线平面图检验有无阈值效应:Analyze-Plots-在select plot下拉框中选“ROC Plane”并点击。则绘制出“ROC平面图”。
Meta分析的基本思想及顺序

M e t a分析的思想及步骤Meta分析的前身源于Fisher1920年“合并P值”的思想,1955年由Beecher首次提出初步的概念,1976年心理学家Glass进一步按照其思想发展为“合并统计量”,称之为Meta分析。
1979年英国临床流行病学家ArchieCochrane提出系统评价(systematicreview,SR)的概念,并发表了激素治疗早产孕妇降低新生儿死亡率随机对照试验的系统评价,对循证医学的发展起了举足轻重的作用。
Meta分析国内翻译为“荟萃分析”,定义是“Thestatisticalanalysisoflargecollectionofanalysisresultsfromindividual studiesforthepurposeofintegratingthefindings.”亦即“对具备特定条件的、同课题的诸多研究结果进行综合的一类统计方法。
”Meta从字源来说据考证有“Metalogic:abranchofanalyticphilosophythatdealswiththecriticalexaminationofthebasic conceptsoflogic”;“Metamathematics:thephilosophyofmathematics,especially,thelogicalsyntaxofmathematics.”其中最简洁并且一语中的的是Metascience::atheoryorscienceofscience,atheoryconcernedwiththeinvestigation?analysis?ordescriptionoftheoryitsel f.”意为一种科学中的科学或理论,一种对原理本身进行调查、分析和描述的原理。
Meta分析有广义和狭义两种概念:前者指的是一个科学的临床研究活动,指全面收集所有相关研究并逐个进行严格评价和分析,再用定量合成的方法对资料进行统计学处理得出综合结论的整个过程;后者仅仅是一种单纯的定量合成的统计学方法。
Meta分析的结果解释ppt课件

. metatrim logrr _selogES, funnel
34
35
. metacum td tnd cd cnd, sortby(cenid)
36
Meta分析的其它图形
37
星状图(Radial Plot)
38
加尔布雷图(Galbraith Plot)
39
拉贝图(L’Abbe Plot)
• 它是文献的量化综述,是以同一课题的多项独立 研究的结果为研究对象,在严格设计的基础上, 运用适当的统计学方法对多个研究结果进行系统 、客观、定量的综合分析。
11
Meta分析的步骤
• 提出问题,确定研究目的 • 检索相关文献 • 选择文献并进行严格评价 • 收集数据 • 对每个研究的特点等情况进行汇总描述 • 确定综合分析效应值的种类及统计分析计划 • 描述纳入研究的结果及其特征 • 异质性检验(heterogeneity test) • 计算合并效应量 • 敏感性分析
D max
Q (k Wi
1) Wi 2 Wi
, 0
17
进行Meta分析的软件
18
商业专用软件
• COMPREHENSIVE META ANALYSIS • MetaWin • EasyEA 2001
19
免费专用软件
• RevMan (Review Manager) • Meta-Stat • Epi Meta
20
含Meta分析模块的通用商业统计软件
• stata • SAS • WinBUGS • NCSS
21
含Meta分析模块的通用免费统计软件
•R
22
meta分析的统计学方法

BG
27
? 4. 选用随机效应模型合并效应量
? Meta 分析汇总研究结果时主要有两种统计分析模 型:固定效应模型和随机效应模型。
? 固定效应模型:指在 Meta 分析中假设研究间所有 观察到的变异都是由偶然机会引起的一种合并效 应量的计算模型。
BG
28
BG
29
BG
30
BG
31
? 随机效应模型:统计 Meta分析中研究内抽样误差 和研究间变异以估计结果的不确定性的模型。当 包括的研究存在除偶然机会外的异质性时,随机 效应模型将给出比固定效应模型更宽的可信区间。
? 例如,有一系列药物可以治疗某种疾病,但RCT均是 药物与安慰剂的对照,而药物相互之间的RCT都没有 进行或很少,那么在这种情况下,就需要将间接比较 和直接比较的证据进行合并。
BG
8
Cipriani A, et al. Comparative efficacy and acceptability of antimanic drugs in acute mania: a multiple-
? 来源
? 不同的设计方案:完全随机与半随机设计、分配隐藏充分与 不充分、采用盲法与不采用盲法等;
? 不同的结果测量方法:不同的测评方法、不同的测量指标和 不同的度量单位等。
BG
22
? 3. 统计学异质性:不同试验间被估计的治疗效应的变 异,它是研究间临床和方法学上多样性的直接结果。
? 统计学分析异质性的思路是:所有统计学异质性均来自于临 床异质性和方法学异质性。
BG
39
比值比OR
? 在回顾性研究(如病例对照研究)中,往往无法 得到某事件的发生率,也就无法计算 RR。但是当 该发生率很低时,可以计算出 OR作为RR的近似 值,其含义是试验组的比值与对照组的比值之比, 即比值比。
诊断性me分析手把教你做临床Me分析诊断试验性MeDisc分析

阴性结果的Meta分析,最关键是能够对为什么会出现该结果进行深刻的讨论,一篇文章写的好不好也体现在讨论部分,体现作者水平的部分,读者也是根据你的讨论来对你的结果有分寸的慎重的来指导临床。讨论部分的切入点可以通过亚组分析的结果来体现。亚组分析能够很好的帮我们找到异质性来源。如果亚组分析结果既有养性又有阴性,那么可以重点讨论导致这两种结果出现的原因是什么。
安装软件
Meta-DiSc 是一个免费的下载软件,登录 ,下载安装软件,目前最新版本是 版。
运行软件
在试行此软件之前,必须明确和熟悉准确诊断性 Meta 分析里结果计算的经典四格表(可能不会在您所纳入的文献中出现,需要研究人自己总结并准确的填写在四格表内,不易混淆而且方便分析)。
TP:True positive 表示真阳性的结果,用数字表示;
介绍到这里就结束了,大家赶快去下载软件试一下吧。
诊断性meta分析简单实现(4) 结果的展示和解读
例文结果展示和解读
诊断性meta分析简单实现——第一章?和范文解析
诊断性meta分析简单实现(2)
诊断性meta分析简单实现(3)
当我们做完了上述的统计分析之后,结果需要整理一下,我们看看例文的作者是如何呈现这些结果的!
二.诊断性meta分析亚组分析问题求助
你说的后边的不对,比如排除平均年龄大于80的文献。
这句话是正确的,或者纳入排除研究后的meta分析,排除营养不良率大于60%的文献而亚组分析主要从文献里病例特性来排除,等等
亚组分析主要从文献里分组病例特征分类。
敏感性分析是排除低质量研究后的meta分析。
亚组分析是根据纳入研究的病人特点适当氦孩份绞莓悸逢溪抚娄的进行分层,过多的分层和过少的分层都是不好的
完结篇:如何解读meta分析结果Meta简明教程(8)
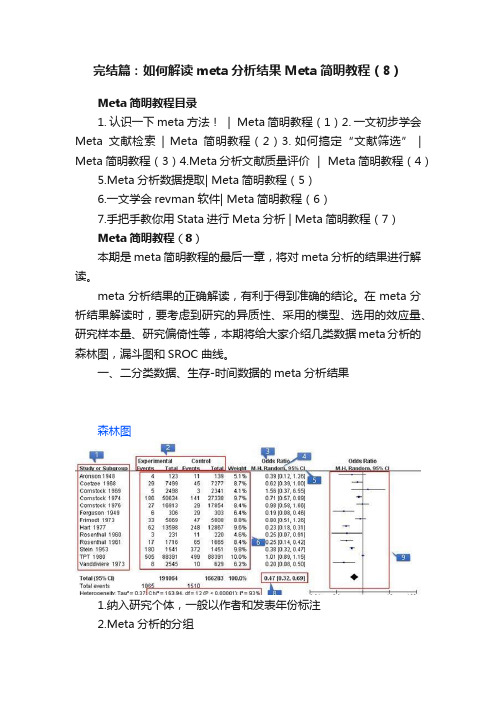
完结篇:如何解读meta分析结果Meta简明教程(8)Meta简明教程目录1. 认识一下meta方法! | Meta简明教程(1)2. 一文初步学会Meta文献检索| Meta简明教程(2)3. 如何搞定“文献筛选” | Meta简明教程(3)4.Meta分析文献质量评价 | Meta简明教程(4)5.Meta分析数据提取| Meta简明教程(5)6.一文学会revman软件| Meta简明教程(6)7.手把手教你用Stata进行Meta分析 | Meta简明教程(7)Meta简明教程(8)本期是meta简明教程的最后一章,将对meta分析的结果进行解读。
meta分析结果的正确解读,有利于得到准确的结论。
在meta分析结果解读时,要考虑到研究的异质性、采用的模型、选用的效应量、研究样本量、研究偏倚性等,本期将给大家介绍几类数据meta分析的森林图,漏斗图和SROC曲线。
一、二分类数据、生存-时间数据的meta分析结果森林图1.纳入研究个体,一般以作者和发表年份标注2.Meta分析的分组3.合并效应值,RR值、OR值、RD值、HR值,(Meta分析数据提取| Meta简明教程(5))已做介绍,需要根据纳入研究的设计方法,选择合适的效应指标分析4.Meta分析模型,可分为固定效应模型和随机效应模型,根据纳入文献的异质性进行选择5.各研究效应量及合并效应量的95%可信区间6.纳入分析的数据和权重7.异质性检验,p<0.05或I2>50%,认为各研究存在异质性,选用随机效应模型;P>0.05且I2<50%,不能认为各研究存在异质性,选用固定效应模型。
8.合并效应量OR值及可信区间,可信区间包含1,说明不认为两组率存在差异;可信区间不包含1,说明两组率存在差异9.各研究及合并效应量、可信区间,横线或菱形与竖线交叉,说明研究无统计学意义;研究中间方块面积越大,说明在分析中占权重越大二、连续型数据的meta分析结果森林图1.纳入研究个体,一般以作者和发表年份标注2.Meta分析的分组3.合并效应值,WMD、SMD值(Meta分析数据提取| Meta简明教程(5))已做介绍。
白细胞介素-6对新生儿脓毒症早期诊断价值的Meta分析

•论著•DOI: 10. 3969/j.issn.1672-8521. 2016. 04 . 007白细胞介素-6对新生儿脓毒症早期诊断价值的Meta分析牛瑶1雍娴辞2朱有森1(1.新疆医科大学第一附属医院医学检验中心,新疆乌鲁木齐830054;2.新疆医科大学公共卫生学院,新疆乌鲁木齐830011)【摘要】目的:探讨白细胞介素-6 (IL-6)对新生儿脓毒症的早期诊断价值。
方法:计算机检索获得IL-6对新生儿脓毒症的诊断性研究文献,检索数据库为Cochrane Library、PubMed、EMBASE、维普中文科技期刊数据库、Medline、Web of knowledge、中国生物医学文献数据库、中国知网(CNKI)和万方数据库。
检索时间为 建库至2016年8月,按照QUADAS标准对纳入文献进行质量评估,使用MetaDisc1.4软件进行M eta分析,对其 敏感度、特异度、诊断比值比进行汇总,行敏感性分析及异质性检验,绘制综合受试者工作特征曲线(SROC)。
结 果:初检到542篇文献,最终14篇文献符合纳入标准进入M eta分析。
釆用随机效应模型进行M eta分析,结果显示 合并敏感度为 0.72[95%CI(0.69,0.74)],特异度为 0.85[95%CI(0.83,0.87)],阳性似然比为 5.98[95%CI(3.79,9.43)],阴性似然比为 0.23[95% CI(0.15,0.37)],诊断比值比为 29.23[95% CI(14.79,57.77)]。
SROC 曲线下面积AUC=0.919 9(Q*=0.853 2)。
结论:在早期新生儿脓毒症患者中,IL-6对患儿诊断脓毒症有较好的敏感度和特异度,即IL-6升高的患儿诊断为脓毒症的可能性较高,但在实际临床工作中仍需参考其他实验室相关检查及具体临床表现进 行诊断。
关键词白细胞介素-6 新生儿 脓毒症 诊断值 M eta分析Early diagnostic value of interleukin-6 for sepsis in neonates: a meta-analysisNiu Yao*, Yong Xianting, Zhu Yousen. *Department of Laboratory Medicine, The First Affiliated Hospital, Xinjiang Medical University, Urumqi 830054, Xinjiang, ChinaCorresponding author: Zhu Yousen (E-mail: 547292474@)Abstract Objective: To investigatethe early diagnostic value of interleukin-6 (IL-6) for sepsis in neonates.Methods:A comprehensive electronic search was performed to retrieve relevant studies on IL-6 in diagnosis of sepsis in Neonates. The data bases included Cochrane Library, PubMed, EMBASE, VIP database, Medline, Web of knowledge, Chinese BioMedicine Database, CNKI and Wanfang Database. The time range was from the initiation of the database to August 2016, and QUADAS items were used to evaluate the quality of the included studies. The pooled specificity, pooled sensitivity, negative likelihood ratio, positive likelihood ratio and summary receiver operating characteristic curve (SROC) were analyzed by the Meta-Disk 1.4 software. Finally, the sensitivity analysis and analysis for heterogeneity cause were performed. Results: Fourteen studies screened from 542 related articles were included in the review. The meta-analysis of DerSimonia-Laird showed that the pooled sensitivity was 0.72 [95% CI (0.69,0.74) ] and the pooled specificity was 0.85 [95% CI (0.83,0.87) ]. The positive likelihood ratio and negative likelihood ratio were 5.98 [95% CI (3.79,9.43) ] and 0.23 [95% CI (0.15,0.37) ], respectively. The diagnostic odds ratio was 29.23 [95% CI (14.79,57.77) ], overall area under the curve (AUC) of SROC curve was 0.919 9 (Q*=0.853 2).Conclusions: In the early sepsis, IL-6 has higher sensitivity and specificity for diagnosis of sepsis in neonates. IL-6 increases the probability for diagnosis of sepsis, but it needs to combine with clinical manifestations and other related laboratory tests for the diagnosis.Key words: Interleukin-6; Neonates; Sepsis; Diagnostic value; Meta-analysis脓毒症(sepsis)是指由严重感染引起的全 身多脏器功能衰竭及相关的全身炎症反应,并且临 床上证实存在相关细菌感染病灶。
英文meta-disc使用
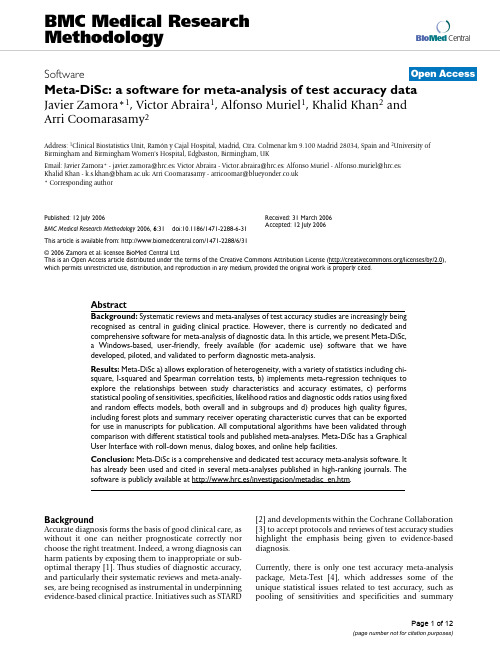
Bio Med CentralBMC Medical Research MethodologySoftwareMeta-DiSc: a software for meta-analysis of test accuracy dataJavier Zamora*1, Victor Abraira 1, Alfonso Muriel 1, Khalid Khan 2 andArri Coomarasamy 2Address: 1Clinical Biostatistics Unit, Ramón y Cajal Hospital, Madrid, Ctra. Colmenar km 9.100 Madrid 28034, Spain and 2University of Birmingham and Birmingham Women's Hospital, Edgbaston, Birmingham, UKEmail: Javier Zamora*-javier.zamora@hrc.es; Victor Abraira -Victor.abraira@hrc.es; Alfonso Muriel -Alfonso.muriel@hrc.es; Khalid Khan -k.s.khan@; Arri Coomarasamy -arricoomar@ * Corresponding authorAbstractBackground: Systematic reviews and meta-analyses of test accuracy studies are increasingly being recognised as central in guiding clinical practice. However, there is currently no dedicated and comprehensive software for meta-analysis of diagnostic data. In this article, we present Meta-DiSc,a Windows-based, user-friendly, freely available (for academic use) software that we have developed, piloted, and validated to perform diagnostic meta-analysis.Results: Meta-DiSc a) allows exploration of heterogeneity, with a variety of statistics including chi-square, I-squared and Spearman correlation tests, b) implements meta-regression techniques to explore the relationships between study characteristics and accuracy estimates, c) performs statistical pooling of sensitivities, specificities, likelihood ratios and diagnostic odds ratios using fixed and random effects models, both overall and in subgroups and d) produces high quality figures,including forest plots and summary receiver operating characteristic curves that can be exported for use in manuscripts for publication. All computational algorithms have been validated through comparison with different statistical tools and published meta-analyses. Meta-DiSc has a Graphical User Interface with roll-down menus, dialog boxes, and online help facilities.Conclusion: Meta-DiSc is a comprehensive and dedicated test accuracy meta-analysis software. It has already been used and cited in several meta-analyses published in high-ranking journals. The software is publicly available at http://www.hrc.es/investigacion/metadisc_en.htm.BackgroundAccurate diagnosis forms the basis of good clinical care, as without it one can neither prognosticate correctly nor choose the right treatment. Indeed, a wrong diagnosis can harm patients by exposing them to inappropriate or sub-optimal therapy [1]. Thus studies of diagnostic accuracy,and particularly their systematic reviews and meta-analy-ses, are being recognised as instrumental in underpinning evidence-based clinical practice. Initiatives such as STARD[2] and developments within the Cochrane Collaboration [3] to accept protocols and reviews of test accuracy studies highlight the emphasis being given to evidence-based diagnosis.Currently, there is only one test accuracy meta-analysis package, Meta-Test [4], which addresses some of the unique statistical issues related to test accuracy, such as pooling of sensitivities and specificities and summaryPublished: 12 July 2006BMC Medical Research Methodology 2006, 6:31doi:10.1186/1471-2288-6-31Received: 31 March 2006Accepted: 12 July 2006This article is available from: /1471-2288/6/31© 2006 Zamora et al; licensee BioMed Central Ltd.This is an Open Access article distributed under the terms of the Creative Commons Attribution License (/licenses/by/2.0), which permits unrestricted use, distribution, and reproduction in any medium, provided the original work is properly cited.receiver operating characteristics (sROC) analysis. How-ever, it is a DOS-based application with an interface that many find difficult to use, and integrate into Windows-based applications. Moreover, it lacks crucial analytical tools such as pooling of likelihood ratios (LRs), tests for heterogeneity and meta-regression facilities.We, therefore, developed, piloted and validated a compre-hensive, Windows-based test accuracy meta-analysis soft-ware, Meta-DiSc, which is presented in this article, with a worked example.ImplementationMeta-DiSc software was created in Microsoft Visual Basic 6, and some mathematical routines have been linked from the NAG C mathematical library [5]. The software is distributed as a single file, downloadable freely from URL: http://www.hrc.es/investigacion/metadisc_en.htm. Its installation is simple, guided by onscreen instructions. The programme has a user-friendly interface with roll-down menus, dialog boxes and online HTML compiledhelp files. These help files include a user manual and a description of the implemented statistical methods. Meta-DiSc allows data entry into its datasheet in three dif-ferent ways: a) directly by typing data into the datasheet using the keyboard, b) copying from another spreadsheet (e.g. Microsoft Excel) and pasting into Meta-DiSc datash-eet, or c) importing text files from other sources (for exam-ple, in the comma delimited format). Several variables can be defined in the datasheet, including study identifi-ers, accuracy data from each study (true positives, false positives, true negatives and false negatives) and study level co-variates, such as those defining population spec-trum or methodological quality of the studies.Once the data have been entered into the datasheet of Meta-DiSc, various statistical analyses can be imple-mented (Figure 1). The implementation of these statistical procedures needs to be carefully thought through and judicious, as it may be inappropriate (or indeed mislead-ing) to use all the procedures (particularly statistical pool-ing) in all reviews. Meta-DiSc provides analysts with adequate tools to assess the appropriateness of pooling. Readers interested in details of these methods are referred to statistical methods section of the help files (also avail-able as a PDF standalone document [6] and to existing texts and guidelines on diagnostic meta-analysis [7-10]. Describing the results of individual studiesWhen describing accuracy results from several studies, it is important to get an indication of the magnitude and pre-cision of the accuracy estimates derived from each study, as well as to assess the presence or absence of inconsisten-cies in accuracy estimates across studies (heterogeneity).As accuracy estimates are paired and often inter-related (sensitivity and specificity, or LR positive and LR nega-tive), it is necessary to report these simultaneously [11]. One accuracy measure that combines these paired meas-ures is diagnostic odd ratio (dOR) [12], which has limited clinical use, although useful in procedures like meta-regression (see below).Meta-DiSc computes accuracy estimates and confidence intervals from individual studies and shows results either as numerical tabulations or graphical plots in two for-mats: a) forest plots, for sensitivities, specificities, LRs or dOR, with respective confidence intervals; and b) plots of individual study results in ROC space, with or without an sROC curve.Exploring heterogeneity (threshold effect)Exploring heterogeneity is a critical issue to a) understand the possible factors that influence accuracy estimates, and b) to evaluate the appropriateness of statistical pooling of accuracy estimates from various studies. One of the pri-mary causes of heterogeneity in test accuracy studies is threshold effect, which arises when differences in sensitiv-ities and specificities or LRs occur due to different cut-offs or thresholds used in different studies to define a positive (or negative) test result. When threshold effect exists, there is a negative correlation between sensitivities and specificities (or a positive correlation between sensitivities and 1-specificities), which results in a typical pattern of "shoulder arm" plot in a sROC space [8]. It is worth not-ing that correlation between sensitivity and specificity could arise due to a number of reasons other than thresh-old (e.g. partial verification bias, different spectrum of patients or different settings).Figure 1Available tools in Meta-DiSc. Tools implemented in the software Meta-DiSc to perform different steps of meta-analy-sis of diagnostic tests accuracy.Meta-DiSc allows assessment for threshold effect in three different ways: a) visual inspection of relationship between pairs of accuracy estimates in forest plots. If threshold effect is present, the forest plots will show increasing sensitivities with decreasing specificities, or vice versa. The same inverse relationship will be apparent with LR positive and LR negative; b) representation of accuracy estimates from each study in a sROC space – a typical "shoulder arm" pattern would suggest presence of threshold effect; and c) computation of Spearman correla-tion coefficient between the logit of sensitivity and logit of 1-specificity. A strong positive correlation would suggest threshold effect.Exploring for heterogeneity (other than threshold effect) Apart from variations due to threshold effect, there are several other factors that can result in variations in accu-racy estimates amongst different test accuracy studies in a review. These reasons include chance as well as variations in study population (e.g. severity of disease and co-mor-bidities), index test (differences in technology, assays, operator etc.), reference standard, and the way a study was designed and conducted [13]. Since such heterogeneity is almost always present in accuracy systematic reviews, test-ing for the presence and the extent of heterogeneity of results between primary studies, prior to undertaking any meta-analysis, is a critical part of any diagnostic review, as is exploration of the possible causes of heterogeneity [14]. Meta-DiSc allows users to test for heterogeneity amongst various studies in two different ways: a) Visual inspection of forest plots of accuracy estimates. If the studies are rea-sonably homogeneous, the accuracy estimates from indi-vidual studies will lie along a line corresponding to the pooled accuracy estimate. Large deviations from this line will indicate possible heterogeneity; b) statistical tests, including Chi-square and Cochran-Q, which are automat-ically implemented during analysis to evaluate if the dif-ferences across the studies are greater than expected by chance alone. A low p-value will suggest presence of het-erogeneity beyond what could be expected by chance alone. In addition to these heterogeneity statistics, Meta-DiSc computes the inconsistency index (I-squared) which has been proposed as a measure to quantify the amount of heterogeneity [15].Meta-regressionIf substantial heterogeneity is found to be present from the analyses detailed above, then reasons for such hetero-geneity can be explored by relating study level co-variates (e.g., population, test, reference standard or methodolog-ical features) to an accuracy measure, using meta-regres-sion techniques. The accuracy measure that is normally used is dOR, as it is a unitary measure of diagnostic per-formance that encompasses both sensitivity and specifi-city or both LR positive and LR negative. Using dOR as a global measure of accuracy is a suitable method to com-pare the overall diagnostic accuracy of different tests [13]. However, its use is limited because it cannot be used directly in clinical practice and, furthermore, possible opposing effects of a study characteristic on sensitivity or specificity may be masked by using dOR.Meta-DiSc implements meta-regression using a generali-zation of Littenberg and Moses Linear model [8,13] weighted by inverse of the variance or study size or unweighted. Random effects between studies can be esti-mated by different methods and added to the weighting scheme [16]. Estimations of coefficients of the model are performed by least squares method as implemented in NAG mathematical routines. The outcome variable is ln(dOR) which is related via a linear model to any number of study level covariates, and optionally includ-ing the variable representing threshold effect [13]. The outputs from meta-regression modelling in Meta-DiSc are the co-efficients of the model, as well as ratio of dOR (rdOR) with respective confidence intervals. If a particular study level co-variate is significantly associated with diag-nostic accuracy, then its co-efficient will have a low p-value, and the rdOR will give a measure of magnitude of the association.More advanced meta-regression techniques such as Hier-archical sROC model [17] and bivariate analysis of sensi-tivity and specificity [18] has been developed. These methods overcome some of the statistical shortcomings inherent to Littenberg and Moses model [8,19]. Statistical poolingStatistical pooling is not always appropriate or necessary in every systematic review of test accuracy studies. How-ever, when used appropriately, pooling can provide useful summary information. The necessary precondition for simple pooling (weighted averaging) of each of sensitivi-ties, specificities, LR positives and LR negatives, is that the studies and results are reasonably homogeneous (i.e. no substantial heterogeneity, including threshold effect, is present). If heterogeneity due to threshold effect were present, the accuracy data can be pooled by fitting a sROC curve and summarising that curve by means of the Area Under the Curve (AUC) or using other statistics such as the Q* index [19] (i.e. the point of the curve in which sen-sitivity equals specificity). If there is heterogeneity due to sources other than threshold effect, then pooling should only be attempted within homogeneous subsets, which would normally have been defined a priori.Meta-DiSc has comprehensive functionality for statistical pooling: a) It allows pooling of sensitivities, specificities, LR positive and LR negative each separately, using eitherfixed or random effect [10,20] models. The output from these analyses are presented numerically in tables, and graphically as forest plots. Pooled estimates are provided with their respective confidence intervals; b) It imple-ments several ways to fit a sROC curve when threshold effect is present. Default option is to compute a symmet-rical sROC curve after fitting the linear model proposed by Littenberg and Moses. However, users can choose differ-ent options to fit this curve, for example, combining indi-vidual dORs by the Mantel-Haenszel or the DerSimonian Laird methods [10,20] to estimate an overall dOR, and then fitting an sROC curve. When the dOR changes with diagnostic threshold, the sROC curve is asymmetrical. Meta-DiSc allows the user to check for asymmetry of the sROC curve, and fit an asymmetrical sROC curve if appro-priate. Finally, Meta-DiSc allows estimation of AUC and the Q* index, along with their standard errors, as a sum-mary measure of global accuracy which also aids inter-test comparisons; c) Meta-DiSc allows pooling of various summary measures within subgroups defined by study level co-variates with the help of a filter utility.Wherever possible, the results of the above statistical pro-cedures were validated using different general purpose sta-tistical software such as STATA (ver 8.2) and SAS (8.2) using actually published and simulated data sets (Table 1).ResultsWe illustrate the various procedures that Meta-DiSc implements in a case-study of ultrasound test in the diag-nosis of uterine pathology [21,22]. Ultrasound measure-ment of the lining of the uterus (endometrium) can predict pathology such as endometrial hyperplasia (a pre-cancerous condition) or cancer. The greater the thickness of endometrium, the more likely that the target condition is present. Various thresholds (such as 3, 4 or 5 mm etc) have been used to define a positive ultrasound result.A systematic review of test accuracy studies identified 57 studies. Figure 2 shows a datasheet in Meta-DiSc which has been loaded with information from these 57 studies. The information includes study identifiers, accuracy data,Table 1: Validation of statistical procedures. Validation of different statistical procedures using a simulated data-set. Results of Meta-DiSc (version 1.4) are compared with those obtained with metan (version 1.86) and metareg (version 1.06) STATA commands. Prior to the analyses, all four cells of all studies were added with 1/2 to avoid division by zero when computing some indices or standard errors. Meta-DiSc and STATA data-set are provided as additional files [see Additional file 1] and [see Additional file 2].ResultsProcedure Meta-DiSc (version 1.4)STATA (ver 8.2)Random Effect ModelPooled +ve LR 2.447 2.447(95%(CI)(2.085 – 2.871)(2.085 – 2.871)Tau-square0.09320.0932Cochrane-Q139.71139.71Pooled -ve LR0.1570.157(95%(CI)(0.095 – 0.257)(0.095 – 0.257)Tau-square0.46310.46357Cochrane-Q33.0033.07Fixed Effect ModelPooled +ve LR 2.330 2.330(95%(CI)(2.208 – 2.459)(2.208 – 2.459)Cochrane-Q139.71139.71Pooled -ve LR0.1050.104(95%(CI)(0.073 – 0.149)(0.073 – 0.148)Cochrane-Q33.0033.07Meta-Regression1Tau-Square0.11410.1141Constant coefficient (SE) 2.520 (0.8370) 2.5197 (0.83699)S coefficient (SE)0.330 (0.1912)0.3304 (0.19123)Covariable coefficient (SE)-0.036 (0.0904)-0.0355 (0.09041)(1) Meta-regression was weighted by the inverse of the variance of dOR and between study variance was estimated by REML.thresholds, and some study level co-variates (such as hor-mone replacement therapy use).As the first step in the analysis, we have used Meta-DiSc to present accuracy measures from each individual study in forest plots for sensitivities (figure 3a), specificities (figure 3b), LRs (figures 4a and 4b) and dOR (figure 5). All these indices can also be represented in tabular form as shown in table 2. Although the forest plots and the tables contain a pooled summary at the bottom, at this early stage in the analysis, it is recommended that the plots are used to obtain a general overview of the accuracy estimates from each study, and the interpretation of the pooled summary is left to later stages of analysis.The next step is the representation of sensitivity against 1-specificity from each study in a ROC space (figure 6), which can be used for exploration for threshold effect. The pattern of the points in this plot suggest a "shoulder-arm" shape, indicating the possibility of threshold effect. We, therefore, performed a Spearman rank correlation as a fur-ther test for threshold effect, and found that there was fur-ther indication of threshold effect (Table 3, Spearman correlation coefficient = 0.394; p = 0.006). Having found some clues about the presence of threshold effect, we now focus on a subgroup of 21 studies that used a singular threshold of >5 mm to define test positivity. Although an explicit threshold of 5 mm was used in these studies, there can still be an implicit threshold effect due to, for exam-ple, variation in the interpretation of the test results. Therefore, within this subgroup with an explicit threshold of 5 mm, it is still recommended that the above explora-tions for threshold effect are undertaken. We performed such analyses for this subgroup in Meta-DiSc, and found no evidence of further threshold effect (data not shown). There are a number of other more advanced methods notFigure 2Meta-Disc datasheet. Meta-DiSc data set with details of test accuracy studies of ultrasound in the prediction of endometrialcancer.implemented in Meta-DiSc that allow to incorporate explicitly information about tests thresholds defined between or within studies [17].As the next step, heterogeneity arising from factors other than threshold effect is explored. We performed a visual exploration of the forest plots of accuracy measures for these 21 studies as well as statistical tests for heterogeneity (Meta-DiSc output not shown). In addition, possible sources of heterogeneity across the studies were explored using meta-regression analysis with the following co-vari-ates as predictor variables: use or non-use of hormone replacement therapy (HRT); technique of ultrasound measurement (single or double layer); and population enrolment (consecutive or other). Results are shown in Table 4, which suggest that the number of layers is strongly associated with accuracy. The double layer tech-nique is associated with two times higher accuracy com-pared to single layer measurement (rdOR = 2.04; 95% CI: 1.01–4.13; p = 0.048)The final step in the analysis is pooling if this is consid-ered appropriate. We illustrate pooling of the LRs for neg-ative test results in one homogenous subgroup of studies of non-HRT users, with a test threshold of ≤ 5 mm, and using a single layer technique (Figure 7). Finally, we dem-onstrate sROC curve fitting in the presence of threshold effect for the whole data-set in Figure 8.Discussion and conclusionMeta-DiSc allows description of individual study results; exploration of heterogeneity with a variety of statistics including chi-square, I-squared and Spearman correlation tests; implements meta-regression techniques to explore the relationships between study characteristics and accu-racy estimates; performs statistical pooling of sensitivities,Figure 3Forest plot. Forrest plot of sensitivities (3a) and specificities (3b) from test accuracy studies of ultrasound in the prediction of endometrial cancer.specificities, likelihood ratios and diagnostic odds ratios, using fixed and random effects models, both overall and in subgroups; and produces high quality figures, includ-ing forest plots and summary receiver operating character-istic curves that can be exported for use in manuscripts for publication.Meta-DiSc is an evolving software. As new diagnostic meta-analytic methods become established over time, they will be implemented into the program in the future. For example, bivariate method of pooling sensitivity and specificity [18] is currently being developed. We will care-fully follow the progress in this field. Once accepted as an established meta-analytic method, it will be implemented in Meta-DiSc. On similar lines, methods of data extraction from individual studies that only provide accuracy meas-ures are currently being developed within our depart-ment. Once these methods have been verified, we will implement this option to assist systematic reviewers in extracting 2-by-2 tables from such studies.Meta-DiSc is a comprehensive and dedicated test accuracy meta-analysis software. All computational algorithms in it have been validated through comparison with different statistical tools and published meta-analyses. Its use and citation in several meta-analyses published in high-rank-ing journals is evidence of external validation of its high quality [23-28].Availability and requirementsThe software is publicly available at http://www.hrc.es/ investigacion/metadisc_en.htm.Operating system: The software runs on Windows based personal computers (Windows 95 or higher) with Pen-tium-class processor or equivalent, with minimum of 32Figure 4Forest plot. Forrest plot of likelihood ratios for positive (4a) and negative (4b) test results from studies of ultrasound in the prediction of endometrial cancer.Figure 5Forrest plot. Forest plot of diagnostic odds ratios (dOR) from test accuracy studies of ultrasound in the prediction of endometrial cancer.Table 2: Tabulation of Likelihood ratio for positive test result (LR+) with respective 95% confidence intervals from all test accuracy studies included in systematic review of ultrasound for prediction of endometrial cancer.Study LR+[95% Conf. Iterval.]% WeightAuslender1,9941,623-2,4492,54Zannoni2,0921,919-2,2802,77Bakour1,8951,490-2,4082,45Botsis7,3604,437-12,2081,69Fistonic1,2001,045-1,3782,69Garuti1,4711,358-1,5932,78Granberg2,0661,935-2,2062,79Guner1,8341,569-2,1442,65Haller1,3211,118-1,5612,63Tsuda2,5171,964-3,2252,43Varner1,7950,842-3,8261,13Abu Ghazzeh1,2150,538-2,7451,03Briley1,8551,396-2,4652,33Cacciatore1,2390,877-1,7522,15DeSilva1,3060,245-6,9570,34Granberg3,9372,933-5,2842,30Grigoriou2,9462,430-3,5722,57Gu1,3070,956-1,7872,25Gupta1,8460,783-4,3500,96Hänggi4,0002,472-6,4731,76Ivanov2,2731,691-3,0542,30Karlsson2,6491,936-3,6272,24Loverro5,9573,648-9,7291,73Malinova1,9631,591-2,4212,53Merz1,6971,287-2,2362,35Nasri2,7401,833-4,0961,98Nasri2,4001,711-3,3672,17Pertl1,2931,115-1,4992,67Suchocki1,1201,027-1,2222,77Taviani1,8020,983-3,3041,44Weber1,6181,374-1,9042,64Wolman2,4811,556-3,9561,80Moreles2,3121,845-2,8962,49Rudigoz2,9811,638-5,4261,46Todorova1,6670,729-3,8081,01Gruboeck7,0363,689-13,4221,35Chan2,5431,779-3,6352,12Degenhardt2,5161,856-3,4112,27Dijkhuizen1,8591,389-2,4892,31Brolmann2,0171,487-2,7362,27Ceccini3,2672,655-4,0212,54Masearetti2,0591,096-3,8661,38Mortakis2,2131,602-3,0582,22Schramm1,2410,899-1,7142,22Smith1,9381,252-3,0011,88Osmers1,9641,699-2,2712,68Seelbach-Göbel1,6801,455-1,9402,68Altuncu et al.29,1674,089-208,020,25(REM) pooled LR+2,0871,881-2,315Heterogeneity chi-squared = 506,06 (d.f.= 47) p = 0,000Inconsistency (I-square) = 90,7%No. studies = 48.Filter OFFAdd 1/2 only zero cell studiesTable 3: Results of Spearman rank correlation of sensitivity against (1 – specificity) to assess the threshold effect in all test accuracy studies included in systematic review of ultrasound for prediction of endometrial cancer.Var.Coeff.Std. Error T p-valueA 2.4120.2928.2660.0000b(1)0.1870.101 1.8570.0697 Spearman correlation coefficient: 0,394 p-value = 0,006 (Logit(TPR) vs Logit(FPR)Moses' model (D = a + bS)Unweighted regressionTau-squared estimate = 0,3540(Convergence is achieved after 2 iterations)Restricted Maximum Likelihood estimation (REML)No. studies = 48Filter OFFTable 4: Results of meta-regression analysis for predicting the presence or absence of endometrial carcinoma with variables: use or non-use of hormone replacement therapy (HRT); technique of ultrasound measurement (single or double layer); and population enrolment (consecutive or other).Meta-Regression(Inverse Variance weights) (1)Var.Coeff.p-value RDOR[95%CI]Cte.0,8570,1571--------S0,2630,0208--------Layers0,7090,06102,03(0,97;4,27) Consecutive0,2060,73981,23(0,35;4,26)HRT0,3240,41521,38(0,63;3,06)Meta-Regression(Inverse Variance weights) (2)Var.Coeff.p-value RDOR[95%CI]Cte.0,8490,1565--------S0,2530,0194--------Layers0,7390,04242,09(1,03;4,27)HRT0,3200,41521,38(0,63;3,02)Meta-Regression(Inverse Variance weights) (3)Var.Coeff.p-value RDOR[95%CI]Cte.0,9590,0999--------S0,2580,0166--------Layers0,7120,04822,04(1,01;4,13)Figure 7Forrest plot . Forrest plots of Likelihood ratios for positive (7a) and negative (7b) test results in one homogenous sub-group of studies of non-HRT users, with a test threshold of ≤ 5 mm, and using a single layer technique.Figure 6ROC Space . Representation of sensitivity against (1-specifi-city) in Receiver Operating Characteristics space for each study of ultrasound in the prediction of endometrial cancer.Figure 8sROC curve . Receiver operating characteristics curve for all studies included in systematic review of ultrasound for prediction of endometrial cancer.MB of RAM and minimum of 20 MB of hard disk space. SVGA color monitor; minimum 800 × 600 screen resolu-tion and 256 colors.Licence: Freeware for academic use.Competing interestsThe author(s) declare that they have no competing inter-ests.Authors' contributionsJZ conceived the idea. AM, VA and JZ developed the soft-ware. AC and KSK tested the software on a number of reviews and gave suggestions for improvements. All authors participated in preparing this manuscript. Additional materialAcknowledgementsThis work has been partly funded by Spanish Health Ministry Grants no PI02/0954, G03/090 and PI04/1055.References1.Thomson R, McElroy H, Sudlow M: Guidelines on anticoagulanttreatment in atrial fibrillation in Great Britain: variation in content and implications for treatment.BMJ 1998, 316:509-513.2.Bossuyt PM, Reitsma JB, Bruns DE, Gatsonis CA, Glasziou PP, IrwigLM, Lijmer JG, Moher D, Rennie D, de Vet HC: Towards complete and accurate reporting of studies of diagnostic accuracy: The STARD Initiative.Radiology 2003, 226:24-28.3.Collaboration C: M ethods Groups Newsletter.http://wwwcochrane org/newsl ett/MGNews-2004 pdf 2006 [http:// /newslett/MGNews-2004.pdf].u J: Meta-Test. Boston: New England Medical Center; 1997.5.The NAG C Library, M ark6. Oxford: Numerical AlgorithmsGroup; 2004.6.Zamora J, Muriel A, Abraira V: Meta-DiSc Statistical Methods.2006 [ftp://ftp.hrc.es/pub/programas/metadisc/ MetaDisc_StatisticalMethods.pdf].7.Irwig L, Tosteson ANA, Gatsonis C, Lau J, Colditz G, Chalmers TC,Mosteller F: Guidelines for Metaanalyses Evaluating Diagnos-tic-Tests.Annals of Internal Medicine 1994, 120:667-676.8.Moses LE, Shapiro D, Littenberg B: Combining independent stud-ies of a diagnostic test into a summary ROC curve: data-ana-lytic approaches and some additional considerations.Stat Med 1993, 12:1293-1316.9.Deville WL, Buntinx F, Bouter LM, Montori VM, de Vet HC, van derWindt DA, Bezemer PD: Conducting systematic reviews of diagnostic studies: didactic guidelines.BMC Med Res Methodol 2002, 2:9.10.Deeks JJ: Systematic reviews of evaluations of diagnostic andscreening tests studies. In Systematic reviews in health care: meta-analysis in context 2nd Edition edition. Edited by: Egger M, Davey SG and Altman DG. BMJ Books; 2001.11.Honest H, Khan KS: Reporting of measures of accuracy in sys-tematic reviews of diagnostic literature.Bmc Heal th Services Research 2002, 2:.12.Glas AS, Lijmer JG, Prins MH, Bonsel GJ, Bossuyt PM: The diagnos-tic odds ratio: a single indicator of test performance.J Clin Epi-demiol 2003, 56:1129-1135.13.Lijmer JG, Bossuyt PM, Heisterkamp SH: Exploring sources of het-erogeneity in systematic reviews of diagnostic tests.Stat Med 2002, 21:1525-1537.14.Dinnes J, Deeks J, Kirby J, Roderick P: A methodological reviewof how heterogeneity has been examined in systematic reviews of diagnostic test accuracy.Health Technol Assess 2005, 9:1-113.15.Higgins JP, Thompson SG: Quantifying heterogeneity in a meta-analysis.Stat Med 2002, 21:1539-1558.16.Thompson SG, Sharp SJ: Explaining heterogeneity in meta-anal-ysis: a comparison of methods.Stat Med 1999, 18:2693-2708.17.Rutter CM, Gatsonis CA: A hierarchical regression approach tometa-analysis of diagnostic test accuracy evaluations.Stat Med 2001, 20:2865-2884.18.Reitsma JB, Glas AS, Rutjes AWS, Scholten RJPM, Bossuyt PM, Zwind-erman AH: Bivariate analysis of sensitivity and specificity pro-duces informative summary measures in diagnostic reviews.Journal of Clinical Epidemiology 2005, 58:982-990.19.Walter SD: Properties of the summary receiver operatingcharacteristic (SROC) curve for diagnostic test data.Stat Med 2002, 21:1237-1256.20.DerSimonian R, Laird N: Meta-analysis in clinical trials.ControlClin Trials 1986, 7:177-188.21.Gupta JK, Chien PF, Voit D, Clark TJ, Khan KS: Ultrasonographicendometrial thickness for diagnosing endometrial pathology in women with postmenopausal bleeding: a meta-analysis.Acta Obstet Gynecol Scand 2002, 81:799-816.22.Khan KS, Kunz R, Kleijnen J, Antes G: Case study 4: Reviewingevidence on test accuracy.In Systematic Review to Support Evi-dence-based Medicine 2003 edition. London, The Royal Society of Medicine; 2003:109-119.23.Morgan M, Kalantri S, Flores L, Pai M: A commercial line probeassay for the rapid detection of rifampicin resistance in Mycobacterium tuberculosis: a systematic review and meta-analysis.BMC Infectious Diseases 2005, 5:62.24.Flores L, Pai M, Colford J M, Riley LW: In-house nucleic acidamplification tests for the detection of M ycobacterium tuberculosis in sputum specimens: meta-analysis and meta-regression.BMC Microbiol 2005, 5:55.25.Gisbert J, Abraira V: Accuracy of Helicobacter pylori Diagnos-tic Tests in Patients with Bleeding Peptic Ulcer: A System-atic Review and M eta-analysis.The American Journa l of Gastroenterology 2006, 101:848-863.26.Shiga T, Wajima Z, Inoue T, Sakamoto A: Predicting difficult intu-bation in apparently normal patients: a meta-analysis of bed-side screening test performance.Anesthesiology 2005, 103:429-437.27.Zijlstra JM, van der Werf G, Hoekstra OS, Hooft L, Huijgens PC: F-fluoro-deoxyglucose positron emission tomography for post-treatment evaluation of malignant lymphoma: a systematic review.Haematologica 2006, 91:522-9.28.Goodacre S, Sutton AJ, Sampson FC: Meta-Analysis: The Value ofClinical Assessment in the Diagnosis of Deep Venous Thrombosis.Annals of Internal Medicine 2005, 143:129-139.Pre-publication historyThe pre-publication history for this paper can be accessed here:/1471-2288/6/31/prepubAdditional File 1Meta-Disc data set. This file contains simulated data. It is provided to help users to validate statistical procedures shown in table 1.Click here for file[/content/supplementary/1471-2288-6-31-S1.dsc]Additional File 2STATA data set. This file contains simulated data. It is provided to help users to validate statistical procedures shown in table 1.Click here for file[/content/supplementary/1471-2288-6-31-S2.dta]。
- 1、下载文档前请自行甄别文档内容的完整性,平台不提供额外的编辑、内容补充、找答案等附加服务。
- 2、"仅部分预览"的文档,不可在线预览部分如存在完整性等问题,可反馈申请退款(可完整预览的文档不适用该条件!)。
- 3、如文档侵犯您的权益,请联系客服反馈,我们会尽快为您处理(人工客服工作时间:9:00-18:30)。
METADISC的SROC数据解读
简介
METADISC是一种常用于系统评价的统计指标,用于评估诊断试验的准确性和可靠性。
SROC(Summary Receiver Operating Characteristic)曲线是一种图形工具,用于可视化METADISC的结果。
本文将深入探讨METADISC的SROC数据解读,解释
其含义与应用。
什么是METADISC
METADISC是一种用于综合评价多个独立研究结果的统计方法。
它结合了不同研究
的结果,计算出一个汇总的效应量。
METADISC基于统计学中的元分析方法,通过
对各个独立研究结果进行权重分配,得出一个综合的效应量估计。
METADISC还提
供了一些其他的统计指标,例如敏感性、特异性、阳性似然比、阴性似然比等等。
为什么要使用METADISC
METADISC的使用有以下几个优势: 1. 整合多个研究结果:METADISC可以将多个
独立研究的结果整合到一个汇总结果中,提供更准确和可靠的估计。
2. 评估诊
断试验准确性:METADISC可以评估诊断试验的准确性和可靠性,帮助医生和研究
人员判断诊断试验的实际应用价值。
3. 提供各种统计指标:除了汇总效应量,METADISC还提供了一些其他的统计指标,如敏感性、特异性等等,帮助用户更全
面地评估研究结果。
SROC曲线的解读
SROC曲线是METADISC输出的重要图形之一,用来描述敏感性和1-特异性的关系。
下面是SROC曲线的解读。
SROC曲线的形状
SROC曲线是以敏感性为横坐标,1-特异性为纵坐标的曲线。
曲线的形状可以有多
种情况,如L型、非L型、U型等等。
不同形状的曲线反映了不同的诊断试验特征。
•L型曲线:L型曲线是指曲线突然下降到1-特异性=0,然后从该点开始逐渐上升。
L型曲线通常表示无阈值的诊断试验,也就是说,在任何阈值上,特
异性为1。
•非L型曲线:非L型曲线是指曲线不是L型的曲线。
非L型曲线有多种形状,表示不同的试验特征。
•U型曲线:U型曲线是指曲线下降到某个点,然后再上升。
U型曲线通常表示存在一个最佳阈值,诊断试验在该阈值上有最佳的敏感性和特异性。
SROC曲线的评估指标
除了曲线的形状外,SROC曲线还可以计算一些评估指标,如灵敏度、特异度等等。
•灵敏度:灵敏度是指在特定的阈值下,诊断试验能够正确识别出病人的准确性。
灵敏度越高,表示诊断试验对病人的识别能力越强。
•特异度:特异度是指在特定的阈值下,诊断试验能够正确识别出非病人的准确性。
特异度越高,表示诊断试验对非病人的识别能力越强。
利用SROC曲线做决策
根据SROC曲线的形状和评估指标,我们可以做出一些重要的决策,例如选择最佳
的诊断阈值。
1.选择最佳诊断阈值:通过对SROC曲线的观察,可以找到曲线上的最佳阈值
点,即能够在敏感性和特异性上达到平衡的点。
选择最佳诊断阈值可以帮助
医生和研究人员进行决策,找到最佳的诊断标准。
2.评估诊断试验的性能:通过SROC曲线的形状和评估指标,可以评估诊断试
验的性能。
比如,如果曲线呈现L型,表示诊断试验的特异性为1,可以排
除假阳性的结果。
3.与其他试验比较:通过SROC曲线的形状和评估指标,可以将不同试验的结
果进行比较,找出最佳的诊断试验。
总结
METADISC的SROC数据提供了一种评估诊断试验准确性和可靠性的方法。
SROC曲线是METADISC输出的重要图形,可以用来描述敏感性和1-特异性的关系。
通过SROC 曲线的解读和评估指标的计算,我们可以选择最佳的诊断阈值,评估诊断试验的性能,并与其他试验进行比较。
METADISC的应用在医疗领域具有重要的意义,可以
帮助医生和研究人员更准确地评估诊断试验的实际应用价值。