CFA二级公式表

- 1、下载文档前请自行甄别文档内容的完整性,平台不提供额外的编辑、内容补充、找答案等附加服务。
- 2、"仅部分预览"的文档,不可在线预览部分如存在完整性等问题,可反馈申请退款(可完整预览的文档不适用该条件!)。
- 3、如文档侵犯您的权益,请联系客服反馈,我们会尽快为您处理(人工客服工作时间:9:00-18:30)。
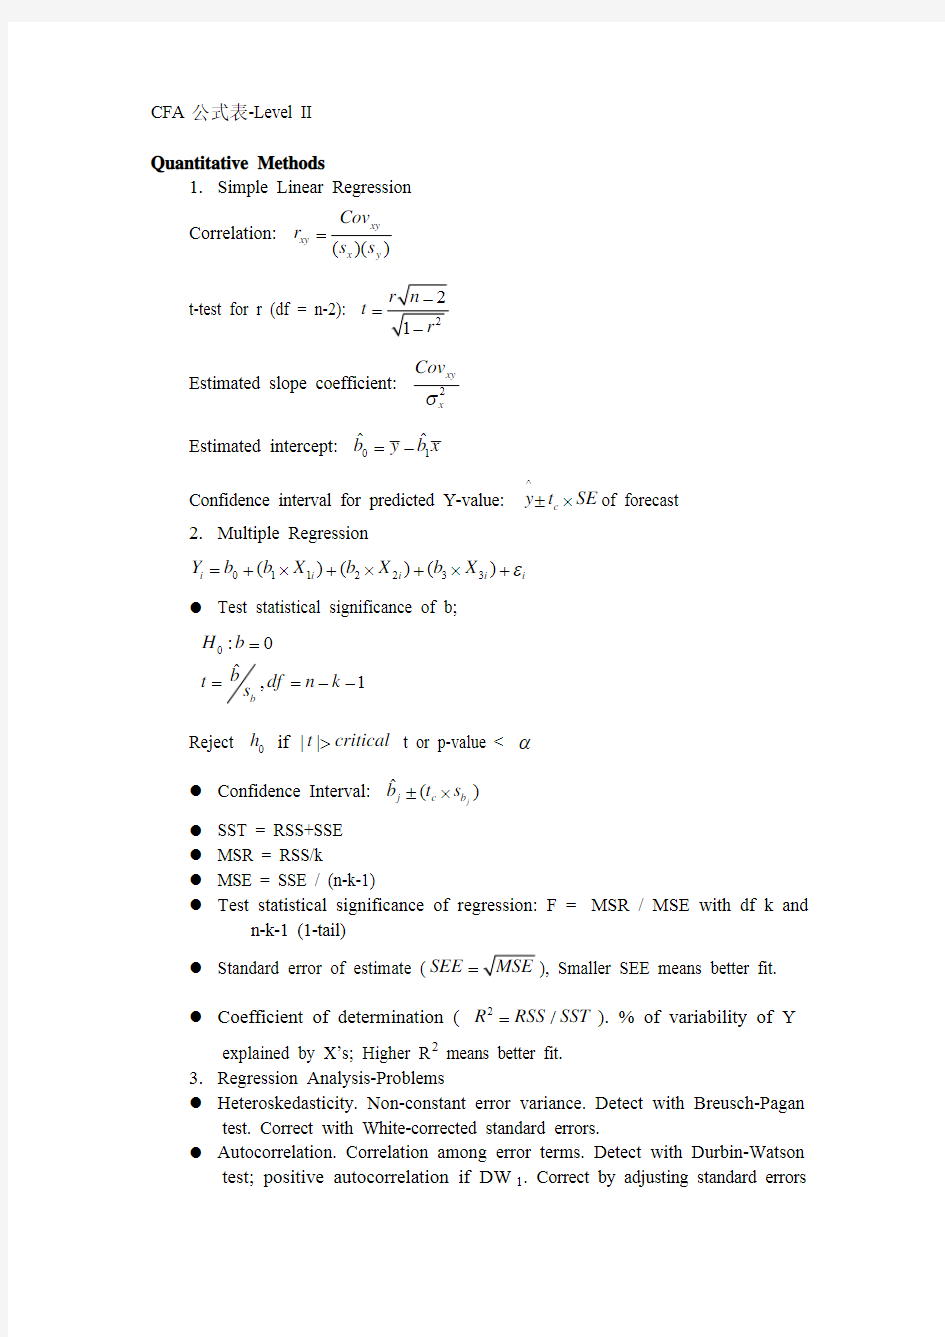
CFA 公式表-Level II
Quantitative Methods
1. Simple Linear Regression Correlation: ()()xy
xy x y Cov r s s =
t-test for r (df = n-2): t = Estimated slope coefficient: 2xy
x Cov σ Estimated intercept: 01
ˆˆb y b =-x Confidence interval for predicted Y-value: ^
c y t SE ±⨯of forecast
2. Multiple Regression
0112233()()()i i i Y b b X b X b X i i ε=+⨯+⨯+⨯+
● Test statistical significance of b; 0:0
ˆ,1b
H b b t df n k s ===-- Reject if t or p-value < 0h ||t critical >α
● Confidence Interval: ˆ()j
j c b b t s ±⨯●
SST = RSS+SSE ●
MSR = RSS/k ●
MSE = SSE / (n-k-1) ● Test statistical significance of regression: F = MSR / MSE with df k and
n-k-1 (1-tail)
●
Standard error of estimate (SEE =), Smaller SEE means better fit. ● Coefficient of determination (2/R RSS SST =). % of variability of Y
explained by X’s; Higher R 2 means better fit.
3. Regression Analysis-Problems
● Heteroskedasticity. Non-constant error variance. Detect with Breusch-Pagan
test. Correct with White-corrected standard errors.
● Autocorrelation. Correlation among error terms. Detect with Durbin-Watson
test; positive autocorrelation if DW using Hansen method. ● Multicollinearity. High correlation among X’s. Detect if F-test significant, t-test insignificant. Correct by dropping X variables. 4. Model Misspecification ● Omitting a variable. ● Variable should be transformed. ● Incorrectly pooling data. ● Using lagged dependent variable as independent variable. ● Forecasting the past. ● Measuring independent variables with error. 5. Effects of Misspecification Regression coefficients are biased and inconsistent, lack of confidence in hypothesis tests of the coefficients or in the model predictions. 6. Linear Trend Model: 01t t y b b t ε=++ 7. Log-Linear Trend Models: 01ln()t t y b b t ε=++ 8. Covariance Stationary: Mean and var. don’t change over time. To determine if a time series is covariance stationary, (1) plot data, (2) run an AR model and test correlations, and/or (3) perform Dickey Fuller test. 9. Unit Root: Coefficient on lagged dep.vb1=1. series with unit root is not covariance stationary. First differencing will often eliminate the unit root. 10. Autoregressive (AR) Models: Specified correctly if autocorrelation of residuals not significant: 01122......t t t p t p x b b x b x b x t ε---=+++++ 11. Mean Reverting Level For AR(1): 01(1) b b - 12. RMSE: square root of avg squared error. 13. Random Walk Time Series: 1t t x x t ε-=+ 14. Seasonality: Indicated by statistically significant lagged err. term. Correct by adding lagged term. 15. ARCH: Detected by estimating: 22011t t a a εεμ-=++ Variance o ARCH series: 22101t t a a σε+=+ ECONOMICS 1. One Third Rule: at given technology level, 1% increase in capital/labor hour leads to 1/3 % increase in real GDP per hour. 2. Rule of 70: approximate to double GDP = 70/growth rate. 3. Classical Growth Theory ● 4. Neoclassical Growth Theory
